SlideShare a Scribd company logo
1 of 10
Download to read offline
60/2014 - 15 April 2014
Unemployment in the EU28 regions in 2013
Regional unemployment rates ranged from 2.6%
in Oberbayern to 36.3% in Andalucía
Regional unemployment rates
1
varied widely across the 272 NUTS 2 regions
2
of the EU28 in 2013, with the lowest
rates recorded in the regions of Oberbayern in Germany (2.6%), Freiburg in Germany and Salzburg in Austria
(both 2.9%), Tübingen in Germany and Tirol in Austria (both 3.0%), while the highest rates were registered in five
Spanish regions: Andalucía (36.3%), Ceuta (35.6%), Melilla (34.4%), Canarias (34.1%) and Extremadura
(33.7%).
Among the regions, 49 had an unemployment rate of 5.4% or less in 2013, half the average for the EU28 (10.8%).
They included twenty-three regions in Germany, eight each in Austria and the United Kingdom, three each in the
Czech Republic and Romania, two in Belgium and one each in Italy and the Netherlands. At the other extreme,
27 regions had a rate higher than 21.6%, double that of the EU28: thirteen regions in Spain, ten in Greece, three
French Overseas Departments
3
and one region in Italy.
These data
4
on regional unemployment, compiled on the basis of the EU Labour Force Survey, are published by
Eurostat, the statistical office of the European Union.
0
5
10
15
20
25
30
35
40
Regional unemployment in Member States in 2013, %
National average
The bar shows for each Member State the range from the region with the lowest value to the region with the highest value
EU28 average
Youth unemployment rates varied from 4.4% in Oberbayern and Tübingen to 70.6% in Dytiki
Makedonia and 72.7% in Ceuta
In 2013, the average unemployment rate for young people
1
aged between 15 and 24 in the EU28 was 23.4%.
Regional differences in the unemployment rate for young people are however very marked. In the EU28 in 2013,
the lowest rates for young people were recorded in the German regions of Oberbayern and Tübingen (both 4.4%)
and Freiburg (4.7%), and the highest in Ceuta (72.7%) in Spain and Dytiki Makedonia (70.6%) and Ipeiros
(67.0%) in Greece. In more than three quarters of the EU28 regions, the unemployment rate for young people was
at least twice that for total unemployment.
Regions with highest and lowest unemployment rates in 2013, %
Total
Lowest Highest
1 Oberbayern (DE) 2.6 1 Andalucía (ES) 36.3
2=
Freiburg (DE) 2.9 2 Ciudad Autónoma de Ceuta (ES) 35.6
Salzburg (AT) 2.9 3 Ciudad Autónoma de Melilla (ES) 34.4
4=
Tübingen (DE) 3.0 4 Canarias (ES) 34.1
Tirol (AT) 3.0 5 Extremadura (ES) 33.7
6=
Praha (CZ) 3.1 6 Dytiki Makedonia (EL) 31.8
Mittelfranken (DE) 3.1 7 Castilla-la Mancha (ES) 30.1
Trier (DE) 3.1 8 Kentriki Makedonia (EL) 30.0
9 Vorarlberg (AT) 3.2 9 Región de Murcia (ES) 29.4
10=
Niederbayern (DE) 3.3 10 Réunion (FR) 28.9
Unterfranken (DE) 3.3
Schwaben (DE) 3.3
Young people (aged 15-24)
Lowest Highest
1=
Tübingen (DE) 4.4 1 Ciudad Autónoma de Ceuta (ES) (72.7)
Oberbayern (DE) 4.4 2 Dytiki Makedonia (EL) 70.6
3 Freiburg (DE) 4.7 3 Ipeiros (EL) 67.0
4 Schwaben (DE) 4.8 4 Andalucía (ES) 66.1
5 Mittelfranken (DE) 5.0 5 Canarias (ES) 65.3
6 Karlsruhe (DE) 5.8 6 Martinique (FR) 63.9
7=
Stuttgart (DE) 6.1 7 Kentriki Makedonia (EL) 61.8
Tirol (AT) (6.1) 8 Extremadura (ES) 61.7
9 Weser-Ems (DE) 6.7 9 Castilla-la Mancha (ES) 61.6
10=
Zeeland (NL) (7.0) 10 Attiki (EL) 60.6
Oberösterreich (AT) 7.0
In more than a quarter of the regions, the majority of the unemployed had been out of work for at
least a year
The long-term unemployment share, which is defined as the percentage of unemployed persons who have been
unemployed for 12 months or more, stood at 47.5% on average in the EU28 in 2013, and varied significantly across
the regions. In the EU28 in 2013, the lowest shares of long-term unemployed were recorded in six Swedish
regions: Övre Norrland (12.4%), Mellersta Norrland (13.1%), Norra Mellansverige (16.3%), Västsverige
(17.2%), Småland med öarna (17.3%) and Stockholm (17.5%), and the highest in the French Overseas
Departments of Guadeloupe (79.5%) and Guyane (77.6%) and Východné Slovensko (74.9%) in Slovakia.
Regions with highest and lowest long-term unemployment shares in 2013, %
Lowest Highest
1 Övre Norrland (SE) 12.4 1 Guadeloupe (FR) 79.5
2 Mellersta Norrland (SE) (13.1) 2 Guyane (FR) 77.6
3 Norra Mellansverige (SE) 16.3 3 Východné Slovensko (SK) 74.9
4 Västsverige (SE) 17.2 4 Dytiki Ellada (EL) 72.9
5 Småland med öarna (SE) 17.3 5 Stredné Slovensko (SK) 72.7
6 Stockholm (SE) 17.5
6=
Sterea Ellada (EL) 71.0
7 Nordjylland (DK) (18.3) Martinique (FR) 71.0
8 Östra Mellansverige (SE) 18.7 8 Peloponnisos (EL) 70.8
9 Oberösterreich (AT) (18.8) 9 Attiki (EL) 69.3
10=
Helsinki-Uusimaa (FI) 19.0 10 Kentriki Makedonia (EL) 69.0
Pohjois- ja Itä-Suomi (FI) 19.0
( ) Data with reduced reliability due to sample size.
1. The unemployment rate is defined as the percentage of unemployed persons aged 15-74 in the economically active
population. According to the recommendations of the International Labour Organisation, a person is deemed to be
unemployed if all three of the following conditions are met:
 he or she is without work during the survey reference week;
 he or she is available for work, being able to take up employment within two weeks;
 he or she has actively sought work over the past four weeks.
In particular, it should be noted that the youth unemployment rate does not reflect the proportion of all young people who are
unemployed, as not every young person participates in the labour market. Labour market participation of young persons
varies by country and region in the EU28, which influences the proportion of unemployed people in the total youth
population. For further details please refer to the Youth unemployment article in Statistics Explained:
http://epp.eurostat.ec.europa.eu/statistics_explained/index.php/Youth_unemployment
The EU28 average is calculated as the average of the regional values. The figures may slightly differ from the EU
unemployment rate published in the Eurostat database, for which methodological breaks (see footnotes 5 and 6) have been
corrected.
2. These data are based on the Nomenclature of Territorial Units for Statistics (NUTS) as modified in January 2011. NUTS
2010 provides a uniform, consistent breakdown of territorial units for the production of regional statistics for the EU. Level 2
of the nomenclature has 272 regions: Belgium (11), Bulgaria (6), the Czech Republic (8), Denmark (5), Germany (38),
Ireland (2), Greece (13), Spain (19), France (26), Croatia (2), Italy (21), Hungary (7), the Netherlands (12), Austria (9),
Poland (16), Portugal (7), Romania (8), Slovenia (2), Slovakia (4), Finland (5), Sweden (8) and the United Kingdom (37).
Estonia, Cyprus, Latvia, Lithuania, Luxembourg and Malta are all considered as single regions at NUTS 2 level. For a list of
the European statistical regions see:
http://epp.eurostat.ec.europa.eu/portal/page/portal/nuts_nomenclature/introduction.
The statistical regions in the candidate and EFTA countries follow the principles of the NUTS classification; however there is
no legal base. There are 44 regions in these countries at Level 2: Norway (7), Switzerland (7), and Turkey (26). Iceland,
Liechtenstein, Montenegro and the former Yugoslav Republic of Macedonia are all considered as single regions at Level 2.
3. Data for French Overseas Departments (Guadelope, Martinique, Guyane and Réunion) refer to the second quarter of 2013.
4. For further regional data, please see the Eurostat web site:
http://epp.eurostat.ec.europa.eu/portal/page/portal/region_cities/regional_statistics/data/database
5. For Estonia and Austria there is a break in the series between 2012 and 2013 due to census revisions.
6. INSEE, the French Statistical Office, has carried out an extensive revision of the Labour Force Survey questionnaire. The
new questionnaire was used from 1 January 2013 onwards. It impacts significantly the level of the French indicators
mentioned in this release. Detailed information on these methodological changes and their impact is available in INSEE's
website http://www.insee.fr/fr/themes/info-rapide.asp?id=14 Box "Pour en savoir plus". Due to this revision, comparisons
with the past should be avoided.
Issued by: Eurostat Press Office
Tim ALLEN
Tel: +352-4301-33 444
eurostat-pressoffice@ec.europa.eu
Eurostat news releases on the internet:
http://ec.europa.eu/eurostat
For further information on data:
Gorja BARTSCH
Tel: +352-4301-34 566
gorja.bartsch@ec.europa.eu
Daniela SCIRANKOVÁ
Tel: +352-4301-37 326
daniela.scirankova@ec.europa.eu
Follow Eurostat on Twitter: http://twitter.com/EU_Eurostat
For interactive maps on regional unemployment, visit Regional Statistics Illustrated:
http://epp.eurostat.ec.europa.eu/cache/RSI
Unemployment in the regions of the European Union
Unemployment rates, % Long-term
unemployment
share,%
Total Males Females
15-24 years
old
2012 2013 2013 2013 2013 2013
EU281
10.5 10.8 10.8 10.9 23.4 47.5
BELGIUM 7.5 8.4 8.6 8.2 23.7 46.0
Bruxelles-Capitale/Brussels Hoofdstedelijk 17.4 19.2 21.0 17.0 39.9 56.6
Vlaams Gewest 4.5 5.0 5.1 5.0 16.6 32.5
Prov. Antwerpen 5.3 6.2 6.2 6.2 19.1 35.9
Prov. Limburg (BE) 4.7 5.5 5.6 5.3 19.8 28.9
Prov. Oost-Vlaanderen 4.1 4.0 4.0 4.0 14.4 26.5
Prov. Vlaams Brabant 4.4 5.5 5.1 5.9 16.1 37.2
Prov. West-Vlaanderen 3.9 3.9 4.1 3.6 13.7 29.2
Région Wallonne 10.0 11.3 11.3 11.4 32.8 51.5
Prov. Brabant Wallon 7.0 8.2 8.6 7.8 (29.3) 50.3
Prov. Hainaut 12.1 13.2 13.5 12.9 40.5 53.5
Prov. Liège 10.7 11.7 11.3 12.1 26.9 53.6
Prov. Luxembourg (BE) 7.6 7.9 7.5 (8.3) (25.9) (36.9)
Prov. Namur 7.3 10.4 10.1 10.8 32.4 47.3
BULGARIA 12.3 12.9 13.9 11.8 28.4 57.3
Severna i Yugoiztochna Bulgaria 14.3 14.8 15.5 13.9 31.4 58.0
Severozapaden 12.3 14.0 16.0 11.6 (32.0) 63.7
Severen tsentralen 14.3 15.3 16.5 13.9 (29.3) 66.0
Severoiztochen 18.2 16.8 17.1 16.5 33.0 58.0
Yugoiztochen 11.9 13.0 13.0 13.1 30.7 46.5
Yugozapadna i Yuzhna tsentralna Bulgaria 10.4 11.2 12.3 10.0 25.6 56.4
Yugozapaden 8.2 9.8 10.9 8.6 20.6 53.9
Yuzhen tsentralen 13.8 13.5 14.6 12.2 34.1 59.3
CZECH REPUBLIC 7.0 7.0 5.9 8.3 19.0 43.4
Praha 3.1 3.1 3.2 3.1 9.7 34.8
Střední Čechy 4.6 5.2 4.6 6.0 14.7 34.4
Jihozápad 5.3 5.2 3.9 6.8 16.6 43.7
Severozápad 10.7 9.6 8.1 11.6 24.8 49.8
Severovýchod 8.0 8.3 6.7 10.2 19.7 39.4
Jihovýchod 7.6 6.8 5.7 8.2 19.4 42.0
Střední Morava 7.5 8.0 7.4 8.8 21.6 46.1
Moravskoslezsko 9.5 9.9 8.0 12.1 22.4 49.1
DENMARK 7.5 7.0 6.7 7.3 13.1 25.5
Hovedstaden 8.2 7.4 7.0 7.9 12.7 26.8
Sjælland 6.4 6.8 6.8 6.8 13.9 29.0
Syddanmark 7.9 7.2 6.8 7.7 12.8 28.5
Midtjylland 6.8 6.5 6.5 6.6 12.7 21.1
Nordjylland 7.9 6.4 6.3 6.6 14.4 (18.3)
( ) Data with reduced reliability due to sample size.
Unemployment in the regions of the European Union
Unemployment rates, % Long-term
unemployment
share,%
Total Males Females
15-24 years
old
2012 2013 2013 2013 2013 2013
EU281
10.5 10.8 10.8 10.9 23.4 47.5
GERMANY 5.5 5.3 5.6 5.0 7.9 44.4
Baden-Württemberg 3.4 3.4 3.4 3.4 5.4 33.6
Stuttgart 3.5 3.7 3.6 3.7 6.1 34.4
Karlsruhe 4.1 3.6 3.8 3.4 5.8 37.4
Freiburg 2.9 2.9 3.0 2.9 4.7 30.1
Tübingen 2.7 3.0 2.8 3.2 4.4 29.0
Bayern 3.2 3.1 3.0 3.2 4.9 34.6
Oberbayern 2.7 2.6 2.6 2.6 4.4 33.8
Niederbayern 3.4 3.3 3.1 3.6 u 39.1
Oberpfalz 3.2 3.4 3.1 3.8 u 39.2
Oberfranken 3.3 4.0 4.3 3.7 8.0 35.9
Mittelfranken 3.7 3.1 3.1 3.2 5.0 33.6
Unterfranken 3.5 3.3 3.1 3.6 u 31.6
Schwaben 3.2 3.3 3.0 3.6 4.8 32.6
Berlin 10.6 10.6 11.7 9.2 14.3 48.5
Brandenburg 8.3 7.4 8.1 6.5 11.2 53.3
Bremen 6.7 7.2 7.2 7.0 u 36.0
Hamburg 5.4 4.8 5.5 4.0 7.5 48.5
Hessen 4.7 4.4 4.7 3.9 8.2 36.6
Darmstadt 4.7 4.3 4.8 3.7 8.1 35.2
Gießen 5.1 4.6 4.5 4.6 u 42.0
Kassel 4.5 4.3 4.4 4.2 9.0 36.3
Mecklenburg-Vorpommern 10.8 10.1 11.1 8.9 10.8 53.4
Niedersachsen 5.0 5.0 5.4 4.5 8.0 42.9
Braunschweig 5.7 6.4 7.3 5.2 9.6 44.5
Hannover 5.5 5.5 5.6 5.3 8.6 44.3
Lüneburg 4.5 4.4 4.8 3.9 7.8 45.2
Weser-Ems 4.4 4.0 4.3 3.8 6.7 38.0
Nordrhein-Westfalen 5.9 6.0 6.7 5.3 9.4 45.1
Düsseldorf 6.6 6.4 7.3 5.4 10.1 48.6
Köln 5.4 5.9 6.5 5.2 8.7 44.0
Münster 5.0 5.1 5.5 4.7 8.5 44.1
Detmold 4.8 5.1 5.3 4.8 8.8 40.2
Arnsberg 6.9 6.8 7.6 5.8 10.2 44.3
Rheinland-Pfalz 4.0 4.1 4.2 4.0 8.0 35.9
Koblenz 4.0 3.8 3.8 3.9 7.3 36.1
Trier 2.7 3.1 3.4 u u u
Rheinhessen-Pfalz 4.4 4.5 4.6 4.4 9.7 35.5
Saarland 6.4 6.2 6.6 5.7 12.4 42.6
Sachsen 8.2 7.9 7.9 7.8 10.3 54.2
Dresden 7.6 7.3 7.6 6.9 9.8 51.2
Chemnitz 8.0 7.4 6.8 8.2 9.0 55.0
Leipzig 9.5 9.3 9.9 8.6 12.5 57.0
Sachsen-Anhalt 9.5 9.0 8.9 9.2 11.3 58.1
Schleswig-Holstein 5.1 5.0 5.5 4.4 7.3 45.2
Thüringen 7.2 6.0 5.8 6.3 8.8 51.4
ESTONIA5
: 8.6 9.1 8.2 18.7 44.5
IRELAND 14.7 13.0 15.0 10.7 26.8 59.9
Border, Midland and Western 16.5 14.2 15.8 12.1 30.3 61.9
Southern and Eastern 14.1 12.6 14.6 10.2 25.6 59.1
GREECE 24.2 27.3 24.3 31.3 58.3 67.5
Voreia Ellada 25.0 28.6 24.9 33.5 60.9 68.2
Anatoliki Makedonia, Thraki 22.5 26.4 25.0 28.5 59.8 68.9
Kentriki Makedonia 26.0 30.0 26.2 34.9 61.8 69.0
Dytiki Makedonia 29.9 31.8 27.3 38.2 70.6 65.2
Thessalia 22.6 25.4 20.6 31.8 57.4 66.5
Kentriki Ellada 23.2 25.8 22.0 31.2 58.9 68.7
Ipeiros 22.9 27.8 24.6 31.7 67.0 62.9
Ionia Nisia 14.7 18.3 13.7 24.8 49.8 46.7
Dytiki Ellada 25.5 28.3 24.0 34.7 58.8 72.9
Sterea Ellada 27.8 27.9 24.8 32.9 59.8 71.0
Peloponnisos 19.9 22.5 19.0 27.5 58.7 70.8
Attiki 25.3 28.2 26.5 30.3 60.6 69.3
Nisia Aigaiou, Kriti 19.8 22.9 19.3 28.1 43.0 53.6
Voreio Aigaio 21.2 21.3 18.0 27.2 (47.0) 68.2
Notio Aigaio 15.1 20.7 17.3 26.1 37.0 37.5
Kriti 21.7 24.4 20.7 29.3 45.3 56.5
: Data not shown due to break in series
( ) Data with reduced reliability due to sample size.
u Data not published due to small sample size.
Unemployment in the regions of the European Union
Unemployment rates, % Long-term
unemployment
share,%
Total Males Females
15-24 years
old
2012 2013 2013 2013 2013 2013
EU281
10.5 10.8 10.8 10.9 23.4 47.5
SPAIN 25.0 26.4 25.8 27.0 55.7 49.8
Noroeste 20.5 22.3 22.3 22.4 51.4 51.2
Galicia 20.7 22.1 22.2 21.9 50.2 50.3
Principado de Asturias 21.8 24.1 23.8 24.4 54.7 53.9
Cantabria 17.7 20.6 20.1 21.2 52.2 49.6
Noreste 16.6 18.1 17.5 18.8 48.5 45.9
País Vasco 14.9 15.8 15.7 16.0 46.3 48.8
Comunidad Foral de Navarra 16.2 18.1 17.3 19.1 48.1 39.4
La Rioja 20.5 19.9 18.9 21.1 (47.9) 42.6
Aragón 18.6 21.3 20.1 22.9 51.1 45.8
Comunidad de Madrid 19.0 20.2 19.7 20.8 48.9 50.4
Centro (ES) 25.5 27.2 25.1 29.8 57.4 50.2
Castilla y León 19.7 21.7 20.0 23.8 49.6 48.3
Castilla-La Mancha 28.5 30.1 27.4 33.7 61.6 54.7
Extremadura 33.0 33.7 31.8 36.1 61.7 45.2
Este 24.5 25.2 25.2 25.3 52.3 50.4
Cataluña 22.6 23.4 23.9 22.8 50.7 52.8
Comunidad Valenciana 27.7 28.6 27.6 29.8 56.7 49.3
Illes Balears 23.2 22.3 22.4 22.1 45.3 41.3
Sur 33.5 35.3 33.9 36.9 64.2 47.9
Andalucía 34.6 36.3 34.9 38.1 66.1 48.1
Región de Murcia 27.9 29.4 28.8 30.1 53.8 45.2
Ciudad Autónoma de Ceuta 38.5 35.6 29.4 44.4 (72.7) 65.2
Ciudad Autónoma de Melilla 28.6 34.4 34.4 (34.4) (56.0) 55.3
Canarias 33.0 34.1 34.6 33.4 65.3 55.0
FRANCE6
: 10.3 10.4 10.3 24.9 42.2
Île de France : 8.9 9.6 8.1 18.4 40.1
Bassin parisien : 10.7 10.7 10.7 27.4 41.8
Champagne-Ardenne : 10.4 10.0 10.8 29.7 37.5
Picardie : 11.4 10.9 12.1 29.3 45.4
Haute-Normandie : 11.6 11.7 11.5 30.8 47.4
Centre : 10.6 11.1 10.1 22.0 40.5
Basse-Normandie : 9.1 9.8 8.5 25.8 36.2
Bourgogne : 10.5 10.1 10.9 30.0 40.3
Nord - Pas-de-Calais : 14.7 15.1 14.2 34.7 48.8
Est : 10.7 10.7 10.7 26.9 41.4
Lorraine : 12.2 12.2 12.1 27.5 41.9
Alsace : 9.7 9.1 10.3 28.2 41.6
Franche-Comté : 9.5 10.3 8.7 (22.5) 39.8
Ouest : 8.7 8.3 9.2 21.5 36.0
Pays de la Loire : 8.8 8.5 9.2 20.7 36.1
Bretagne : 8.0 7.5 8.5 19.2 33.4
Poitou-Charentes : 9.9 9.3 10.5 26.4 39.8
Sud-ouest : 8.6 8.8 8.3 20.6 35.9
Aquitaine : 8.9 9.0 8.8 21.8 33.5
Midi-Pyrénées : 8.6 9.0 8.2 20.5 36.4
Limousin : 6.9 7.1 (6.7) u (47.3)
Centre-est : 8.5 8.3 8.6 20.2 34.7
Rhône-Alpes : 8.4 8.4 8.4 19.5 34.0
Auvergne : 8.9 8.1 9.8 23.9 37.6
Méditerranée : 11.5 11.3 11.7 28.5 42.1
Languedoc-Roussillon : 12.9 12.7 13.1 36.4 45.6
Provence-Alpes-Côte d'Azur : 10.8 10.8 10.9 24.6 40.4
Corse : (12.4) u (15.5) u u
Départements d'Outre-Mer : 26.2 25.1 27.4 57.0 72.1
Guadeloupe : 26.2 24.0 28.3 58.4 79.5
Martinique : 22.8 22.8 22.8 63.9 71.0
Guyane : 21.3 16.7 26.3 (41.1) 77.6
Réunion : 28.9 28.3 29.7 57.3 68.3
CROATIA 15.8 17.1 17.7 16.5 49.8 63.7
Jadranska Hrvatska 14.8 14.8 15.2 14.4 45.4 58.6
Kontinentalna Hrvatska 16.3 18.2 18.8 17.5 51.4 65.6
: Data not shown due to break in series
( ) Data with reduced reliability due to sample size.
u Data not published due to small sample size.
Unemployment in the regions of the European Union
Unemployment rates, % Long-term
unemployment
share,%
Total Males Females
15-24 years
old
2012 2013 2013 2013 2013 2013
EU281
10.5 10.8 10.8 10.9 23.4 47.5
ITALY 10.7 12.2 11.5 13.1 40.0 56.4
Nord Ovest 8.0 8.9 8.4 9.6 34.3 51.8
Piemonte 9.2 10.6 10.2 11.1 40.2 54.3
Valle d’Aosta / Vallée d’Aoste 7.1 8.4 8.5 (8.3) u (34.2)
Liguria 8.1 9.9 9.2 10.9 42.1 50.5
Lombardia 7.5 8.1 7.6 8.8 30.8 50.8
Nord Est 6.7 7.7 6.6 9.3 26.9 45.8
Provincia Autonoma di Bolzano/Bozen 4.1 4.4 3.9 5.0 12.2 26.2
Provincia Autonoma di Trento 6.1 6.6 5.4 8.0 23.5 32.9
Veneto 6.6 7.6 6.2 9.5 25.3 49.9
Friuli-Venezia Giulia 6.8 7.7 6.6 9.1 24.2 43.6
Emilia-Romagna 7.1 8.5 7.4 9.7 33.3 44.9
Centro (IT) 9.5 10.9 9.8 12.2 39.8 52.8
Toscana 7.8 8.7 7.6 10.1 33.4 46.4
Umbria 9.8 10.4 9.4 11.7 36.5 47.1
Marche 9.1 11.1 9.8 12.6 36.1 50.9
Lazio 10.8 12.3 11.2 13.7 45.9 57.1
Sud 16.9 19.6 18.4 21.6 50.6 63.3
Abruzzo 10.8 11.4 11.2 11.8 37.7 57.7
Molise 12.0 15.8 15.8 15.8 48.9 60.1
Campania 19.3 21.5 20.1 23.8 51.7 67.2
Puglia 15.7 19.8 17.8 23.3 49.7 57.9
Basilicata 14.5 15.2 15.4 14.8 55.1 64.0
Calabria 19.3 22.2 21.5 23.5 56.1 64.8
Isole 17.7 20.0 19.4 21.2 53.9 62.5
Sicilia 18.6 21.0 19.9 23.0 53.8 64.7
Sardegna 15.5 17.5 17.9 17.0 54.2 55.9
CYPRUS 11.8 15.9 16.5 15.2 38.9 38.3
LATVIA 15.0 11.9 12.6 11.1 23.2 48.4
LITHUANIA 13.4 11.8 13.1 10.5 21.9 42.9
LUXEMBOURG (GRAND-DUCHY) 5.1 5.8 5.4 6.4 15.5 30.4
HUNGARY 10.9 10.2 10.2 10.2 27.2 48.6
Közép Magyarország 9.2 8.7 9.3 8.0 25.9 55.0
Dunántúl 9.6 8.6 8.4 8.8 22.0 43.7
Közép Dunántúl 9.8 8.8 8.4 9.4 23.0 47.3
Nyugat Dunántúl 7.4 7.8 7.4 8.2 21.5 36.8
Dél Dunántúl 12.0 9.1 9.5 8.7 21.3 46.3
Alföld es Észak 13.5 12.9 12.6 13.4 31.9 47.5
Észak Magyaroszág 16.6 12.9 12.8 13.0 30.3 51.8
Észak Alföld 13.9 14.4 13.7 15.3 35.7 43.9
Dél Alföld 10.5 11.3 11.1 11.6 28.5 48.6
MALTA 6.4 6.5 6.5 6.4 13.5 44.5
NETHERLANDS 5.3 6.7 7.1 6.3 11.0 35.4
Noord-Nederland 5.9 7.3 7.8 6.7 11.8 34.5
Groningen 6.2 7.5 8.3 6.5 11.5 34.0
Friesland (NL) 5.7 7.8 8.1 7.3 13.0 33.9
Drenthe 5.7 6.5 6.8 6.2 10.8 36.4
Oost-Nederland 5.1 6.6 7.0 6.1 11.4 35.3
Overijssel 5.1 6.7 7.2 6.1 11.2 35.0
Gelderland 4.8 6.1 6.6 5.4 10.5 35.0
Flevoland 6.6 9.2 8.5 9.9 17.3 36.6
West-Nederland 5.4 6.8 7.1 6.4 10.9 36.8
Utrecht 4.7 5.8 6.3 5.3 9.6 27.8
Noord-Holland 5.0 6.6 7.1 6.1 11.9 34.8
Zuid-Holland 6.3 7.4 7.6 7.2 11.0 40.4
Zeeland 3.1 4.7 5.0 4.3 (7.0) 43.7
Zuid-Nederland 4.8 6.3 6.7 5.9 10.4 32.8
Noord-Brabant 4.7 6.1 6.5 5.8 9.7 32.6
Limburg (NL) 4.9 6.7 7.1 6.2 12.0 33.1
AUSTRIA5
: 4.9 4.9 4.9 9.2 24.3
Ostösterreich : 6.4 6.5 6.2 12.2 27.4
Burgenland (AT) : (4.0) u u u u
Niederösterreich : 4.5 4.7 4.4 10.0 23.8
Wien : 8.4 8.6 8.2 14.9 29.5
Südösterreich : 4.4 4.2 4.7 8.8 24.5
Kärnten : 5.3 4.8 5.8 (8.9) (23.6)
Steiermark : 4.0 3.9 4.2 8.7 25.0
Westösterreich : 3.5 3.5 3.4 6.4 17.7
Oberösterreich : 4.0 4.2 3.8 7.0 (18.8)
Salzburg : 2.9 (3.1) (2.7) u u
Tirol : 3.0 (2.7) 3.4 (6.1) u
Vorarlberg : 3.2 (3.3) u u u
: Data not shown due to break in series
( ) Data with reduced reliability due to sample size.
u Data not published due to small sample size.
Unemployment in the regions of the European Union
Unemployment rates, % Long-term
unemployment
share,%
Total Males Females
15-24 years
old
2012 2013 2013 2013 2013 2013
EU281
10.5 10.8 10.8 10.9 23.4 47.5
POLAND 10.1 10.3 9.7 11.1 27.3 42.5
Region Centralny 9.0 9.1 8.8 9.4 21.0 41.6
Łódzkie 11.1 11.1 10.6 11.7 23.8 48.1
Mazowieckie 8.0 8.0 7.8 8.2 19.3 36.7
Region Południowy 9.8 10.2 9.3 11.3 27.9 45.2
Małopolskie 10.4 10.9 10.3 11.6 30.9 47.2
Śląskie 9.4 9.7 8.6 11.1 25.6 43.6
Region Wschodni 11.7 12.0 11.8 12.2 34.3 42.3
Lubelskie 10.5 10.3 10.1 10.6 31.0 41.4
Podkarpackie 13.2 14.4 14.3 14.5 43.5 38.4
Świętokrzyskie 13.1 13.0 12.7 13.5 32.2 47.8
Podlaskie 9.2 9.9 9.8 10.1 (25.8) 45.7
Region Północno-Zachodni 9.2 9.3 8.1 10.8 25.0 41.7
Wielkopolskie 8.5 8.8 6.8 11.4 21.9 45.2
Zachodniopomorskie 10.9 10.1 10.6 9.5 32.2 44.5
Lubuskie 9.0 9.7 8.9 10.7 (27.8) (27.1)
Region Południowo-Zachodni 10.7 10.8 10.0 11.8 27.9 40.6
Dolnośląskie 11.1 11.3 10.5 12.2 30.1 42.1
Opolskie 9.5 9.4 8.5 10.5 (21.8) (35.3)
Region Północny 10.7 11.2 10.5 12.1 29.2 42.2
Kujawsko-Pomorskie 11.9 12.4 11.0 14.3 32.3 40.2
Warmińsko-Mazurskie 11.0 11.4 10.7 12.3 (28.8) 45.8
Pomorskie 9.5 10.0 10.0 10.2 26.5 41.8
PORTUGAL 15.7 16.3 16.1 16.4 37.7 56.3
Continente 15.6 16.2 15.9 16.5 37.3 56.0
Norte 16.1 17.2 16.4 18.1 35.1 58.7
Algarve 17.9 17.1 18.2 15.9 39.5 50.1
Centro (PT) 12.0 11.7 11.4 12.0 31.0 50.5
Lisboa 17.6 18.5 19.1 17.8 45.5 57.3
Alentejo 15.9 16.8 15.7 18.2 38.9 53.0
Região autónoma dos Açores 15.3 17.0 19.3 13.9 39.6 58.0
Região autónoma da Madeira 17.5 18.3 19.8 16.7 51.5 64.1
ROMANIA 7.0 7.3 7.9 6.6 23.6 46.4
Macroregiunea unu 6.9 6.6 6.7 6.4 23.6 50.3
Nord-Vest 4.5 4.1 3.9 4.3 15.8 48.8
Centru 9.8 9.7 10.0 9.3 33.1 51.1
Macroregiunea doi 6.7 6.7 7.5 5.7 18.7 49.6
Nord-Est 4.3 4.6 5.1 4.0 12.4 42.4
Sud-Est 10.2 10.0 10.9 8.7 29.6 54.8
Macroregiunea trei 8.3 9.0 9.6 8.3 30.6 36.8
Sud-Muntenia 9.9 9.9 10.3 9.5 32.4 44.4
Bucureşti-Ilfov 6.2 7.8 8.7 6.8 26.1 23.6
Macroregiunea patru 6.0 6.8 7.6 5.7 23.5 54.1
Sud-Vest Oltenia 6.7 8.0 9.6 5.8 25.0 60.8
Vest 5.1 5.3 5.1 5.6 21.3 41.8
SLOVENIA 8.8 10.1 9.4 10.9 21.6 51.0
Vzhodna Slovenija 10.0 11.4 10.5 12.6 26.5 53.1
Zahodna Slovenija 7.6 8.7 8.2 9.2 16.4 48.0
SLOVAKIA 14.0 14.2 14.0 14.5 33.7 70.2
Bratislavský kraj 5.7 6.4 6.2 6.5 19.7 42.1
Západné Slovensko 11.3 11.7 10.5 13.2 29.5 67.1
Stredné Slovensko 16.2 16.8 17.4 16.0 35.8 72.7
Východné Slovensko 19.0 18.5 18.3 18.6 39.8 74.9
FINLAND 7.7 8.2 8.8 7.5 19.9 20.6
Manner-Suomi 7.7 8.2 8.9 7.5 19.9 20.6
Länsi-Suomi 8.2 8.5 9.3 7.6 21.9 22.7
Helsinki-Uusimaa 6.3 6.7 7.2 6.2 17.2 19.0
Etelä-Suomi 7.5 8.4 8.9 7.9 20.8 22.3
Pohjois- ja Itä-Suomi 9.5 9.9 10.6 9.1 20.8 19.0
Åland u u u u u u
SWEDEN 8.0 8.1 8.2 7.9 23.5 17.7
Östra Sverige 7.6 7.7 7.7 7.6 21.7 18.1
Stockholm 6.8 6.9 6.8 6.9 19.8 17.5
Östra Mellansverige 8.6 8.8 8.9 8.7 24.1 18.7
Södra Sverige 8.2 8.5 8.6 8.3 24.8 18.5
Småland med öarna 7.4 7.1 7.2 7.0 22.2 17.3
Sydsverige 9.4 9.9 10.2 9.5 27.5 20.5
Västsverige 7.7 8.0 8.1 7.9 24.1 17.2
Norra Sverige 8.3 8.0 8.3 7.5 24.4 14.6
Norra Mellansverige 8.6 8.8 8.6 9.0 26.6 16.3
Mellersta Norrland 8.4 7.2 7.9 6.3 23.4 (13.1)
Övre Norrland 7.7 7.2 8.2 6.0 21.5 12.4
( ) Data with reduced reliability due to sample size.
u Data not published due to small sample size.
Unemployment in the regions of the European Union
Unemployment rates, % Long-term
unemployment
share,%
Total Males Females
15-24 years
old
2012 2013 2013 2013 2013 2013
EU281
10.5 10.8 10.8 10.9 23.4 47.5
UNITED KINGDOM 7.9 7.5 7.9 7.0 20.5 36.2
North East (England) 10.2 10.1 10.6 9.4 26.3 38.7
Tees Valley & Durham 11.6 10.9 11.0 10.8 30.0 38.3
Northumberland and Tyne & Wear 9.1 9.4 10.3 8.3 23.6 39.1
North West (England) 8.8 8.1 8.8 7.2 19.2 36.4
Cumbria 6.4 5.1 (5.8) (4.4) (12.4) (37.9)
Greater Manchester 10.2 9.5 10.8 8.0 21.8 37.9
Lancashire 7.8 7.2 7.2 7.2 19.9 31.7
Cheshire 5.9 5.2 5.1 5.4 (15.0) (33.2)
Merseyside 9.8 8.9 10.1 7.6 18.0 38.0
Yorkshire & the Humber 9.1 8.8 9.5 7.9 22.8 41.2
East Yorkshire & Northern Lincolnshire 9.8 8.4 8.4 8.4 20.8 40.0
North Yorkshire 5.1 4.4 5.6 (2.9) (13.0) (37.5)
South Yorkshire 10.5 10.5 10.4 10.7 25.2 38.2
West Yorkshire 9.5 9.5 10.7 7.9 24.7 44.3
East Midlands (England) 7.8 7.3 7.7 6.9 18.2 34.2
Derbyshire & Nottinghamshire 8.3 7.2 7.9 6.5 19.1 32.4
Leicestershire, Rutland & Northamptonshire 6.9 7.8 7.6 7.9 16.5 33.7
Lincolnshire 8.5 6.4 7.0 (5.6) (19.2) (41.5)
West Midlands (England) 8.5 9.1 9.5 8.5 24.7 43.3
Herefordshire, Worcestershire & Warwickshire 4.9 5.1 5.8 4.2 15.5 33.1
Shropshire & Staffordshire 6.6 6.1 6.6 5.5 15.3 31.7
West Midlands 11.7 12.9 13 12.8 33.5 48.7
East of England 6.7 6.0 6.2 5.8 17.5 33.2
East Anglia 6.4 6.2 7.0 5.3 17.9 33.3
Bedfordshire & Hertfordshire 6.3 5.6 5.1 6.1 15.5 31.7
Essex 7.4 6.3 6.3 6.4 18.8 34.4
London 8.8 8.4 8.3 8.6 24.7 34.7
Inner London 9.1 8.6 8.6 8.6 23.9 33.9
Outer London 8.6 8.3 8.1 8.6 25.1 35.3
South East (England) 6.3 5.8 6.1 5.5 17.7 27.9
Berkshire, Buckinghamshire & Oxfordshire 5.6 5.1 5.6 4.6 17.4 31.3
Surrey, East & West Sussex 5.8 5.4 5.4 5.5 16.4 25.5
Hampshire & Isle of Wight 6.3 5.7 5.9 5.4 16.6 24.5
Kent 8.0 7.6 8.2 6.9 21.4 30.5
South West (England) 5.8 6.2 6.7 5.5 17.5 31.5
Gloucestershire, Wiltshire & Bristol/Bath area 6.1 6.2 6.7 5.7 17.7 29.7
Dorset & Somerset 5.1 5.5 6.1 4.9 14.7 34.7
Cornwall & Isles of Scilly 5.6 5.6 (6.4) (4.8) (14.3) (34.9)
Devon 5.9 7.1 7.8 6.3 21.5 31.1
Wales 8.6 7.7 8.1 7.2 21.2 36.9
West Wales & the Valleys 9.2 7.8 8.5 7.1 20.5 39.3
East Wales 7.6 7.4 7.5 7.3 22.4 33.0
Scotland 7.9 7.1 7.7 6.6 19.2 35.7
Eastern Scotland 7.5 7.1 7.6 6.7 23.0 34.7
South Western Scotland 9.8 8.3 8.8 7.6 19.2 39.8
North Eastern Scotland 4.7 4.7 (4.0) (5.6) u u
Highlands & Islands 4.6 4.4 (6.4) u u u
Northern Ireland 7.4 7.6 9.6 5.1 22.2 53.3
( ) Data with reduced reliability due to sample size.
u Data not published due to small sample size.
Unemployment in the regions of the EFTA and Candidate countries
Unemployment rates, % Long-term
unemployment
share,%
Total Males Females
15-24 years
old
2012 2013 2013 2013 2013 2013
EU281
10.5 10.8 10.8 10.9 23.4 47.5
ICELAND 6.0 5.4 5.6 5.1 10.6 18.2
NORWAY 3.1 3.4 3.6 3.2 9.1 19.8
Oslo og Akershus 3.2 3.9 3.9 3.9 10.3 21.1
Hedmark og Oppland 3.0 2.9 3.1 2.8 9.2 (23.3)
Sør-Østlandet 3.5 3.9 4.3 3.5 10.1 20.3
Agder og Rogaland 2.7 3.2 3.4 2.9 7.5 20.6
Vestlandet 2.9 3.1 3.2 2.9 8.8 14.6
Trøndelag 3.3 2.6 2.7 2.5 7.0 (21.8)
Nord-Norge 3.3 3.2 3.4 3.0 10.0 (18.7)
SWITZERLAND 4.2 4.4 4.3 4.5 8.5 30.4
Région lémanique 6.6 6.6 6.5 6.7 16.0 33.2
Espace Mittelland 3.5 3.8 3.7 4.0 7.8 30.2
Nordwestschweiz 4.1 4.1 4.2 4.1 6.2 33.5
Zürich 3.6 4.2 4.4 4.0 6.9 26.8
Ostschweiz 3.3 3.6 3.3 3.9 6.7 24.6
Zentralschweiz 2.7 2.6 2.3 3.1 (4.3) (26.3)
Ticino 6.9 6.8 6.4 7.3 (16.2) (38.4)
FORMER YUGOSLAV REP. OF MACEDONIA 31.0 29.0 29.0 29.0 51.9 82.3
TURKEY 8.1 8.7 7.9 10.6 16.9 21.6
Istanbul 10.7 10.6 9.2 13.9 18.3 20.8
Bati Marmara 5.4 6.0 4.9 8.3 14.4 20.2
Tekirdağ, Edirne, Kirklareli 6.2 6.4 4.9 9.6 13.3 17.7
Balikesir, Çanakkale 4.5 5.6 5.0 6.7 15.8 23.5
Ege 8.5 9.3 7.4 12.8 18.4 25.1
Izmir 13.3 14.3 10.7 20.8 25.2 29.3
Aydin, Denizli, Mugla 6.6 6.0 5.2 7.5 12.8 16.1
Manisa, Afyonkarahisar, Kütahya, Usak 4.1 5.2 4.7 6.1 12.9 18.7
Doğu Marmara 7.6 7.5 6.1 10.6 16.6 23.3
Bursa, Eskisehir, Bilecik 6.4 6.0 4.8 8.7 13.2 19.4
Kocaeli, Sakarya, Düzce, Bolu, Yalova 8.9 9.0 7.5 12.4 20.0 25.9
Bati Anadolu 7.3 7.5 5.8 11.6 16.2 24.7
Ankara 8.3 9.0 6.8 14.6 20.7 26.4
Konya, Karaman 5.0 3.8 3.6 4.4 7.7 14.9
Akdeniz 8.5 9.8 9.0 11.5 17.6 17.3
Antalya, Isparta, Burdur 7.3 7.2 6.3 9.0 15.0 15.9
Adana, Mersin 9.1 11.3 9.7 15.0 19.6 17.3
Hatay, Kahramanmaras, Osmaniye 9.0 10.8 11.1 10.0 17.3 18.6
Orta Anadolu 6.9 7.3 7.0 8.1 14.9 22.8
Kirikkale, Aksaray, Nigde, Nevsehir, Kirsehir 6.2 5.5 5.4 5.9 12.8 16.6
Kayseri, Sivas, Yozgat 7.3 8.4 8.0 9.5 16.1 25.4
Bati Karadeniz 5.3 5.7 4.9 7.1 14.6 24.6
Zonguldak, Karabük, Bartin 6.5 6.2 5.1 8.0 15.8 18.5
Kastamonu, Çankiri, Sinop 4.5 5.6 4.6 7.5 13.6 36.9
Samsun, Tokat, Çorum, Amasya 4.9 5.5 5.0 6.6 14.4 24.2
Doğu Karadeniz 5.2 6.0 6.8 4.6 20.3 34.3
Kuzeydoğu Anadolu 5.9 5.9 6.7 4.1 10.0 16.7
Erzurum, Erzincan, Bayburt 5.5 6.1 7.0 4.1 11.2 17.7
Ağri, Kars, Igdir, Ardahan 6.3 5.6 6.4 4.0 9.3 15.9
Ortadoğu Anadolu 6.6 7.3 8.5 4.6 14.0 15.4
Malatya, Elazig, Bingöl, Tunceli 5.8 5.7 6.0 5.1 11.6 9.8
Van, Mus, Bitlis, Hakkari 7.5 9.2 10.8 3.6 16.0 19.3
Güneydoğu Anadolu 11.0 13.1 13.8 10.1 18.9 18.7
Gaziantep, Adiyaman, Kilis 10.6 6.2 6.2 6.3 10.2 13.9
Şanliurfa, Diyarbakir 6.0 16.0 17.1 10.9 19.6 13.7
Mardin, Batman, Sirnak, Siirt 18.8 19.4 19.7 17.5 27.6 28.3
( ) Data with reduced reliability due to sample size.

More Related Content

What's hot

Eurostat book smarter, greener, more inclusive indicators to support the eur...
Eurostat book  smarter, greener, more inclusive indicators to support the eur...Eurostat book  smarter, greener, more inclusive indicators to support the eur...
Eurostat book smarter, greener, more inclusive indicators to support the eur...Mario Verissimo
 
Undervalued Sustainable Practice?
Undervalued Sustainable Practice? Undervalued Sustainable Practice?
Undervalued Sustainable Practice? Rural Soc
 
2009 Eurostat Europe In Figures Yearbook 2009
2009 Eurostat Europe In Figures Yearbook 20092009 Eurostat Europe In Figures Yearbook 2009
2009 Eurostat Europe In Figures Yearbook 2009guest4c3ea7
 
A-whole-of-society-approach-to-addressing-noncommunicable-diseases-ncds
A-whole-of-society-approach-to-addressing-noncommunicable-diseases-ncdsA-whole-of-society-approach-to-addressing-noncommunicable-diseases-ncds
A-whole-of-society-approach-to-addressing-noncommunicable-diseases-ncdsWHO Regional Office for Europe
 
2 28112018-ap-en
2 28112018-ap-en2 28112018-ap-en
2 28112018-ap-enLaLibre
 

What's hot (7)

Qlfs q4 2019 final final for sg (1)
Qlfs q4 2019 final  final for sg (1)Qlfs q4 2019 final  final for sg (1)
Qlfs q4 2019 final final for sg (1)
 
QLFS_Q3_2019 Presentation
QLFS_Q3_2019 PresentationQLFS_Q3_2019 Presentation
QLFS_Q3_2019 Presentation
 
Eurostat book smarter, greener, more inclusive indicators to support the eur...
Eurostat book  smarter, greener, more inclusive indicators to support the eur...Eurostat book  smarter, greener, more inclusive indicators to support the eur...
Eurostat book smarter, greener, more inclusive indicators to support the eur...
 
Undervalued Sustainable Practice?
Undervalued Sustainable Practice? Undervalued Sustainable Practice?
Undervalued Sustainable Practice?
 
2009 Eurostat Europe In Figures Yearbook 2009
2009 Eurostat Europe In Figures Yearbook 20092009 Eurostat Europe In Figures Yearbook 2009
2009 Eurostat Europe In Figures Yearbook 2009
 
A-whole-of-society-approach-to-addressing-noncommunicable-diseases-ncds
A-whole-of-society-approach-to-addressing-noncommunicable-diseases-ncdsA-whole-of-society-approach-to-addressing-noncommunicable-diseases-ncds
A-whole-of-society-approach-to-addressing-noncommunicable-diseases-ncds
 
2 28112018-ap-en
2 28112018-ap-en2 28112018-ap-en
2 28112018-ap-en
 

Viewers also liked

THE FEDERAL RESERVE CAN'T HELP YOU
THE FEDERAL RESERVE CAN'T HELP YOUTHE FEDERAL RESERVE CAN'T HELP YOU
THE FEDERAL RESERVE CAN'T HELP YOUJennifer Anderson
 
Bases Idees de Negoci 2016
Bases Idees de Negoci 2016Bases Idees de Negoci 2016
Bases Idees de Negoci 2016PepeCarles
 
THINK DIFFERENT-SAVINGS.GOLD.INCOME
THINK DIFFERENT-SAVINGS.GOLD.INCOMETHINK DIFFERENT-SAVINGS.GOLD.INCOME
THINK DIFFERENT-SAVINGS.GOLD.INCOMEJennifer Anderson
 
WE ARE CELEBRATING OUR CHOICE!
WE ARE CELEBRATING OUR CHOICE!WE ARE CELEBRATING OUR CHOICE!
WE ARE CELEBRATING OUR CHOICE!Jennifer Anderson
 
Searching For Reliable Sources
Searching For Reliable SourcesSearching For Reliable Sources
Searching For Reliable Sourceskplese
 
Bases Concurs Idees de Negoci 2015
Bases Concurs Idees de Negoci 2015Bases Concurs Idees de Negoci 2015
Bases Concurs Idees de Negoci 2015PepeCarles
 
Convocatoria Comité de Currículo de Facultad 2014 2
Convocatoria Comité de Currículo de Facultad 2014 2Convocatoria Comité de Currículo de Facultad 2014 2
Convocatoria Comité de Currículo de Facultad 2014 2Programa Usco
 
3er. concurs presentació idees negoci 2014
3er. concurs presentació idees negoci 20143er. concurs presentació idees negoci 2014
3er. concurs presentació idees negoci 2014PepeCarles
 

Viewers also liked (14)

THE FEDERAL RESERVE CAN'T HELP YOU
THE FEDERAL RESERVE CAN'T HELP YOUTHE FEDERAL RESERVE CAN'T HELP YOU
THE FEDERAL RESERVE CAN'T HELP YOU
 
Bases Idees de Negoci 2016
Bases Idees de Negoci 2016Bases Idees de Negoci 2016
Bases Idees de Negoci 2016
 
ARE YOU READY
ARE YOU READYARE YOU READY
ARE YOU READY
 
IT'S TIME
IT'S TIMEIT'S TIME
IT'S TIME
 
THINK DIFFERENT-SAVINGS.GOLD.INCOME
THINK DIFFERENT-SAVINGS.GOLD.INCOMETHINK DIFFERENT-SAVINGS.GOLD.INCOME
THINK DIFFERENT-SAVINGS.GOLD.INCOME
 
PIECE OF MIND
PIECE OF MINDPIECE OF MIND
PIECE OF MIND
 
WE ARE CELEBRATING OUR CHOICE!
WE ARE CELEBRATING OUR CHOICE!WE ARE CELEBRATING OUR CHOICE!
WE ARE CELEBRATING OUR CHOICE!
 
SURVIVING ECONOMIC COLLAPSE
SURVIVING ECONOMIC COLLAPSESURVIVING ECONOMIC COLLAPSE
SURVIVING ECONOMIC COLLAPSE
 
Searching For Reliable Sources
Searching For Reliable SourcesSearching For Reliable Sources
Searching For Reliable Sources
 
Introduction to the Actor Model
Introduction to the Actor ModelIntroduction to the Actor Model
Introduction to the Actor Model
 
Bases Concurs Idees de Negoci 2015
Bases Concurs Idees de Negoci 2015Bases Concurs Idees de Negoci 2015
Bases Concurs Idees de Negoci 2015
 
Convocatoria Comité de Currículo de Facultad 2014 2
Convocatoria Comité de Currículo de Facultad 2014 2Convocatoria Comité de Currículo de Facultad 2014 2
Convocatoria Comité de Currículo de Facultad 2014 2
 
3er. concurs presentació idees negoci 2014
3er. concurs presentació idees negoci 20143er. concurs presentació idees negoci 2014
3er. concurs presentació idees negoci 2014
 
Flash shop
Flash shopFlash shop
Flash shop
 

Similar to Desempleo Regional - Eurostat

Anna Ludwinek, the hidden potential of Europe’s economically inactive
Anna Ludwinek, the hidden potential of Europe’s economically inactiveAnna Ludwinek, the hidden potential of Europe’s economically inactive
Anna Ludwinek, the hidden potential of Europe’s economically inactiveNUI Galway
 
Y4J Global Study
Y4J Global StudyY4J Global Study
Y4J Global StudyJan Šašek
 
OECD Regions and Cities at a Glance 2018 - Overview
OECD Regions and Cities at a Glance 2018 - OverviewOECD Regions and Cities at a Glance 2018 - Overview
OECD Regions and Cities at a Glance 2018 - OverviewOECD CFE
 
Youth4Job Case Study
Youth4Job Case StudyYouth4Job Case Study
Youth4Job Case StudyJan Šašek
 
Nikos Papadakis - Labour Market and MicroCredentials
Nikos Papadakis - Labour Market and MicroCredentialsNikos Papadakis - Labour Market and MicroCredentials
Nikos Papadakis - Labour Market and MicroCredentialsEADTU
 
Background Analysis of The Romanian social and economic situation
Background Analysis of The Romanian social and economic situationBackground Analysis of The Romanian social and economic situation
Background Analysis of The Romanian social and economic situationStichting Hulp Oost-Europa
 
Eurostat 2q 2013
Eurostat 2q 2013Eurostat 2q 2013
Eurostat 2q 2013idealistait
 
Youth Entrepreneurship Policy Brief
Youth Entrepreneurship Policy Brief Youth Entrepreneurship Policy Brief
Youth Entrepreneurship Policy Brief Dr Lendy Spires
 
UNDP-RBEC-RHDR-Report English copy
UNDP-RBEC-RHDR-Report English copyUNDP-RBEC-RHDR-Report English copy
UNDP-RBEC-RHDR-Report English copyJoanna Brooks
 
Michaela Saisana - Evidence informed policy making - 26 June 2017
Michaela Saisana - Evidence informed policy making - 26 June 2017Michaela Saisana - Evidence informed policy making - 26 June 2017
Michaela Saisana - Evidence informed policy making - 26 June 2017OECD Governance
 
Promoting a stronger and more inclusive economy OECD Economic Survey Hungary ...
Promoting a stronger and more inclusive economy OECD Economic Survey Hungary ...Promoting a stronger and more inclusive economy OECD Economic Survey Hungary ...
Promoting a stronger and more inclusive economy OECD Economic Survey Hungary ...OECD, Economics Department
 
The tax-to-GDP ratio in 2015 in Eu
The tax-to-GDP ratio in 2015 in EuThe tax-to-GDP ratio in 2015 in Eu
The tax-to-GDP ratio in 2015 in EuGiuseppe Fumagalli
 
Así está the economy april 2016 Circulo de Empresarios
Así está the economy april 2016 Circulo de EmpresariosAsí está the economy april 2016 Circulo de Empresarios
Así está the economy april 2016 Circulo de EmpresariosCírculo de Empresarios
 
Salarios mínimos nacionales en la ue 2017
Salarios mínimos nacionales en la ue 2017Salarios mínimos nacionales en la ue 2017
Salarios mínimos nacionales en la ue 2017angel ayach massa
 
2016 EU Regional Social Progress Index
2016 EU Regional Social Progress Index2016 EU Regional Social Progress Index
2016 EU Regional Social Progress Indexsocprog
 
Ageing and productivity growth in OECD regions - Federica Daniele, Taku Honid...
Ageing and productivity growth in OECD regions - Federica Daniele, Taku Honid...Ageing and productivity growth in OECD regions - Federica Daniele, Taku Honid...
Ageing and productivity growth in OECD regions - Federica Daniele, Taku Honid...OECD CFE
 
Comparative analysis of the socioeconomic and demographic change in Europe: i...
Comparative analysis of the socioeconomic and demographic change in Europe: i...Comparative analysis of the socioeconomic and demographic change in Europe: i...
Comparative analysis of the socioeconomic and demographic change in Europe: i...ifoasapereutile
 
2013-->2040 a PATH to PEACE
2013-->2040 a PATH to PEACE2013-->2040 a PATH to PEACE
2013-->2040 a PATH to PEACEGiuseppe KUSZLI
 

Similar to Desempleo Regional - Eurostat (20)

Anna Ludwinek, the hidden potential of Europe’s economically inactive
Anna Ludwinek, the hidden potential of Europe’s economically inactiveAnna Ludwinek, the hidden potential of Europe’s economically inactive
Anna Ludwinek, the hidden potential of Europe’s economically inactive
 
Y4J Global Study
Y4J Global StudyY4J Global Study
Y4J Global Study
 
OECD Regions and Cities at a Glance 2018 - Overview
OECD Regions and Cities at a Glance 2018 - OverviewOECD Regions and Cities at a Glance 2018 - Overview
OECD Regions and Cities at a Glance 2018 - Overview
 
Youth4Job Case Study
Youth4Job Case StudyYouth4Job Case Study
Youth4Job Case Study
 
Nikos Papadakis - Labour Market and MicroCredentials
Nikos Papadakis - Labour Market and MicroCredentialsNikos Papadakis - Labour Market and MicroCredentials
Nikos Papadakis - Labour Market and MicroCredentials
 
Background Analysis of The Romanian social and economic situation
Background Analysis of The Romanian social and economic situationBackground Analysis of The Romanian social and economic situation
Background Analysis of The Romanian social and economic situation
 
Eurostat 2q 2013
Eurostat 2q 2013Eurostat 2q 2013
Eurostat 2q 2013
 
Youth Entrepreneurship Policy Brief
Youth Entrepreneurship Policy Brief Youth Entrepreneurship Policy Brief
Youth Entrepreneurship Policy Brief
 
UNDP-RBEC-RHDR-Report English copy
UNDP-RBEC-RHDR-Report English copyUNDP-RBEC-RHDR-Report English copy
UNDP-RBEC-RHDR-Report English copy
 
Michaela Saisana - Evidence informed policy making - 26 June 2017
Michaela Saisana - Evidence informed policy making - 26 June 2017Michaela Saisana - Evidence informed policy making - 26 June 2017
Michaela Saisana - Evidence informed policy making - 26 June 2017
 
Promoting a stronger and more inclusive economy OECD Economic Survey Hungary ...
Promoting a stronger and more inclusive economy OECD Economic Survey Hungary ...Promoting a stronger and more inclusive economy OECD Economic Survey Hungary ...
Promoting a stronger and more inclusive economy OECD Economic Survey Hungary ...
 
The tax-to-GDP ratio in 2015 in Eu
The tax-to-GDP ratio in 2015 in EuThe tax-to-GDP ratio in 2015 in Eu
The tax-to-GDP ratio in 2015 in Eu
 
Así está the economy april 2016 Circulo de Empresarios
Así está the economy april 2016 Circulo de EmpresariosAsí está the economy april 2016 Circulo de Empresarios
Así está the economy april 2016 Circulo de Empresarios
 
Salarios mínimos nacionales en la ue 2017
Salarios mínimos nacionales en la ue 2017Salarios mínimos nacionales en la ue 2017
Salarios mínimos nacionales en la ue 2017
 
Asimporel
AsimporelAsimporel
Asimporel
 
Asimporel
AsimporelAsimporel
Asimporel
 
2016 EU Regional Social Progress Index
2016 EU Regional Social Progress Index2016 EU Regional Social Progress Index
2016 EU Regional Social Progress Index
 
Ageing and productivity growth in OECD regions - Federica Daniele, Taku Honid...
Ageing and productivity growth in OECD regions - Federica Daniele, Taku Honid...Ageing and productivity growth in OECD regions - Federica Daniele, Taku Honid...
Ageing and productivity growth in OECD regions - Federica Daniele, Taku Honid...
 
Comparative analysis of the socioeconomic and demographic change in Europe: i...
Comparative analysis of the socioeconomic and demographic change in Europe: i...Comparative analysis of the socioeconomic and demographic change in Europe: i...
Comparative analysis of the socioeconomic and demographic change in Europe: i...
 
2013-->2040 a PATH to PEACE
2013-->2040 a PATH to PEACE2013-->2040 a PATH to PEACE
2013-->2040 a PATH to PEACE
 

Recently uploaded

CARE OF CHILD IN INCUBATOR..........pptx
CARE OF CHILD IN INCUBATOR..........pptxCARE OF CHILD IN INCUBATOR..........pptx
CARE OF CHILD IN INCUBATOR..........pptxGaneshChakor2
 
JAPAN: ORGANISATION OF PMDA, PHARMACEUTICAL LAWS & REGULATIONS, TYPES OF REGI...
JAPAN: ORGANISATION OF PMDA, PHARMACEUTICAL LAWS & REGULATIONS, TYPES OF REGI...JAPAN: ORGANISATION OF PMDA, PHARMACEUTICAL LAWS & REGULATIONS, TYPES OF REGI...
JAPAN: ORGANISATION OF PMDA, PHARMACEUTICAL LAWS & REGULATIONS, TYPES OF REGI...anjaliyadav012327
 
Separation of Lanthanides/ Lanthanides and Actinides
Separation of Lanthanides/ Lanthanides and ActinidesSeparation of Lanthanides/ Lanthanides and Actinides
Separation of Lanthanides/ Lanthanides and ActinidesFatimaKhan178732
 
Organic Name Reactions for the students and aspirants of Chemistry12th.pptx
Organic Name Reactions  for the students and aspirants of Chemistry12th.pptxOrganic Name Reactions  for the students and aspirants of Chemistry12th.pptx
Organic Name Reactions for the students and aspirants of Chemistry12th.pptxVS Mahajan Coaching Centre
 
Grant Readiness 101 TechSoup and Remy Consulting
Grant Readiness 101 TechSoup and Remy ConsultingGrant Readiness 101 TechSoup and Remy Consulting
Grant Readiness 101 TechSoup and Remy ConsultingTechSoup
 
Beyond the EU: DORA and NIS 2 Directive's Global Impact
Beyond the EU: DORA and NIS 2 Directive's Global ImpactBeyond the EU: DORA and NIS 2 Directive's Global Impact
Beyond the EU: DORA and NIS 2 Directive's Global ImpactPECB
 
microwave assisted reaction. General introduction
microwave assisted reaction. General introductionmicrowave assisted reaction. General introduction
microwave assisted reaction. General introductionMaksud Ahmed
 
Measures of Central Tendency: Mean, Median and Mode
Measures of Central Tendency: Mean, Median and ModeMeasures of Central Tendency: Mean, Median and Mode
Measures of Central Tendency: Mean, Median and ModeThiyagu K
 
Advanced Views - Calendar View in Odoo 17
Advanced Views - Calendar View in Odoo 17Advanced Views - Calendar View in Odoo 17
Advanced Views - Calendar View in Odoo 17Celine George
 
Student login on Anyboli platform.helpin
Student login on Anyboli platform.helpinStudent login on Anyboli platform.helpin
Student login on Anyboli platform.helpinRaunakKeshri1
 
BASLIQ CURRENT LOOKBOOK LOOKBOOK(1) (1).pdf
BASLIQ CURRENT LOOKBOOK  LOOKBOOK(1) (1).pdfBASLIQ CURRENT LOOKBOOK  LOOKBOOK(1) (1).pdf
BASLIQ CURRENT LOOKBOOK LOOKBOOK(1) (1).pdfSoniaTolstoy
 
Russian Call Girls in Andheri Airport Mumbai WhatsApp 9167673311 💞 Full Nigh...
Russian Call Girls in Andheri Airport Mumbai WhatsApp  9167673311 💞 Full Nigh...Russian Call Girls in Andheri Airport Mumbai WhatsApp  9167673311 💞 Full Nigh...
Russian Call Girls in Andheri Airport Mumbai WhatsApp 9167673311 💞 Full Nigh...Pooja Nehwal
 
mini mental status format.docx
mini    mental       status     format.docxmini    mental       status     format.docx
mini mental status format.docxPoojaSen20
 
Disha NEET Physics Guide for classes 11 and 12.pdf
Disha NEET Physics Guide for classes 11 and 12.pdfDisha NEET Physics Guide for classes 11 and 12.pdf
Disha NEET Physics Guide for classes 11 and 12.pdfchloefrazer622
 
Z Score,T Score, Percential Rank and Box Plot Graph
Z Score,T Score, Percential Rank and Box Plot GraphZ Score,T Score, Percential Rank and Box Plot Graph
Z Score,T Score, Percential Rank and Box Plot GraphThiyagu K
 
APM Welcome, APM North West Network Conference, Synergies Across Sectors
APM Welcome, APM North West Network Conference, Synergies Across SectorsAPM Welcome, APM North West Network Conference, Synergies Across Sectors
APM Welcome, APM North West Network Conference, Synergies Across SectorsAssociation for Project Management
 
Arihant handbook biology for class 11 .pdf
Arihant handbook biology for class 11 .pdfArihant handbook biology for class 11 .pdf
Arihant handbook biology for class 11 .pdfchloefrazer622
 

Recently uploaded (20)

INDIA QUIZ 2024 RLAC DELHI UNIVERSITY.pptx
INDIA QUIZ 2024 RLAC DELHI UNIVERSITY.pptxINDIA QUIZ 2024 RLAC DELHI UNIVERSITY.pptx
INDIA QUIZ 2024 RLAC DELHI UNIVERSITY.pptx
 
CARE OF CHILD IN INCUBATOR..........pptx
CARE OF CHILD IN INCUBATOR..........pptxCARE OF CHILD IN INCUBATOR..........pptx
CARE OF CHILD IN INCUBATOR..........pptx
 
JAPAN: ORGANISATION OF PMDA, PHARMACEUTICAL LAWS & REGULATIONS, TYPES OF REGI...
JAPAN: ORGANISATION OF PMDA, PHARMACEUTICAL LAWS & REGULATIONS, TYPES OF REGI...JAPAN: ORGANISATION OF PMDA, PHARMACEUTICAL LAWS & REGULATIONS, TYPES OF REGI...
JAPAN: ORGANISATION OF PMDA, PHARMACEUTICAL LAWS & REGULATIONS, TYPES OF REGI...
 
Separation of Lanthanides/ Lanthanides and Actinides
Separation of Lanthanides/ Lanthanides and ActinidesSeparation of Lanthanides/ Lanthanides and Actinides
Separation of Lanthanides/ Lanthanides and Actinides
 
Organic Name Reactions for the students and aspirants of Chemistry12th.pptx
Organic Name Reactions  for the students and aspirants of Chemistry12th.pptxOrganic Name Reactions  for the students and aspirants of Chemistry12th.pptx
Organic Name Reactions for the students and aspirants of Chemistry12th.pptx
 
Grant Readiness 101 TechSoup and Remy Consulting
Grant Readiness 101 TechSoup and Remy ConsultingGrant Readiness 101 TechSoup and Remy Consulting
Grant Readiness 101 TechSoup and Remy Consulting
 
Beyond the EU: DORA and NIS 2 Directive's Global Impact
Beyond the EU: DORA and NIS 2 Directive's Global ImpactBeyond the EU: DORA and NIS 2 Directive's Global Impact
Beyond the EU: DORA and NIS 2 Directive's Global Impact
 
microwave assisted reaction. General introduction
microwave assisted reaction. General introductionmicrowave assisted reaction. General introduction
microwave assisted reaction. General introduction
 
Measures of Central Tendency: Mean, Median and Mode
Measures of Central Tendency: Mean, Median and ModeMeasures of Central Tendency: Mean, Median and Mode
Measures of Central Tendency: Mean, Median and Mode
 
Advanced Views - Calendar View in Odoo 17
Advanced Views - Calendar View in Odoo 17Advanced Views - Calendar View in Odoo 17
Advanced Views - Calendar View in Odoo 17
 
Student login on Anyboli platform.helpin
Student login on Anyboli platform.helpinStudent login on Anyboli platform.helpin
Student login on Anyboli platform.helpin
 
BASLIQ CURRENT LOOKBOOK LOOKBOOK(1) (1).pdf
BASLIQ CURRENT LOOKBOOK  LOOKBOOK(1) (1).pdfBASLIQ CURRENT LOOKBOOK  LOOKBOOK(1) (1).pdf
BASLIQ CURRENT LOOKBOOK LOOKBOOK(1) (1).pdf
 
Russian Call Girls in Andheri Airport Mumbai WhatsApp 9167673311 💞 Full Nigh...
Russian Call Girls in Andheri Airport Mumbai WhatsApp  9167673311 💞 Full Nigh...Russian Call Girls in Andheri Airport Mumbai WhatsApp  9167673311 💞 Full Nigh...
Russian Call Girls in Andheri Airport Mumbai WhatsApp 9167673311 💞 Full Nigh...
 
mini mental status format.docx
mini    mental       status     format.docxmini    mental       status     format.docx
mini mental status format.docx
 
Código Creativo y Arte de Software | Unidad 1
Código Creativo y Arte de Software | Unidad 1Código Creativo y Arte de Software | Unidad 1
Código Creativo y Arte de Software | Unidad 1
 
Disha NEET Physics Guide for classes 11 and 12.pdf
Disha NEET Physics Guide for classes 11 and 12.pdfDisha NEET Physics Guide for classes 11 and 12.pdf
Disha NEET Physics Guide for classes 11 and 12.pdf
 
Z Score,T Score, Percential Rank and Box Plot Graph
Z Score,T Score, Percential Rank and Box Plot GraphZ Score,T Score, Percential Rank and Box Plot Graph
Z Score,T Score, Percential Rank and Box Plot Graph
 
APM Welcome, APM North West Network Conference, Synergies Across Sectors
APM Welcome, APM North West Network Conference, Synergies Across SectorsAPM Welcome, APM North West Network Conference, Synergies Across Sectors
APM Welcome, APM North West Network Conference, Synergies Across Sectors
 
Mattingly "AI & Prompt Design: The Basics of Prompt Design"
Mattingly "AI & Prompt Design: The Basics of Prompt Design"Mattingly "AI & Prompt Design: The Basics of Prompt Design"
Mattingly "AI & Prompt Design: The Basics of Prompt Design"
 
Arihant handbook biology for class 11 .pdf
Arihant handbook biology for class 11 .pdfArihant handbook biology for class 11 .pdf
Arihant handbook biology for class 11 .pdf
 

Desempleo Regional - Eurostat

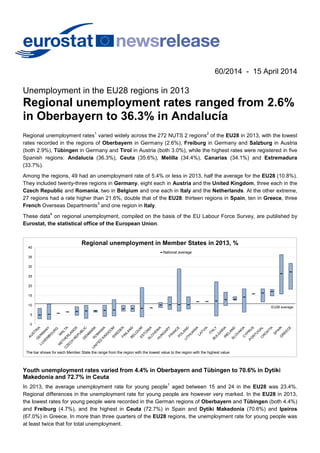
  • 1. 60/2014 - 15 April 2014 Unemployment in the EU28 regions in 2013 Regional unemployment rates ranged from 2.6% in Oberbayern to 36.3% in Andalucía Regional unemployment rates 1 varied widely across the 272 NUTS 2 regions 2 of the EU28 in 2013, with the lowest rates recorded in the regions of Oberbayern in Germany (2.6%), Freiburg in Germany and Salzburg in Austria (both 2.9%), Tübingen in Germany and Tirol in Austria (both 3.0%), while the highest rates were registered in five Spanish regions: Andalucía (36.3%), Ceuta (35.6%), Melilla (34.4%), Canarias (34.1%) and Extremadura (33.7%). Among the regions, 49 had an unemployment rate of 5.4% or less in 2013, half the average for the EU28 (10.8%). They included twenty-three regions in Germany, eight each in Austria and the United Kingdom, three each in the Czech Republic and Romania, two in Belgium and one each in Italy and the Netherlands. At the other extreme, 27 regions had a rate higher than 21.6%, double that of the EU28: thirteen regions in Spain, ten in Greece, three French Overseas Departments 3 and one region in Italy. These data 4 on regional unemployment, compiled on the basis of the EU Labour Force Survey, are published by Eurostat, the statistical office of the European Union. 0 5 10 15 20 25 30 35 40 Regional unemployment in Member States in 2013, % National average The bar shows for each Member State the range from the region with the lowest value to the region with the highest value EU28 average Youth unemployment rates varied from 4.4% in Oberbayern and Tübingen to 70.6% in Dytiki Makedonia and 72.7% in Ceuta In 2013, the average unemployment rate for young people 1 aged between 15 and 24 in the EU28 was 23.4%. Regional differences in the unemployment rate for young people are however very marked. In the EU28 in 2013, the lowest rates for young people were recorded in the German regions of Oberbayern and Tübingen (both 4.4%) and Freiburg (4.7%), and the highest in Ceuta (72.7%) in Spain and Dytiki Makedonia (70.6%) and Ipeiros (67.0%) in Greece. In more than three quarters of the EU28 regions, the unemployment rate for young people was at least twice that for total unemployment.
  • 2. Regions with highest and lowest unemployment rates in 2013, % Total Lowest Highest 1 Oberbayern (DE) 2.6 1 Andalucía (ES) 36.3 2= Freiburg (DE) 2.9 2 Ciudad Autónoma de Ceuta (ES) 35.6 Salzburg (AT) 2.9 3 Ciudad Autónoma de Melilla (ES) 34.4 4= Tübingen (DE) 3.0 4 Canarias (ES) 34.1 Tirol (AT) 3.0 5 Extremadura (ES) 33.7 6= Praha (CZ) 3.1 6 Dytiki Makedonia (EL) 31.8 Mittelfranken (DE) 3.1 7 Castilla-la Mancha (ES) 30.1 Trier (DE) 3.1 8 Kentriki Makedonia (EL) 30.0 9 Vorarlberg (AT) 3.2 9 Región de Murcia (ES) 29.4 10= Niederbayern (DE) 3.3 10 Réunion (FR) 28.9 Unterfranken (DE) 3.3 Schwaben (DE) 3.3 Young people (aged 15-24) Lowest Highest 1= Tübingen (DE) 4.4 1 Ciudad Autónoma de Ceuta (ES) (72.7) Oberbayern (DE) 4.4 2 Dytiki Makedonia (EL) 70.6 3 Freiburg (DE) 4.7 3 Ipeiros (EL) 67.0 4 Schwaben (DE) 4.8 4 Andalucía (ES) 66.1 5 Mittelfranken (DE) 5.0 5 Canarias (ES) 65.3 6 Karlsruhe (DE) 5.8 6 Martinique (FR) 63.9 7= Stuttgart (DE) 6.1 7 Kentriki Makedonia (EL) 61.8 Tirol (AT) (6.1) 8 Extremadura (ES) 61.7 9 Weser-Ems (DE) 6.7 9 Castilla-la Mancha (ES) 61.6 10= Zeeland (NL) (7.0) 10 Attiki (EL) 60.6 Oberösterreich (AT) 7.0 In more than a quarter of the regions, the majority of the unemployed had been out of work for at least a year The long-term unemployment share, which is defined as the percentage of unemployed persons who have been unemployed for 12 months or more, stood at 47.5% on average in the EU28 in 2013, and varied significantly across the regions. In the EU28 in 2013, the lowest shares of long-term unemployed were recorded in six Swedish regions: Övre Norrland (12.4%), Mellersta Norrland (13.1%), Norra Mellansverige (16.3%), Västsverige (17.2%), Småland med öarna (17.3%) and Stockholm (17.5%), and the highest in the French Overseas Departments of Guadeloupe (79.5%) and Guyane (77.6%) and Východné Slovensko (74.9%) in Slovakia. Regions with highest and lowest long-term unemployment shares in 2013, % Lowest Highest 1 Övre Norrland (SE) 12.4 1 Guadeloupe (FR) 79.5 2 Mellersta Norrland (SE) (13.1) 2 Guyane (FR) 77.6 3 Norra Mellansverige (SE) 16.3 3 Východné Slovensko (SK) 74.9 4 Västsverige (SE) 17.2 4 Dytiki Ellada (EL) 72.9 5 Småland med öarna (SE) 17.3 5 Stredné Slovensko (SK) 72.7 6 Stockholm (SE) 17.5 6= Sterea Ellada (EL) 71.0 7 Nordjylland (DK) (18.3) Martinique (FR) 71.0 8 Östra Mellansverige (SE) 18.7 8 Peloponnisos (EL) 70.8 9 Oberösterreich (AT) (18.8) 9 Attiki (EL) 69.3 10= Helsinki-Uusimaa (FI) 19.0 10 Kentriki Makedonia (EL) 69.0 Pohjois- ja Itä-Suomi (FI) 19.0 ( ) Data with reduced reliability due to sample size.
  • 3. 1. The unemployment rate is defined as the percentage of unemployed persons aged 15-74 in the economically active population. According to the recommendations of the International Labour Organisation, a person is deemed to be unemployed if all three of the following conditions are met:  he or she is without work during the survey reference week;  he or she is available for work, being able to take up employment within two weeks;  he or she has actively sought work over the past four weeks. In particular, it should be noted that the youth unemployment rate does not reflect the proportion of all young people who are unemployed, as not every young person participates in the labour market. Labour market participation of young persons varies by country and region in the EU28, which influences the proportion of unemployed people in the total youth population. For further details please refer to the Youth unemployment article in Statistics Explained: http://epp.eurostat.ec.europa.eu/statistics_explained/index.php/Youth_unemployment The EU28 average is calculated as the average of the regional values. The figures may slightly differ from the EU unemployment rate published in the Eurostat database, for which methodological breaks (see footnotes 5 and 6) have been corrected. 2. These data are based on the Nomenclature of Territorial Units for Statistics (NUTS) as modified in January 2011. NUTS 2010 provides a uniform, consistent breakdown of territorial units for the production of regional statistics for the EU. Level 2 of the nomenclature has 272 regions: Belgium (11), Bulgaria (6), the Czech Republic (8), Denmark (5), Germany (38), Ireland (2), Greece (13), Spain (19), France (26), Croatia (2), Italy (21), Hungary (7), the Netherlands (12), Austria (9), Poland (16), Portugal (7), Romania (8), Slovenia (2), Slovakia (4), Finland (5), Sweden (8) and the United Kingdom (37). Estonia, Cyprus, Latvia, Lithuania, Luxembourg and Malta are all considered as single regions at NUTS 2 level. For a list of the European statistical regions see: http://epp.eurostat.ec.europa.eu/portal/page/portal/nuts_nomenclature/introduction. The statistical regions in the candidate and EFTA countries follow the principles of the NUTS classification; however there is no legal base. There are 44 regions in these countries at Level 2: Norway (7), Switzerland (7), and Turkey (26). Iceland, Liechtenstein, Montenegro and the former Yugoslav Republic of Macedonia are all considered as single regions at Level 2. 3. Data for French Overseas Departments (Guadelope, Martinique, Guyane and Réunion) refer to the second quarter of 2013. 4. For further regional data, please see the Eurostat web site: http://epp.eurostat.ec.europa.eu/portal/page/portal/region_cities/regional_statistics/data/database 5. For Estonia and Austria there is a break in the series between 2012 and 2013 due to census revisions. 6. INSEE, the French Statistical Office, has carried out an extensive revision of the Labour Force Survey questionnaire. The new questionnaire was used from 1 January 2013 onwards. It impacts significantly the level of the French indicators mentioned in this release. Detailed information on these methodological changes and their impact is available in INSEE's website http://www.insee.fr/fr/themes/info-rapide.asp?id=14 Box "Pour en savoir plus". Due to this revision, comparisons with the past should be avoided. Issued by: Eurostat Press Office Tim ALLEN Tel: +352-4301-33 444 eurostat-pressoffice@ec.europa.eu Eurostat news releases on the internet: http://ec.europa.eu/eurostat For further information on data: Gorja BARTSCH Tel: +352-4301-34 566 gorja.bartsch@ec.europa.eu Daniela SCIRANKOVÁ Tel: +352-4301-37 326 daniela.scirankova@ec.europa.eu Follow Eurostat on Twitter: http://twitter.com/EU_Eurostat For interactive maps on regional unemployment, visit Regional Statistics Illustrated: http://epp.eurostat.ec.europa.eu/cache/RSI
  • 4. Unemployment in the regions of the European Union Unemployment rates, % Long-term unemployment share,% Total Males Females 15-24 years old 2012 2013 2013 2013 2013 2013 EU281 10.5 10.8 10.8 10.9 23.4 47.5 BELGIUM 7.5 8.4 8.6 8.2 23.7 46.0 Bruxelles-Capitale/Brussels Hoofdstedelijk 17.4 19.2 21.0 17.0 39.9 56.6 Vlaams Gewest 4.5 5.0 5.1 5.0 16.6 32.5 Prov. Antwerpen 5.3 6.2 6.2 6.2 19.1 35.9 Prov. Limburg (BE) 4.7 5.5 5.6 5.3 19.8 28.9 Prov. Oost-Vlaanderen 4.1 4.0 4.0 4.0 14.4 26.5 Prov. Vlaams Brabant 4.4 5.5 5.1 5.9 16.1 37.2 Prov. West-Vlaanderen 3.9 3.9 4.1 3.6 13.7 29.2 Région Wallonne 10.0 11.3 11.3 11.4 32.8 51.5 Prov. Brabant Wallon 7.0 8.2 8.6 7.8 (29.3) 50.3 Prov. Hainaut 12.1 13.2 13.5 12.9 40.5 53.5 Prov. Liège 10.7 11.7 11.3 12.1 26.9 53.6 Prov. Luxembourg (BE) 7.6 7.9 7.5 (8.3) (25.9) (36.9) Prov. Namur 7.3 10.4 10.1 10.8 32.4 47.3 BULGARIA 12.3 12.9 13.9 11.8 28.4 57.3 Severna i Yugoiztochna Bulgaria 14.3 14.8 15.5 13.9 31.4 58.0 Severozapaden 12.3 14.0 16.0 11.6 (32.0) 63.7 Severen tsentralen 14.3 15.3 16.5 13.9 (29.3) 66.0 Severoiztochen 18.2 16.8 17.1 16.5 33.0 58.0 Yugoiztochen 11.9 13.0 13.0 13.1 30.7 46.5 Yugozapadna i Yuzhna tsentralna Bulgaria 10.4 11.2 12.3 10.0 25.6 56.4 Yugozapaden 8.2 9.8 10.9 8.6 20.6 53.9 Yuzhen tsentralen 13.8 13.5 14.6 12.2 34.1 59.3 CZECH REPUBLIC 7.0 7.0 5.9 8.3 19.0 43.4 Praha 3.1 3.1 3.2 3.1 9.7 34.8 Střední Čechy 4.6 5.2 4.6 6.0 14.7 34.4 Jihozápad 5.3 5.2 3.9 6.8 16.6 43.7 Severozápad 10.7 9.6 8.1 11.6 24.8 49.8 Severovýchod 8.0 8.3 6.7 10.2 19.7 39.4 Jihovýchod 7.6 6.8 5.7 8.2 19.4 42.0 Střední Morava 7.5 8.0 7.4 8.8 21.6 46.1 Moravskoslezsko 9.5 9.9 8.0 12.1 22.4 49.1 DENMARK 7.5 7.0 6.7 7.3 13.1 25.5 Hovedstaden 8.2 7.4 7.0 7.9 12.7 26.8 Sjælland 6.4 6.8 6.8 6.8 13.9 29.0 Syddanmark 7.9 7.2 6.8 7.7 12.8 28.5 Midtjylland 6.8 6.5 6.5 6.6 12.7 21.1 Nordjylland 7.9 6.4 6.3 6.6 14.4 (18.3) ( ) Data with reduced reliability due to sample size.
  • 5. Unemployment in the regions of the European Union Unemployment rates, % Long-term unemployment share,% Total Males Females 15-24 years old 2012 2013 2013 2013 2013 2013 EU281 10.5 10.8 10.8 10.9 23.4 47.5 GERMANY 5.5 5.3 5.6 5.0 7.9 44.4 Baden-Württemberg 3.4 3.4 3.4 3.4 5.4 33.6 Stuttgart 3.5 3.7 3.6 3.7 6.1 34.4 Karlsruhe 4.1 3.6 3.8 3.4 5.8 37.4 Freiburg 2.9 2.9 3.0 2.9 4.7 30.1 Tübingen 2.7 3.0 2.8 3.2 4.4 29.0 Bayern 3.2 3.1 3.0 3.2 4.9 34.6 Oberbayern 2.7 2.6 2.6 2.6 4.4 33.8 Niederbayern 3.4 3.3 3.1 3.6 u 39.1 Oberpfalz 3.2 3.4 3.1 3.8 u 39.2 Oberfranken 3.3 4.0 4.3 3.7 8.0 35.9 Mittelfranken 3.7 3.1 3.1 3.2 5.0 33.6 Unterfranken 3.5 3.3 3.1 3.6 u 31.6 Schwaben 3.2 3.3 3.0 3.6 4.8 32.6 Berlin 10.6 10.6 11.7 9.2 14.3 48.5 Brandenburg 8.3 7.4 8.1 6.5 11.2 53.3 Bremen 6.7 7.2 7.2 7.0 u 36.0 Hamburg 5.4 4.8 5.5 4.0 7.5 48.5 Hessen 4.7 4.4 4.7 3.9 8.2 36.6 Darmstadt 4.7 4.3 4.8 3.7 8.1 35.2 Gießen 5.1 4.6 4.5 4.6 u 42.0 Kassel 4.5 4.3 4.4 4.2 9.0 36.3 Mecklenburg-Vorpommern 10.8 10.1 11.1 8.9 10.8 53.4 Niedersachsen 5.0 5.0 5.4 4.5 8.0 42.9 Braunschweig 5.7 6.4 7.3 5.2 9.6 44.5 Hannover 5.5 5.5 5.6 5.3 8.6 44.3 Lüneburg 4.5 4.4 4.8 3.9 7.8 45.2 Weser-Ems 4.4 4.0 4.3 3.8 6.7 38.0 Nordrhein-Westfalen 5.9 6.0 6.7 5.3 9.4 45.1 Düsseldorf 6.6 6.4 7.3 5.4 10.1 48.6 Köln 5.4 5.9 6.5 5.2 8.7 44.0 Münster 5.0 5.1 5.5 4.7 8.5 44.1 Detmold 4.8 5.1 5.3 4.8 8.8 40.2 Arnsberg 6.9 6.8 7.6 5.8 10.2 44.3 Rheinland-Pfalz 4.0 4.1 4.2 4.0 8.0 35.9 Koblenz 4.0 3.8 3.8 3.9 7.3 36.1 Trier 2.7 3.1 3.4 u u u Rheinhessen-Pfalz 4.4 4.5 4.6 4.4 9.7 35.5 Saarland 6.4 6.2 6.6 5.7 12.4 42.6 Sachsen 8.2 7.9 7.9 7.8 10.3 54.2 Dresden 7.6 7.3 7.6 6.9 9.8 51.2 Chemnitz 8.0 7.4 6.8 8.2 9.0 55.0 Leipzig 9.5 9.3 9.9 8.6 12.5 57.0 Sachsen-Anhalt 9.5 9.0 8.9 9.2 11.3 58.1 Schleswig-Holstein 5.1 5.0 5.5 4.4 7.3 45.2 Thüringen 7.2 6.0 5.8 6.3 8.8 51.4 ESTONIA5 : 8.6 9.1 8.2 18.7 44.5 IRELAND 14.7 13.0 15.0 10.7 26.8 59.9 Border, Midland and Western 16.5 14.2 15.8 12.1 30.3 61.9 Southern and Eastern 14.1 12.6 14.6 10.2 25.6 59.1 GREECE 24.2 27.3 24.3 31.3 58.3 67.5 Voreia Ellada 25.0 28.6 24.9 33.5 60.9 68.2 Anatoliki Makedonia, Thraki 22.5 26.4 25.0 28.5 59.8 68.9 Kentriki Makedonia 26.0 30.0 26.2 34.9 61.8 69.0 Dytiki Makedonia 29.9 31.8 27.3 38.2 70.6 65.2 Thessalia 22.6 25.4 20.6 31.8 57.4 66.5 Kentriki Ellada 23.2 25.8 22.0 31.2 58.9 68.7 Ipeiros 22.9 27.8 24.6 31.7 67.0 62.9 Ionia Nisia 14.7 18.3 13.7 24.8 49.8 46.7 Dytiki Ellada 25.5 28.3 24.0 34.7 58.8 72.9 Sterea Ellada 27.8 27.9 24.8 32.9 59.8 71.0 Peloponnisos 19.9 22.5 19.0 27.5 58.7 70.8 Attiki 25.3 28.2 26.5 30.3 60.6 69.3 Nisia Aigaiou, Kriti 19.8 22.9 19.3 28.1 43.0 53.6 Voreio Aigaio 21.2 21.3 18.0 27.2 (47.0) 68.2 Notio Aigaio 15.1 20.7 17.3 26.1 37.0 37.5 Kriti 21.7 24.4 20.7 29.3 45.3 56.5 : Data not shown due to break in series ( ) Data with reduced reliability due to sample size. u Data not published due to small sample size.
  • 6. Unemployment in the regions of the European Union Unemployment rates, % Long-term unemployment share,% Total Males Females 15-24 years old 2012 2013 2013 2013 2013 2013 EU281 10.5 10.8 10.8 10.9 23.4 47.5 SPAIN 25.0 26.4 25.8 27.0 55.7 49.8 Noroeste 20.5 22.3 22.3 22.4 51.4 51.2 Galicia 20.7 22.1 22.2 21.9 50.2 50.3 Principado de Asturias 21.8 24.1 23.8 24.4 54.7 53.9 Cantabria 17.7 20.6 20.1 21.2 52.2 49.6 Noreste 16.6 18.1 17.5 18.8 48.5 45.9 País Vasco 14.9 15.8 15.7 16.0 46.3 48.8 Comunidad Foral de Navarra 16.2 18.1 17.3 19.1 48.1 39.4 La Rioja 20.5 19.9 18.9 21.1 (47.9) 42.6 Aragón 18.6 21.3 20.1 22.9 51.1 45.8 Comunidad de Madrid 19.0 20.2 19.7 20.8 48.9 50.4 Centro (ES) 25.5 27.2 25.1 29.8 57.4 50.2 Castilla y León 19.7 21.7 20.0 23.8 49.6 48.3 Castilla-La Mancha 28.5 30.1 27.4 33.7 61.6 54.7 Extremadura 33.0 33.7 31.8 36.1 61.7 45.2 Este 24.5 25.2 25.2 25.3 52.3 50.4 Cataluña 22.6 23.4 23.9 22.8 50.7 52.8 Comunidad Valenciana 27.7 28.6 27.6 29.8 56.7 49.3 Illes Balears 23.2 22.3 22.4 22.1 45.3 41.3 Sur 33.5 35.3 33.9 36.9 64.2 47.9 Andalucía 34.6 36.3 34.9 38.1 66.1 48.1 Región de Murcia 27.9 29.4 28.8 30.1 53.8 45.2 Ciudad Autónoma de Ceuta 38.5 35.6 29.4 44.4 (72.7) 65.2 Ciudad Autónoma de Melilla 28.6 34.4 34.4 (34.4) (56.0) 55.3 Canarias 33.0 34.1 34.6 33.4 65.3 55.0 FRANCE6 : 10.3 10.4 10.3 24.9 42.2 Île de France : 8.9 9.6 8.1 18.4 40.1 Bassin parisien : 10.7 10.7 10.7 27.4 41.8 Champagne-Ardenne : 10.4 10.0 10.8 29.7 37.5 Picardie : 11.4 10.9 12.1 29.3 45.4 Haute-Normandie : 11.6 11.7 11.5 30.8 47.4 Centre : 10.6 11.1 10.1 22.0 40.5 Basse-Normandie : 9.1 9.8 8.5 25.8 36.2 Bourgogne : 10.5 10.1 10.9 30.0 40.3 Nord - Pas-de-Calais : 14.7 15.1 14.2 34.7 48.8 Est : 10.7 10.7 10.7 26.9 41.4 Lorraine : 12.2 12.2 12.1 27.5 41.9 Alsace : 9.7 9.1 10.3 28.2 41.6 Franche-Comté : 9.5 10.3 8.7 (22.5) 39.8 Ouest : 8.7 8.3 9.2 21.5 36.0 Pays de la Loire : 8.8 8.5 9.2 20.7 36.1 Bretagne : 8.0 7.5 8.5 19.2 33.4 Poitou-Charentes : 9.9 9.3 10.5 26.4 39.8 Sud-ouest : 8.6 8.8 8.3 20.6 35.9 Aquitaine : 8.9 9.0 8.8 21.8 33.5 Midi-Pyrénées : 8.6 9.0 8.2 20.5 36.4 Limousin : 6.9 7.1 (6.7) u (47.3) Centre-est : 8.5 8.3 8.6 20.2 34.7 Rhône-Alpes : 8.4 8.4 8.4 19.5 34.0 Auvergne : 8.9 8.1 9.8 23.9 37.6 Méditerranée : 11.5 11.3 11.7 28.5 42.1 Languedoc-Roussillon : 12.9 12.7 13.1 36.4 45.6 Provence-Alpes-Côte d'Azur : 10.8 10.8 10.9 24.6 40.4 Corse : (12.4) u (15.5) u u Départements d'Outre-Mer : 26.2 25.1 27.4 57.0 72.1 Guadeloupe : 26.2 24.0 28.3 58.4 79.5 Martinique : 22.8 22.8 22.8 63.9 71.0 Guyane : 21.3 16.7 26.3 (41.1) 77.6 Réunion : 28.9 28.3 29.7 57.3 68.3 CROATIA 15.8 17.1 17.7 16.5 49.8 63.7 Jadranska Hrvatska 14.8 14.8 15.2 14.4 45.4 58.6 Kontinentalna Hrvatska 16.3 18.2 18.8 17.5 51.4 65.6 : Data not shown due to break in series ( ) Data with reduced reliability due to sample size. u Data not published due to small sample size.
  • 7. Unemployment in the regions of the European Union Unemployment rates, % Long-term unemployment share,% Total Males Females 15-24 years old 2012 2013 2013 2013 2013 2013 EU281 10.5 10.8 10.8 10.9 23.4 47.5 ITALY 10.7 12.2 11.5 13.1 40.0 56.4 Nord Ovest 8.0 8.9 8.4 9.6 34.3 51.8 Piemonte 9.2 10.6 10.2 11.1 40.2 54.3 Valle d’Aosta / Vallée d’Aoste 7.1 8.4 8.5 (8.3) u (34.2) Liguria 8.1 9.9 9.2 10.9 42.1 50.5 Lombardia 7.5 8.1 7.6 8.8 30.8 50.8 Nord Est 6.7 7.7 6.6 9.3 26.9 45.8 Provincia Autonoma di Bolzano/Bozen 4.1 4.4 3.9 5.0 12.2 26.2 Provincia Autonoma di Trento 6.1 6.6 5.4 8.0 23.5 32.9 Veneto 6.6 7.6 6.2 9.5 25.3 49.9 Friuli-Venezia Giulia 6.8 7.7 6.6 9.1 24.2 43.6 Emilia-Romagna 7.1 8.5 7.4 9.7 33.3 44.9 Centro (IT) 9.5 10.9 9.8 12.2 39.8 52.8 Toscana 7.8 8.7 7.6 10.1 33.4 46.4 Umbria 9.8 10.4 9.4 11.7 36.5 47.1 Marche 9.1 11.1 9.8 12.6 36.1 50.9 Lazio 10.8 12.3 11.2 13.7 45.9 57.1 Sud 16.9 19.6 18.4 21.6 50.6 63.3 Abruzzo 10.8 11.4 11.2 11.8 37.7 57.7 Molise 12.0 15.8 15.8 15.8 48.9 60.1 Campania 19.3 21.5 20.1 23.8 51.7 67.2 Puglia 15.7 19.8 17.8 23.3 49.7 57.9 Basilicata 14.5 15.2 15.4 14.8 55.1 64.0 Calabria 19.3 22.2 21.5 23.5 56.1 64.8 Isole 17.7 20.0 19.4 21.2 53.9 62.5 Sicilia 18.6 21.0 19.9 23.0 53.8 64.7 Sardegna 15.5 17.5 17.9 17.0 54.2 55.9 CYPRUS 11.8 15.9 16.5 15.2 38.9 38.3 LATVIA 15.0 11.9 12.6 11.1 23.2 48.4 LITHUANIA 13.4 11.8 13.1 10.5 21.9 42.9 LUXEMBOURG (GRAND-DUCHY) 5.1 5.8 5.4 6.4 15.5 30.4 HUNGARY 10.9 10.2 10.2 10.2 27.2 48.6 Közép Magyarország 9.2 8.7 9.3 8.0 25.9 55.0 Dunántúl 9.6 8.6 8.4 8.8 22.0 43.7 Közép Dunántúl 9.8 8.8 8.4 9.4 23.0 47.3 Nyugat Dunántúl 7.4 7.8 7.4 8.2 21.5 36.8 Dél Dunántúl 12.0 9.1 9.5 8.7 21.3 46.3 Alföld es Észak 13.5 12.9 12.6 13.4 31.9 47.5 Észak Magyaroszág 16.6 12.9 12.8 13.0 30.3 51.8 Észak Alföld 13.9 14.4 13.7 15.3 35.7 43.9 Dél Alföld 10.5 11.3 11.1 11.6 28.5 48.6 MALTA 6.4 6.5 6.5 6.4 13.5 44.5 NETHERLANDS 5.3 6.7 7.1 6.3 11.0 35.4 Noord-Nederland 5.9 7.3 7.8 6.7 11.8 34.5 Groningen 6.2 7.5 8.3 6.5 11.5 34.0 Friesland (NL) 5.7 7.8 8.1 7.3 13.0 33.9 Drenthe 5.7 6.5 6.8 6.2 10.8 36.4 Oost-Nederland 5.1 6.6 7.0 6.1 11.4 35.3 Overijssel 5.1 6.7 7.2 6.1 11.2 35.0 Gelderland 4.8 6.1 6.6 5.4 10.5 35.0 Flevoland 6.6 9.2 8.5 9.9 17.3 36.6 West-Nederland 5.4 6.8 7.1 6.4 10.9 36.8 Utrecht 4.7 5.8 6.3 5.3 9.6 27.8 Noord-Holland 5.0 6.6 7.1 6.1 11.9 34.8 Zuid-Holland 6.3 7.4 7.6 7.2 11.0 40.4 Zeeland 3.1 4.7 5.0 4.3 (7.0) 43.7 Zuid-Nederland 4.8 6.3 6.7 5.9 10.4 32.8 Noord-Brabant 4.7 6.1 6.5 5.8 9.7 32.6 Limburg (NL) 4.9 6.7 7.1 6.2 12.0 33.1 AUSTRIA5 : 4.9 4.9 4.9 9.2 24.3 Ostösterreich : 6.4 6.5 6.2 12.2 27.4 Burgenland (AT) : (4.0) u u u u Niederösterreich : 4.5 4.7 4.4 10.0 23.8 Wien : 8.4 8.6 8.2 14.9 29.5 Südösterreich : 4.4 4.2 4.7 8.8 24.5 Kärnten : 5.3 4.8 5.8 (8.9) (23.6) Steiermark : 4.0 3.9 4.2 8.7 25.0 Westösterreich : 3.5 3.5 3.4 6.4 17.7 Oberösterreich : 4.0 4.2 3.8 7.0 (18.8) Salzburg : 2.9 (3.1) (2.7) u u Tirol : 3.0 (2.7) 3.4 (6.1) u Vorarlberg : 3.2 (3.3) u u u : Data not shown due to break in series ( ) Data with reduced reliability due to sample size. u Data not published due to small sample size.
  • 8. Unemployment in the regions of the European Union Unemployment rates, % Long-term unemployment share,% Total Males Females 15-24 years old 2012 2013 2013 2013 2013 2013 EU281 10.5 10.8 10.8 10.9 23.4 47.5 POLAND 10.1 10.3 9.7 11.1 27.3 42.5 Region Centralny 9.0 9.1 8.8 9.4 21.0 41.6 Łódzkie 11.1 11.1 10.6 11.7 23.8 48.1 Mazowieckie 8.0 8.0 7.8 8.2 19.3 36.7 Region Południowy 9.8 10.2 9.3 11.3 27.9 45.2 Małopolskie 10.4 10.9 10.3 11.6 30.9 47.2 Śląskie 9.4 9.7 8.6 11.1 25.6 43.6 Region Wschodni 11.7 12.0 11.8 12.2 34.3 42.3 Lubelskie 10.5 10.3 10.1 10.6 31.0 41.4 Podkarpackie 13.2 14.4 14.3 14.5 43.5 38.4 Świętokrzyskie 13.1 13.0 12.7 13.5 32.2 47.8 Podlaskie 9.2 9.9 9.8 10.1 (25.8) 45.7 Region Północno-Zachodni 9.2 9.3 8.1 10.8 25.0 41.7 Wielkopolskie 8.5 8.8 6.8 11.4 21.9 45.2 Zachodniopomorskie 10.9 10.1 10.6 9.5 32.2 44.5 Lubuskie 9.0 9.7 8.9 10.7 (27.8) (27.1) Region Południowo-Zachodni 10.7 10.8 10.0 11.8 27.9 40.6 Dolnośląskie 11.1 11.3 10.5 12.2 30.1 42.1 Opolskie 9.5 9.4 8.5 10.5 (21.8) (35.3) Region Północny 10.7 11.2 10.5 12.1 29.2 42.2 Kujawsko-Pomorskie 11.9 12.4 11.0 14.3 32.3 40.2 Warmińsko-Mazurskie 11.0 11.4 10.7 12.3 (28.8) 45.8 Pomorskie 9.5 10.0 10.0 10.2 26.5 41.8 PORTUGAL 15.7 16.3 16.1 16.4 37.7 56.3 Continente 15.6 16.2 15.9 16.5 37.3 56.0 Norte 16.1 17.2 16.4 18.1 35.1 58.7 Algarve 17.9 17.1 18.2 15.9 39.5 50.1 Centro (PT) 12.0 11.7 11.4 12.0 31.0 50.5 Lisboa 17.6 18.5 19.1 17.8 45.5 57.3 Alentejo 15.9 16.8 15.7 18.2 38.9 53.0 Região autónoma dos Açores 15.3 17.0 19.3 13.9 39.6 58.0 Região autónoma da Madeira 17.5 18.3 19.8 16.7 51.5 64.1 ROMANIA 7.0 7.3 7.9 6.6 23.6 46.4 Macroregiunea unu 6.9 6.6 6.7 6.4 23.6 50.3 Nord-Vest 4.5 4.1 3.9 4.3 15.8 48.8 Centru 9.8 9.7 10.0 9.3 33.1 51.1 Macroregiunea doi 6.7 6.7 7.5 5.7 18.7 49.6 Nord-Est 4.3 4.6 5.1 4.0 12.4 42.4 Sud-Est 10.2 10.0 10.9 8.7 29.6 54.8 Macroregiunea trei 8.3 9.0 9.6 8.3 30.6 36.8 Sud-Muntenia 9.9 9.9 10.3 9.5 32.4 44.4 Bucureşti-Ilfov 6.2 7.8 8.7 6.8 26.1 23.6 Macroregiunea patru 6.0 6.8 7.6 5.7 23.5 54.1 Sud-Vest Oltenia 6.7 8.0 9.6 5.8 25.0 60.8 Vest 5.1 5.3 5.1 5.6 21.3 41.8 SLOVENIA 8.8 10.1 9.4 10.9 21.6 51.0 Vzhodna Slovenija 10.0 11.4 10.5 12.6 26.5 53.1 Zahodna Slovenija 7.6 8.7 8.2 9.2 16.4 48.0 SLOVAKIA 14.0 14.2 14.0 14.5 33.7 70.2 Bratislavský kraj 5.7 6.4 6.2 6.5 19.7 42.1 Západné Slovensko 11.3 11.7 10.5 13.2 29.5 67.1 Stredné Slovensko 16.2 16.8 17.4 16.0 35.8 72.7 Východné Slovensko 19.0 18.5 18.3 18.6 39.8 74.9 FINLAND 7.7 8.2 8.8 7.5 19.9 20.6 Manner-Suomi 7.7 8.2 8.9 7.5 19.9 20.6 Länsi-Suomi 8.2 8.5 9.3 7.6 21.9 22.7 Helsinki-Uusimaa 6.3 6.7 7.2 6.2 17.2 19.0 Etelä-Suomi 7.5 8.4 8.9 7.9 20.8 22.3 Pohjois- ja Itä-Suomi 9.5 9.9 10.6 9.1 20.8 19.0 Åland u u u u u u SWEDEN 8.0 8.1 8.2 7.9 23.5 17.7 Östra Sverige 7.6 7.7 7.7 7.6 21.7 18.1 Stockholm 6.8 6.9 6.8 6.9 19.8 17.5 Östra Mellansverige 8.6 8.8 8.9 8.7 24.1 18.7 Södra Sverige 8.2 8.5 8.6 8.3 24.8 18.5 Småland med öarna 7.4 7.1 7.2 7.0 22.2 17.3 Sydsverige 9.4 9.9 10.2 9.5 27.5 20.5 Västsverige 7.7 8.0 8.1 7.9 24.1 17.2 Norra Sverige 8.3 8.0 8.3 7.5 24.4 14.6 Norra Mellansverige 8.6 8.8 8.6 9.0 26.6 16.3 Mellersta Norrland 8.4 7.2 7.9 6.3 23.4 (13.1) Övre Norrland 7.7 7.2 8.2 6.0 21.5 12.4 ( ) Data with reduced reliability due to sample size. u Data not published due to small sample size.
  • 9. Unemployment in the regions of the European Union Unemployment rates, % Long-term unemployment share,% Total Males Females 15-24 years old 2012 2013 2013 2013 2013 2013 EU281 10.5 10.8 10.8 10.9 23.4 47.5 UNITED KINGDOM 7.9 7.5 7.9 7.0 20.5 36.2 North East (England) 10.2 10.1 10.6 9.4 26.3 38.7 Tees Valley & Durham 11.6 10.9 11.0 10.8 30.0 38.3 Northumberland and Tyne & Wear 9.1 9.4 10.3 8.3 23.6 39.1 North West (England) 8.8 8.1 8.8 7.2 19.2 36.4 Cumbria 6.4 5.1 (5.8) (4.4) (12.4) (37.9) Greater Manchester 10.2 9.5 10.8 8.0 21.8 37.9 Lancashire 7.8 7.2 7.2 7.2 19.9 31.7 Cheshire 5.9 5.2 5.1 5.4 (15.0) (33.2) Merseyside 9.8 8.9 10.1 7.6 18.0 38.0 Yorkshire & the Humber 9.1 8.8 9.5 7.9 22.8 41.2 East Yorkshire & Northern Lincolnshire 9.8 8.4 8.4 8.4 20.8 40.0 North Yorkshire 5.1 4.4 5.6 (2.9) (13.0) (37.5) South Yorkshire 10.5 10.5 10.4 10.7 25.2 38.2 West Yorkshire 9.5 9.5 10.7 7.9 24.7 44.3 East Midlands (England) 7.8 7.3 7.7 6.9 18.2 34.2 Derbyshire & Nottinghamshire 8.3 7.2 7.9 6.5 19.1 32.4 Leicestershire, Rutland & Northamptonshire 6.9 7.8 7.6 7.9 16.5 33.7 Lincolnshire 8.5 6.4 7.0 (5.6) (19.2) (41.5) West Midlands (England) 8.5 9.1 9.5 8.5 24.7 43.3 Herefordshire, Worcestershire & Warwickshire 4.9 5.1 5.8 4.2 15.5 33.1 Shropshire & Staffordshire 6.6 6.1 6.6 5.5 15.3 31.7 West Midlands 11.7 12.9 13 12.8 33.5 48.7 East of England 6.7 6.0 6.2 5.8 17.5 33.2 East Anglia 6.4 6.2 7.0 5.3 17.9 33.3 Bedfordshire & Hertfordshire 6.3 5.6 5.1 6.1 15.5 31.7 Essex 7.4 6.3 6.3 6.4 18.8 34.4 London 8.8 8.4 8.3 8.6 24.7 34.7 Inner London 9.1 8.6 8.6 8.6 23.9 33.9 Outer London 8.6 8.3 8.1 8.6 25.1 35.3 South East (England) 6.3 5.8 6.1 5.5 17.7 27.9 Berkshire, Buckinghamshire & Oxfordshire 5.6 5.1 5.6 4.6 17.4 31.3 Surrey, East & West Sussex 5.8 5.4 5.4 5.5 16.4 25.5 Hampshire & Isle of Wight 6.3 5.7 5.9 5.4 16.6 24.5 Kent 8.0 7.6 8.2 6.9 21.4 30.5 South West (England) 5.8 6.2 6.7 5.5 17.5 31.5 Gloucestershire, Wiltshire & Bristol/Bath area 6.1 6.2 6.7 5.7 17.7 29.7 Dorset & Somerset 5.1 5.5 6.1 4.9 14.7 34.7 Cornwall & Isles of Scilly 5.6 5.6 (6.4) (4.8) (14.3) (34.9) Devon 5.9 7.1 7.8 6.3 21.5 31.1 Wales 8.6 7.7 8.1 7.2 21.2 36.9 West Wales & the Valleys 9.2 7.8 8.5 7.1 20.5 39.3 East Wales 7.6 7.4 7.5 7.3 22.4 33.0 Scotland 7.9 7.1 7.7 6.6 19.2 35.7 Eastern Scotland 7.5 7.1 7.6 6.7 23.0 34.7 South Western Scotland 9.8 8.3 8.8 7.6 19.2 39.8 North Eastern Scotland 4.7 4.7 (4.0) (5.6) u u Highlands & Islands 4.6 4.4 (6.4) u u u Northern Ireland 7.4 7.6 9.6 5.1 22.2 53.3 ( ) Data with reduced reliability due to sample size. u Data not published due to small sample size.
  • 10. Unemployment in the regions of the EFTA and Candidate countries Unemployment rates, % Long-term unemployment share,% Total Males Females 15-24 years old 2012 2013 2013 2013 2013 2013 EU281 10.5 10.8 10.8 10.9 23.4 47.5 ICELAND 6.0 5.4 5.6 5.1 10.6 18.2 NORWAY 3.1 3.4 3.6 3.2 9.1 19.8 Oslo og Akershus 3.2 3.9 3.9 3.9 10.3 21.1 Hedmark og Oppland 3.0 2.9 3.1 2.8 9.2 (23.3) Sør-Østlandet 3.5 3.9 4.3 3.5 10.1 20.3 Agder og Rogaland 2.7 3.2 3.4 2.9 7.5 20.6 Vestlandet 2.9 3.1 3.2 2.9 8.8 14.6 Trøndelag 3.3 2.6 2.7 2.5 7.0 (21.8) Nord-Norge 3.3 3.2 3.4 3.0 10.0 (18.7) SWITZERLAND 4.2 4.4 4.3 4.5 8.5 30.4 Région lémanique 6.6 6.6 6.5 6.7 16.0 33.2 Espace Mittelland 3.5 3.8 3.7 4.0 7.8 30.2 Nordwestschweiz 4.1 4.1 4.2 4.1 6.2 33.5 Zürich 3.6 4.2 4.4 4.0 6.9 26.8 Ostschweiz 3.3 3.6 3.3 3.9 6.7 24.6 Zentralschweiz 2.7 2.6 2.3 3.1 (4.3) (26.3) Ticino 6.9 6.8 6.4 7.3 (16.2) (38.4) FORMER YUGOSLAV REP. OF MACEDONIA 31.0 29.0 29.0 29.0 51.9 82.3 TURKEY 8.1 8.7 7.9 10.6 16.9 21.6 Istanbul 10.7 10.6 9.2 13.9 18.3 20.8 Bati Marmara 5.4 6.0 4.9 8.3 14.4 20.2 Tekirdağ, Edirne, Kirklareli 6.2 6.4 4.9 9.6 13.3 17.7 Balikesir, Çanakkale 4.5 5.6 5.0 6.7 15.8 23.5 Ege 8.5 9.3 7.4 12.8 18.4 25.1 Izmir 13.3 14.3 10.7 20.8 25.2 29.3 Aydin, Denizli, Mugla 6.6 6.0 5.2 7.5 12.8 16.1 Manisa, Afyonkarahisar, Kütahya, Usak 4.1 5.2 4.7 6.1 12.9 18.7 Doğu Marmara 7.6 7.5 6.1 10.6 16.6 23.3 Bursa, Eskisehir, Bilecik 6.4 6.0 4.8 8.7 13.2 19.4 Kocaeli, Sakarya, Düzce, Bolu, Yalova 8.9 9.0 7.5 12.4 20.0 25.9 Bati Anadolu 7.3 7.5 5.8 11.6 16.2 24.7 Ankara 8.3 9.0 6.8 14.6 20.7 26.4 Konya, Karaman 5.0 3.8 3.6 4.4 7.7 14.9 Akdeniz 8.5 9.8 9.0 11.5 17.6 17.3 Antalya, Isparta, Burdur 7.3 7.2 6.3 9.0 15.0 15.9 Adana, Mersin 9.1 11.3 9.7 15.0 19.6 17.3 Hatay, Kahramanmaras, Osmaniye 9.0 10.8 11.1 10.0 17.3 18.6 Orta Anadolu 6.9 7.3 7.0 8.1 14.9 22.8 Kirikkale, Aksaray, Nigde, Nevsehir, Kirsehir 6.2 5.5 5.4 5.9 12.8 16.6 Kayseri, Sivas, Yozgat 7.3 8.4 8.0 9.5 16.1 25.4 Bati Karadeniz 5.3 5.7 4.9 7.1 14.6 24.6 Zonguldak, Karabük, Bartin 6.5 6.2 5.1 8.0 15.8 18.5 Kastamonu, Çankiri, Sinop 4.5 5.6 4.6 7.5 13.6 36.9 Samsun, Tokat, Çorum, Amasya 4.9 5.5 5.0 6.6 14.4 24.2 Doğu Karadeniz 5.2 6.0 6.8 4.6 20.3 34.3 Kuzeydoğu Anadolu 5.9 5.9 6.7 4.1 10.0 16.7 Erzurum, Erzincan, Bayburt 5.5 6.1 7.0 4.1 11.2 17.7 Ağri, Kars, Igdir, Ardahan 6.3 5.6 6.4 4.0 9.3 15.9 Ortadoğu Anadolu 6.6 7.3 8.5 4.6 14.0 15.4 Malatya, Elazig, Bingöl, Tunceli 5.8 5.7 6.0 5.1 11.6 9.8 Van, Mus, Bitlis, Hakkari 7.5 9.2 10.8 3.6 16.0 19.3 Güneydoğu Anadolu 11.0 13.1 13.8 10.1 18.9 18.7 Gaziantep, Adiyaman, Kilis 10.6 6.2 6.2 6.3 10.2 13.9 Şanliurfa, Diyarbakir 6.0 16.0 17.1 10.9 19.6 13.7 Mardin, Batman, Sirnak, Siirt 18.8 19.4 19.7 17.5 27.6 28.3 ( ) Data with reduced reliability due to sample size.