SlideShare a Scribd company logo
1 of 26
1
Workshop on:
Using the E-views.9 program
Introduction
STEP 1: UnitRoot Tests
STEP 2: Estimatethe MultivariateVECM Model
STEP 2.1:Select the Optimum Lag Length
STEP 2.2:Johansen Co-integration Test
STEP 2.3:VECM Model
STEP 2.4:Grangercausalitytest
STEP 2.5:Variancedecomposition (VDC)
STEP 2.6:Impulseresponse functions(IRFs)
Prof.Dr.Nabeel Aljanabi
University of Al-Qadisiyah -Iraq
2
Introduction
This workshop explains the steps to carry out Unit Root tests, Johansen co-integration test,
Granger Causality, variance decomposition and Impulse response functions.
This example analyzes the importance of the monetary policy and its transmission mechanism in
the fast-growing Bahrain economy. The monetary model is:
M3 = f(Y, R, P) (1)
where M3 is money supply; Y is oil production index, R is Interest Rate, and P is Consumer
Price Index (CPI).
The data file is covering from 1980M1 to 2008:M12.
3
Year M3 R P Y
1980M1 26281.8 3.49 46.1 12.54
1980M2 27301 3.59 46.21 12.61
1980M3 27926 3.66 46.28 13.22
1980M4 28721.9 3.75 46.13 13.56
1980M5 29483 4.1 46.49 13.72
1980M6 30130 4.17 46.86 12.93
1980M7 30747.6 4.14 47.36 14.06
1980M8 31157.6 4.14 47.78 13.29
1980M9 30864 4.26 47.62 13.95
1980M10 31272.7 4.33 47.89 13.83
1980M11 31906.4 4.47 48.54 13.56
1980M12 32687.6 4.46 48.94 13.39
1981M1 34458.1 4.42 49.78 13.06
: : : : :
: : : : :
: : : : :
2008M9 912780 3.56 114.73 105.04
2008M10 900443 3.55 114.23 104.35
2008M11 909231 3.38 112.93 100.38
2008M12 931656 3.02 111.83 95.92
1. Open E-view 9 – File – New -- Work file
4
2. Choose the frequency as Monthly – from 1980 M1 to 2008 M12 and then Click “OK”
3. Click the button “Quick” and “Empty Group (Edit Series)”
Place your cursor to the left of the first row (obs)
5
4. Copy the original data from Excel file.
5. Paste the data to E-view worksheet
6
6. Transform the variables into logarithm from [Type the following generate (genr)
command]:
genr lm3 = log(m3)
genr lp = log(p)
genr lr = log(r)
genr ly = log(y)
STEP 1: UnitRoot Tests
7
7. Checking for Unit Root – For example: lm3. Double click on “lm3”, click “View” and
choose the Unit Root Test.
8. We can choose Augmented Dickey Fuller (ADF) test and the optimal lag length is
selected by Akaike Information Criteria (large sample size).
i) First, we perform the unit root test of “lm3”: level model with constant but
without trend model (let say the maximum lag is 16) .
ii) Second, we perform the Unit root test again for the level model but now with
constant with trend model.
8
E-view Output for level Unit Root Test:
Constant without Trend Model:
Null Hypothesis:LM3 has a unit root
Exogenous: Constant
Lag Length: 16 (Automatic based on AIC, MAXLAG=16)
t-Statistic Prob.*
Augmented Dickey-Fuller test statistic -1.166712 0.6897
Test critical values: 1% level -3.449917
5% level -2.870057
10% level -2.571377
*MacKinnon (1996) one-sided p-values.
Constant with Trend Model:
Null Hypothesis:LM3 has a unit root
Exogenous: Constant, Linear Trend
Lag Length: 15 (Automatic based on AIC, MAXLAG=16)
t-Statistic Prob.*
Augmented Dickey-Fuller test statistic -1.559270 0.8069
Test critical values: 1% level -3.985941
5% level -3.423418
10% level -3.134664
*MacKinnon (1996) one-sided p-values.
After that, we estimate the first difference with and without trend models (repeat the
same process but now select 1st difference).
9
E-view Output for First Different Unit Root Test:
Constant without Trend Model:
Null Hypothesis:D(LM3) has a unit root
Exogenous: Constant
Lag Length: 14 (Automatic based on AIC, MAXLAG=16)
t-Statistic Prob.*
Augmented Dickey-Fuller test statistic -2.865942 0.0505
Test critical values: 1% level -3.449857
5% level -2.870031
10% level -2.571363
*MacKinnon (1996) one-sided p-values.
Constant with Trend Model:
Null Hypothesis:D(LM3) has a unit root
Exogenous: Constant, Linear Trend
Lag Length: 15 (Automatic based on AIC, MAXLAG=16)
t-Statistic Prob.*
Augmented Dickey-Fuller test statistic -3.051348 0.1200
Test critical values: 1% level -3.986026
5% level -3.423459
10% level -3.134688
*MacKinnon (1996) one-sided p-values.
9. We also can perform another unit root test namely Phillips-Perron (PP) test.
E-views Output:
10
i. Level, Constant Without Trend
Null Hypothesis:LM3 has a unit root
Exogenous:Constant
Bandwidth:9 (Newey-Westusing Bartlett kernel)
Adj. t-Stat Prob.*
Phillips-Perron teststatistic -2.469495 0.1239
Test critical values: 1% level -3.448998
5% level -2.869653
10% level -2.571161
*MacKinnon (1996) one-sided p-values.
ii. Level, Constant With Trend
Null Hypothesis:LM3 has a unit root
Exogenous:Constant,Linear Trend
Bandwidth:9 (Newey-Westusing Bartlett kernel)
Adj. t-Stat Prob.*
Phillips-Perron teststatistic -1.041872 0.9355
Test critical values: 1% level -3.984726
5% level -3.422828
10% level -3.134315
*MacKinnon (1996) one-sided p-values.
iii. First Difference, Constant Without Trend
Null Hypothesis:D(LM3) has a unit root
Exogenous:Constant
Bandwidth:9 (Newey-Westusing Bartlett kernel)
Adj. t-Stat Prob.*
Phillips-Perron teststatistic -16.62462 0.0000
Test critical values: 1% level -3.449053
5% level -2.869677
10% level -2.571174
*MacKinnon (1996) one-sided p-values.
iv. First Difference, Constant With Trend
Null Hypothesis:D(LM3) has a unit root
11
Exogenous:Constant,Linear Trend
Bandwidth:8 (Newey-Westusing Bartlett kernel)
Adj. t-Stat Prob.*
Phillips-Perron teststatistic -16.73624 0.0000
Test critical values: 1% level -3.984804
5% level -3.422865
10% level -3.134337
*MacKinnon (1996) one-sided p-values.
Table 1 below presents the results of Unit Root Tests:
Table 1 Unit Root Tests
Augmented Dickey Fuller
(ADF)
Phillips Perron
(PP)
Level
Variable Constant
Without Trend
Constant
With Trend
Constant
Without Trend
Constant
With Trend
LM3 -1.1667
(16)
-1.5593
(15)
-2.4695
[9]
-1.0419
[9]
LP
LR
LY
First Difference
LM3 -2.866**
(14)
-3.0513
(15)
-16.6246***
[9]
-16.7362***
[8]
LP
LR
LY
Note: *** and ** denotes significant at 1%, and 5% significance level, respectively. The figure in
parenthesis (…) represents optimum lag length selected based on Akaike Info Critirion. The figure in
bracket […] represents the Bandwidth used in the KPSS test selected based on Newey-West
Bandwidth critirion.
Please complete the above results of Unit Root Tests
STEP 2: Estimatethe MultivariateVECM Model
12
10. After testing the variables are stationary at first order or I(1), then the step is to estimate
the Vector Error-correction Model (VECM). Firstly, we need to select an optimum lag of
VECM model before performing the Johansen cointegration test.
(You should show all the four log variables).
Then click “Quick” – “Estimate VAR” – “Vector Error Correction”
13
11. From equation (1), the VECM model can be written as:
∆𝐿𝑀31𝑡 = 𝜇1𝑡 − ∅1(𝐿𝑀3− 𝛾0 − 𝛾1 𝐿𝑌 − 𝛾2 𝐿𝑅 − 𝛾3 𝐿𝑃) 𝑡−1 + ∑ 𝛽1,𝑗 ∆𝐿𝑀31𝑡−𝑖
𝑗
𝑖=1 +
∑ 𝛽2,𝑗 ∆𝐿𝑌1𝑡−𝑖 + ∑ 𝛽3,𝑗 ∆𝐿𝑅1𝑡−𝑖 + ∑ ∆𝐿𝑃1𝑡−𝑖 + 𝜀1𝑡
𝑗
𝑖=1
𝑗
𝑖=1
𝑗
𝑖=1
(2)
∆𝐿𝑌2𝑡 = 𝜇2𝑡 − ∅2 (𝐿𝑀3 − 𝛾0 − 𝛾1 𝐿𝑌 − 𝛾2 𝐿𝑅 − 𝛾3 𝐿𝑃) 𝑡−1 + ∑ ∆𝐿𝑀32𝑡−𝑖
𝑗
𝑖=1 +
∑ ∆𝐿𝑌2𝑡−𝑖 + ∑ ∆𝐿𝑅2𝑡−𝑖 + ∑ ∆𝐿𝑃2𝑡−𝑖 + 𝜀2𝑡
𝑗
𝑖=1
𝑗
𝑖=1
𝑗
𝑖=1
(3)
∆𝐿𝑅3𝑡 = 𝜇3𝑡 − ∅3(𝐿𝑀3 − 𝛾0 − 𝛾1 𝐿𝑌 − 𝛾2 𝐿𝑅 − 𝛾3 𝐿𝑃) 𝑡−1 + ∑ ∆𝐿𝑀33𝑡−𝑖
𝑗
𝑖=1 +
∑ ∆𝐿𝑌3𝑡−𝑖 + ∑ ∆𝐿𝑅3𝑡−𝑖 + ∑ ∆𝐿𝑃3𝑡−𝑖 + 𝜀3𝑡
𝑗
𝑖=1
𝑗
𝑖=1
𝑗
𝑖=1
(4)
∆𝐿𝑃4𝑡 = 𝜇4𝑡 − ∅4(𝐿𝑀3− 𝛾0 − 𝛾1 𝐿𝑌 − 𝛾2 𝐿𝑅 − 𝛾3 𝐿𝑃) 𝑡−1 + ∑ ∆𝐿𝑀34𝑡−𝑖
𝑗
𝑖=1 +
∑ ∆𝐿𝑌4𝑡−𝑖 + ∑ ∆𝐿𝑅4𝑡−𝑖 + ∑ ∆𝐿𝑃4𝑡−𝑖 + 𝜀4𝑡
𝑗
𝑖=1
𝑗
𝑖=1
𝑗
𝑖=1
(5)
14
STEP 2.1: Select the Optimum Lag Length
(a) First, we estimate the VECM model with lag 1
(b) Make residuals for the VECM models, click “Proc” – “Make Residuals”
EViews will show 4 residuals in the EViews Workfile – resid01 (residual in Equation 1),
resid02 (residual in Equation 2), resid03 (residual in Equation 3), and resid04 (residual in
Equation 4).
Type in all variables with
lm3 first (dependent
variable)
LM3 LY LR LP
Change 2 to 1
15
(c) Now, the autocorrelation of the error terms in each regression is checked by using the
Ljung-Box Q-statistic.
We double click the “resid01” – “View” – “Correlogram…” – “OK”
16
E-Views Output:
The Q-statistic shows that the error terms are statistically significant from lag 12 for
“resid01”. This indicates that the model with lag 1 has autocorrelation problem. Hence,
we need to re-estimate the VECM model by increasing one lag (repeat the same process
but now with lag 2).
This process will continue until each of the regression error terms is free from
autocorrelation problem (where the p-values of Q-statistic are greater than 0.05).
In this case, we repeat the same process and the optimum lag is 12.
The p-value is less
than 0.05. This
implies that the
regression residuals
have autocorrelation
problem.
17
12. The E-Views output with 12 lag is as follows:
STEP 2.2:Johansen Co-integration Test
13. After obtaining the optimum lag, the next step is to estimate the Johansen Co-integration
Test. Click “View” – “Co-integration Test” – “OK”.
Error
correction
terms
(ECT)
Long-run
Equation
18
E-Views Output:
Sample (adjusted):1981M02 2008M12
Included observations:335 after adjustments
Trend assumption:Linear deterministic trend
Series:LM3 LP LR LY
Lags interval (in first differences):1 to 12
Unrestricted Cointegration Rank Test(Trace)
Hypothesized Trace 0.05
No. of CE(s) Eigenvalue Statistic Critical Value Prob.**
None * 0.088734 51.98841 47.85613 0.0194
At most 1 0.043366 20.86000 29.79707 0.3664
At most 2 0.014884 6.007864 15.49471 0.6946
At most 3 0.002934 0.984286 3.841466 0.3211
Trace test indicates 1 cointegrating eqn(s) atthe 0.05 level
* denotes rejection ofthe hypothesis at the 0.05 level
**MacKinnon-Haug-Michelis (1999) p-values
Unrestricted Cointegration Rank Test(Maximum Eigenvalue)
Hypothesized Max-Eigen 0.05
No. of CE(s) Eigenvalue Statistic Critical Value Prob.**
None * 0.088734 31.12841 27.58434 0.0168
At most 1 0.043366 14.85214 21.13162 0.2994
At most 2 0.014884 5.023578 14.26460 0.7388
At most 3 0.002934 0.984286 3.841466 0.3211
0.05 represent 5%
significance level.
19
Max-eigenvalue test indicates 1 co-integrating eqn(s) atthe 0.05 level
* denotes rejection ofthe hypothesis at the 0.05 level
**MacKinnon-Haug-Michelis (1999) p-values
Table 2 presents the Johansen-Juselius Co-integration test. The result shows that both
Trace test and Max-Eigen test are statistically significant to reject the null hypothesis of r
= 0 at 5% significance level. Therefore, only one long run co-integration relationship
between M3 and it determinants.
Table 2: Johansen-Juselius Co-integration Tests
Hypothesized Trace Max-Eigen Critical Values (5%)
No. of CE(s) Statistic Statistic Trace Max-Eigen
r = 0 51.9884** 31.1284** 47.856 27.584
r ≤ 1 20.860 14.852 29.797 21.132
r ≤ 2 6.0078 5.0235 15.495 14.265
r ≤ 3 0.9843 0.9843 3.8415 3.8415
Note: ** denotes significant at 5% significance levels.
STEP 2.3:VECM Model
If the model contains co-integration relationship among the variables, then we can
proceed to VECM and the long run equation is:
LM3t-1 = - 5.0146 + 3.6031 LPt-1 + 0.2233 LRt-1+ 0.3357 LYt-1
s.e (0.2872) (0.0494) (0.0946)
t-stat [12.5459] [4.5212] [3.5477]
All variables are positively significant at 5% significance level.
You can write this
equation by referring to
page 15 (but the
coefficient signs are now
reversed, why?)
20
STEP 2.4: Grangercausalitytest
14. After estimating the long-run VECM model, then we proceed to the short run Granger
causality test. Click “View” – “Lag Structure” – “Granger Causality/Block Exogeneity
Tests”.
E-Views Output:
VEC Granger Causality/Block Exogeneity Wald Tests
Sample:1980M01 2008M12
Included observations:335
Dependentvariable:D(LM3)
Excluded Chi-sq df Prob.
D(LP) 30.22932 12 0.0026
D(LR) 14.72288 12 0.2569
D(LY) 21.50639 12 0.0434
All 67.21100 36 0.0012
21
Dependentvariable:D(LP)
Excluded Chi-sq df Prob.
D(LM3) 23.98443 12 0.0204
D(LR) 23.39792 12 0.0245
D(LY) 23.92561 12 0.0208
All 63.26058 36 0.0033
Dependentvariable:D(LR)
Excluded Chi-sq df Prob.
D(LM3) 15.82326 12 0.1995
D(LP) 12.32216 12 0.4202
D(LY) 13.98317 12 0.3018
All 36.82666 36 0.4305
Dependentvariable:D(LY)
Excluded Chi-sq df Prob.
D(LM3) 17.93616 12 0.1176
D(LP) 16.41443 12 0.1730
D(LR) 10.79759 12 0.5463
All 48.57377 36 0.0786
With Co-integration, the dynamic causal interactions among the variables should be
phrased in a vector error correction form. This allows us to assess both long-run and
short-run causality, respectively, on the 2
 -test of the lagged first differenced terms for
each right-hand-side variable and the t-test of the error correction term. The results of the
test are presented in Table 3.
22
Table 3: Granger Causality Results based on VECM
Independent Variables
Dependent 2
 -statistics of lagged 1st
differenced term
[p-value]
ECTt-1
coefficient
Variable ΔLM3 ΔLP ΔLR ΔLY (t-ratio)
ΔLM3
--
30.23***
[0.003]
14.72
[0.257]
21.51**
[0.043]
-0.028**
(-3.533)
ΔLP 23.98**
[0.020] --
23.39**
[0.024]
23.93**
[0.021]
0.009**
(2.800)
ΔLR 15.82
[0.199]
12.32
[0.420] --
13.98
[0.302]
0.124
(1.947)
ΔLY 17.93
[0.118]
16.41
[0.173]
10.79
[0.546] --
0.093
(2.052)
Note: *** and ** denotessignificant at 1% and 5% significance level, respectively.The figure in the
parenthesis(…) denote as t-statistic and the figure in the squared brackets […] represent as p-value.
and the causal channels can be summarized as below:
LM3 LP
LY LR
23
STEP 2.5: Variancedecomposition (VDC)
15. The result of VECM indicates the erogeneity or endogeneity of a variable in the system
and the direction of Granger-causality within the sample period. However, it does not
provide us with the dynamic properties of the system. The analysis of the dynamic
interactions among the variables in the post-sample period is conducted through variance
decompositions (VDCs) and impulse response functions (IRFs).
E-Views Output:
Variance Decomposition of
LM3:
Period S.E. LM3 LP LR LY
1 0.009207 100.0000 0.000000 0.000000 0.000000
2 0.012581 99.59571 0.237534 7.15E-06 0.166753
3 0.015458 99.50123 0.242707 0.022763 0.233302
4 0.018050 98.21271 0.478537 0.134646 1.174103
5 0.020777 94.57704 1.376087 1.117796 2.929073
6 0.023737 91.01041 2.386103 1.674290 4.929200
7 0.026313 88.11711 2.976382 2.326990 6.579520
8 0.028367 84.90036 3.376980 2.783734 8.938924
9 0.030475 81.38129 2.986563 3.496885 12.13526
10 0.032785 76.88578 2.630474 4.784743 15.69901
Variance Decomposition of LP:
Period S.E. LM3 LP LR LY
Click “View” – “Variance
Decompositions” – “Table”
24
1 0.003904 0.057833 99.94217 0.000000 0.000000
2 0.006102 0.232518 99.30812 0.034317 0.425045
3 0.007787 0.493569 99.04644 0.076551 0.383441
4 0.009032 0.723986 98.88313 0.067843 0.325045
5 0.010067 1.013711 98.49578 0.206479 0.284028
6 0.010816 2.379293 96.86372 0.504991 0.251992
7 0.011544 4.710690 94.19444 0.867165 0.227708
8 0.012314 6.518148 91.82371 1.438480 0.219661
9 0.012968 7.566270 90.49069 1.743578 0.199466
10 0.013545 8.302143 89.10389 2.390148 0.203815
Variance Decomposition of LR:
Period S.E. LM3 LP LR LY
1 0.072920 2.995915 0.019765 96.98432 0.000000
2 0.111546 3.619142 0.098381 96.28206 0.000418
3 0.139640 4.349874 0.076814 95.55480 0.018517
4 0.161746 4.672351 0.223168 95.05622 0.048258
5 0.176165 5.039088 0.224267 94.69537 0.041277
6 0.191569 5.355593 0.193439 94.34811 0.102858
7 0.208351 4.742339 0.306652 94.75085 0.200158
8 0.222819 4.361189 0.434910 94.95968 0.244217
9 0.236249 3.960742 0.732402 94.78659 0.520266
10 0.251486 3.503003 0.914070 94.85731 0.725617
Variance Decomposition of LY:
Period S.E. LM3 LP LR LY
1 0.051559 0.724280 0.570742 0.577937 98.12704
2 0.060572 0.608491 0.768220 0.439926 98.18336
3 0.072073 0.473792 1.096219 0.640465 97.78952
4 0.082283 1.219285 1.277598 0.572537 96.93058
5 0.089036 1.136213 1.872747 0.548866 96.44217
6 0.094439 1.235009 1.895860 0.577269 96.29186
7 0.098761 1.619555 2.445372 0.530370 95.40470
8 0.104042 2.296307 4.431683 0.639905 92.63211
9 0.108643 2.798176 4.585921 1.005189 91.61071
10 0.112538 3.291952 5.643364 1.336476 89.72821
Cholesky Ordering: LM3 LP LR
LY
25
STEP 2.6: Impulseresponse functions(IRFs)
16. Estimate the impulse response functions (IRFs), click “Estimate” and change the “Vector
Error Correction” to “Unrestricted VAR” and increase one more lag for the model from
lag 12 to lag 13.
Select “Impulse”
26
-.010
-.005
.000
.005
.010
.015
1 2 3 4 5 6 7 8 9 10
Response of LM3 to LM3
-.010
-.005
.000
.005
.010
.015
1 2 3 4 5 6 7 8 9 10
Response of LM3 to LP
-.010
-.005
.000
.005
.010
.015
1 2 3 4 5 6 7 8 9 10
Response of LM3 to LR
-.010
-.005
.000
.005
.010
.015
1 2 3 4 5 6 7 8 9 10
Response of LM3 to LY
-.002
.000
.002
.004
.006
1 2 3 4 5 6 7 8 9 10
Response of LP to LM3
-.002
.000
.002
.004
.006
1 2 3 4 5 6 7 8 9 10
Response of LP to LP
-.002
.000
.002
.004
.006
1 2 3 4 5 6 7 8 9 10
Response of LP to LR
-.002
.000
.002
.004
.006
1 2 3 4 5 6 7 8 9 10
Response of LP to LY
-.04
.00
.04
.08
.12
1 2 3 4 5 6 7 8 9 10
Response of LR to LM3
-.04
.00
.04
.08
.12
1 2 3 4 5 6 7 8 9 10
Response of LR to LP
-.04
.00
.04
.08
.12
1 2 3 4 5 6 7 8 9 10
Response of LR to LR
-.04
.00
.04
.08
.12
1 2 3 4 5 6 7 8 9 10
Response of LR to LY
-.04
-.02
.00
.02
.04
.06
1 2 3 4 5 6 7 8 9 10
Response of LY to LM3
-.04
-.02
.00
.02
.04
.06
1 2 3 4 5 6 7 8 9 10
Response of LY to LP
-.04
-.02
.00
.02
.04
.06
1 2 3 4 5 6 7 8 9 10
Response of LY to LR
-.04
-.02
.00
.02
.04
.06
1 2 3 4 5 6 7 8 9 10
Response of LY to LY
Response to Cholesky One S.D. Innovations ± 2 S.E.

More Related Content

What's hot

Session 4 Structural Model Evaluation
Session 4 Structural Model Evaluation Session 4 Structural Model Evaluation
Session 4 Structural Model Evaluation Dr. Firdaus Basbeth
 
Research Methods: Experimental Design I (Single Factor)
Research Methods: Experimental Design I (Single Factor)Research Methods: Experimental Design I (Single Factor)
Research Methods: Experimental Design I (Single Factor)Brian Piper
 
Cointegration analysis: Modelling the complex interdependencies between finan...
Cointegration analysis: Modelling the complex interdependencies between finan...Cointegration analysis: Modelling the complex interdependencies between finan...
Cointegration analysis: Modelling the complex interdependencies between finan...Edward Thomas Jones
 
Reporting pearson correlation in apa
Reporting pearson correlation in apa Reporting pearson correlation in apa
Reporting pearson correlation in apa Amit Sharma
 
Chapter 07 - Autocorrelation.pptx
Chapter 07 - Autocorrelation.pptxChapter 07 - Autocorrelation.pptx
Chapter 07 - Autocorrelation.pptxFarah Amir
 
6. bounds test for cointegration within ardl or vecm
6. bounds test for cointegration within ardl or vecm 6. bounds test for cointegration within ardl or vecm
6. bounds test for cointegration within ardl or vecm Quang Hoang
 
Lecture
Lecture Lecture
Lecture U6410
 
State of Food Security and Nutrition in the World (SOFI) 2021
State of Food Security and Nutrition in the World (SOFI) 2021State of Food Security and Nutrition in the World (SOFI) 2021
State of Food Security and Nutrition in the World (SOFI) 2021Francois Stepman
 
Linear Models and Econometrics Chapter 4 Econometrics.ppt
Linear Models and Econometrics Chapter 4 Econometrics.pptLinear Models and Econometrics Chapter 4 Econometrics.ppt
Linear Models and Econometrics Chapter 4 Econometrics.pptfaisal960287
 
Tutor2u - Income Elasticity of Demand
Tutor2u - Income Elasticity of DemandTutor2u - Income Elasticity of Demand
Tutor2u - Income Elasticity of Demandtutor2u
 
Gains from trade: Consumer and Producer Surplus
Gains from trade: Consumer and Producer SurplusGains from trade: Consumer and Producer Surplus
Gains from trade: Consumer and Producer SurplusAndrew Tibbitt
 
Food Security in Africa: challenges and policy options to ensure Africa's future
Food Security in Africa: challenges and policy options to ensure Africa's futureFood Security in Africa: challenges and policy options to ensure Africa's future
Food Security in Africa: challenges and policy options to ensure Africa's futureCIMMYT
 
Developmentalist theories of economic development
Developmentalist theories of economic development Developmentalist theories of economic development
Developmentalist theories of economic development arslan_bzu
 
International economic ch01
International economic ch01International economic ch01
International economic ch01Judianto Nugroho
 

What's hot (20)

Heteroskedasticity
HeteroskedasticityHeteroskedasticity
Heteroskedasticity
 
Session 4 Structural Model Evaluation
Session 4 Structural Model Evaluation Session 4 Structural Model Evaluation
Session 4 Structural Model Evaluation
 
Research Methods: Experimental Design I (Single Factor)
Research Methods: Experimental Design I (Single Factor)Research Methods: Experimental Design I (Single Factor)
Research Methods: Experimental Design I (Single Factor)
 
Cointegration analysis: Modelling the complex interdependencies between finan...
Cointegration analysis: Modelling the complex interdependencies between finan...Cointegration analysis: Modelling the complex interdependencies between finan...
Cointegration analysis: Modelling the complex interdependencies between finan...
 
19.economic development theories
19.economic development theories19.economic development theories
19.economic development theories
 
Reporting pearson correlation in apa
Reporting pearson correlation in apa Reporting pearson correlation in apa
Reporting pearson correlation in apa
 
Chapter 07 - Autocorrelation.pptx
Chapter 07 - Autocorrelation.pptxChapter 07 - Autocorrelation.pptx
Chapter 07 - Autocorrelation.pptx
 
Key fertilizer price drivers and the impact of conflict in Ukraine on fertili...
Key fertilizer price drivers and the impact of conflict in Ukraine on fertili...Key fertilizer price drivers and the impact of conflict in Ukraine on fertili...
Key fertilizer price drivers and the impact of conflict in Ukraine on fertili...
 
How we can use impact evaluation to assure effective use of resources for dev...
How we can use impact evaluation to assure effective use of resources for dev...How we can use impact evaluation to assure effective use of resources for dev...
How we can use impact evaluation to assure effective use of resources for dev...
 
6. bounds test for cointegration within ardl or vecm
6. bounds test for cointegration within ardl or vecm 6. bounds test for cointegration within ardl or vecm
6. bounds test for cointegration within ardl or vecm
 
Dummy variables
Dummy variablesDummy variables
Dummy variables
 
Lecture
Lecture Lecture
Lecture
 
State of Food Security and Nutrition in the World (SOFI) 2021
State of Food Security and Nutrition in the World (SOFI) 2021State of Food Security and Nutrition in the World (SOFI) 2021
State of Food Security and Nutrition in the World (SOFI) 2021
 
Linear Models and Econometrics Chapter 4 Econometrics.ppt
Linear Models and Econometrics Chapter 4 Econometrics.pptLinear Models and Econometrics Chapter 4 Econometrics.ppt
Linear Models and Econometrics Chapter 4 Econometrics.ppt
 
Tutor2u - Income Elasticity of Demand
Tutor2u - Income Elasticity of DemandTutor2u - Income Elasticity of Demand
Tutor2u - Income Elasticity of Demand
 
Gains from trade: Consumer and Producer Surplus
Gains from trade: Consumer and Producer SurplusGains from trade: Consumer and Producer Surplus
Gains from trade: Consumer and Producer Surplus
 
Food Security in Africa: challenges and policy options to ensure Africa's future
Food Security in Africa: challenges and policy options to ensure Africa's futureFood Security in Africa: challenges and policy options to ensure Africa's future
Food Security in Africa: challenges and policy options to ensure Africa's future
 
Developmentalist theories of economic development
Developmentalist theories of economic development Developmentalist theories of economic development
Developmentalist theories of economic development
 
Time series
Time seriesTime series
Time series
 
International economic ch01
International economic ch01International economic ch01
International economic ch01
 

Similar to Time series analysis use E-views programer

ECONOMIC LOAD DISPATCH USING PARTICLE SWARM OPTIMIZATION
ECONOMIC LOAD DISPATCH USING PARTICLE SWARM OPTIMIZATIONECONOMIC LOAD DISPATCH USING PARTICLE SWARM OPTIMIZATION
ECONOMIC LOAD DISPATCH USING PARTICLE SWARM OPTIMIZATIONMln Phaneendra
 
EENG519FinalProjectReport
EENG519FinalProjectReportEENG519FinalProjectReport
EENG519FinalProjectReportDaniel K
 
MODELLING ANALYSIS & DESIGN OF DSP BASED NOVEL SPEED SENSORLESS VECTOR CONTRO...
MODELLING ANALYSIS & DESIGN OF DSP BASED NOVEL SPEED SENSORLESS VECTOR CONTRO...MODELLING ANALYSIS & DESIGN OF DSP BASED NOVEL SPEED SENSORLESS VECTOR CONTRO...
MODELLING ANALYSIS & DESIGN OF DSP BASED NOVEL SPEED SENSORLESS VECTOR CONTRO...IAEME Publication
 
White boxvsblackbox
White boxvsblackboxWhite boxvsblackbox
White boxvsblackboxsanerjjd
 
Hand gesture recognition using discrete wavelet transform and hidden Markov m...
Hand gesture recognition using discrete wavelet transform and hidden Markov m...Hand gesture recognition using discrete wavelet transform and hidden Markov m...
Hand gesture recognition using discrete wavelet transform and hidden Markov m...TELKOMNIKA JOURNAL
 
Efficient realization-of-an-adfe-with-a-new-adaptive-algorithm
Efficient realization-of-an-adfe-with-a-new-adaptive-algorithmEfficient realization-of-an-adfe-with-a-new-adaptive-algorithm
Efficient realization-of-an-adfe-with-a-new-adaptive-algorithmCemal Ardil
 
Power System Modeling and Simulation lab manual
Power System Modeling and Simulation lab manualPower System Modeling and Simulation lab manual
Power System Modeling and Simulation lab manualDHEERAJ DHAKAR
 
Model predictive-fuzzy-control-of-air-ratio-for-automotive-engines
Model predictive-fuzzy-control-of-air-ratio-for-automotive-enginesModel predictive-fuzzy-control-of-air-ratio-for-automotive-engines
Model predictive-fuzzy-control-of-air-ratio-for-automotive-enginespace130557
 
Fractional-order sliding mode controller for the two-link robot arm
Fractional-order sliding mode controller for the two-link robot arm Fractional-order sliding mode controller for the two-link robot arm
Fractional-order sliding mode controller for the two-link robot arm IJECEIAES
 
Forecasting day ahead power prices in germany using fixed size least squares ...
Forecasting day ahead power prices in germany using fixed size least squares ...Forecasting day ahead power prices in germany using fixed size least squares ...
Forecasting day ahead power prices in germany using fixed size least squares ...Niklas Ignell
 
A Brain Computer Interface Speller for Smart Devices
A Brain Computer Interface Speller for Smart DevicesA Brain Computer Interface Speller for Smart Devices
A Brain Computer Interface Speller for Smart DevicesMahmoud Helal
 
Economic Dispatch of Generated Power Using Modified Lambda-Iteration Method
Economic Dispatch of Generated Power Using Modified Lambda-Iteration MethodEconomic Dispatch of Generated Power Using Modified Lambda-Iteration Method
Economic Dispatch of Generated Power Using Modified Lambda-Iteration MethodIOSR Journals
 
Output feedback trajectory stabilization of the uncertainty DC servomechanism...
Output feedback trajectory stabilization of the uncertainty DC servomechanism...Output feedback trajectory stabilization of the uncertainty DC servomechanism...
Output feedback trajectory stabilization of the uncertainty DC servomechanism...ISA Interchange
 
On tracking control problem for polysolenoid motor model predictive approach
On tracking control problem for polysolenoid motor model predictive approach On tracking control problem for polysolenoid motor model predictive approach
On tracking control problem for polysolenoid motor model predictive approach IJECEIAES
 
Data-Driven Security Assessment of Power Grids Based on Machine Learning Appr...
Data-Driven Security Assessment of Power Grids Based on Machine Learning Appr...Data-Driven Security Assessment of Power Grids Based on Machine Learning Appr...
Data-Driven Security Assessment of Power Grids Based on Machine Learning Appr...Power System Operation
 
Phasor State Estimation Weighting Coefficients for AC and Hybrid Networks wit...
Phasor State Estimation Weighting Coefficients for AC and Hybrid Networks wit...Phasor State Estimation Weighting Coefficients for AC and Hybrid Networks wit...
Phasor State Estimation Weighting Coefficients for AC and Hybrid Networks wit...Luigi Vanfretti
 
ML_ Unit 2_Part_B
ML_ Unit 2_Part_BML_ Unit 2_Part_B
ML_ Unit 2_Part_BSrimatre K
 

Similar to Time series analysis use E-views programer (20)

ECONOMIC LOAD DISPATCH USING PARTICLE SWARM OPTIMIZATION
ECONOMIC LOAD DISPATCH USING PARTICLE SWARM OPTIMIZATIONECONOMIC LOAD DISPATCH USING PARTICLE SWARM OPTIMIZATION
ECONOMIC LOAD DISPATCH USING PARTICLE SWARM OPTIMIZATION
 
EENG519FinalProjectReport
EENG519FinalProjectReportEENG519FinalProjectReport
EENG519FinalProjectReport
 
MODELLING ANALYSIS & DESIGN OF DSP BASED NOVEL SPEED SENSORLESS VECTOR CONTRO...
MODELLING ANALYSIS & DESIGN OF DSP BASED NOVEL SPEED SENSORLESS VECTOR CONTRO...MODELLING ANALYSIS & DESIGN OF DSP BASED NOVEL SPEED SENSORLESS VECTOR CONTRO...
MODELLING ANALYSIS & DESIGN OF DSP BASED NOVEL SPEED SENSORLESS VECTOR CONTRO...
 
White boxvsblackbox
White boxvsblackboxWhite boxvsblackbox
White boxvsblackbox
 
Serial correlation
Serial correlationSerial correlation
Serial correlation
 
Hand gesture recognition using discrete wavelet transform and hidden Markov m...
Hand gesture recognition using discrete wavelet transform and hidden Markov m...Hand gesture recognition using discrete wavelet transform and hidden Markov m...
Hand gesture recognition using discrete wavelet transform and hidden Markov m...
 
Efficient realization-of-an-adfe-with-a-new-adaptive-algorithm
Efficient realization-of-an-adfe-with-a-new-adaptive-algorithmEfficient realization-of-an-adfe-with-a-new-adaptive-algorithm
Efficient realization-of-an-adfe-with-a-new-adaptive-algorithm
 
Power System Modeling and Simulation lab manual
Power System Modeling and Simulation lab manualPower System Modeling and Simulation lab manual
Power System Modeling and Simulation lab manual
 
Model predictive-fuzzy-control-of-air-ratio-for-automotive-engines
Model predictive-fuzzy-control-of-air-ratio-for-automotive-enginesModel predictive-fuzzy-control-of-air-ratio-for-automotive-engines
Model predictive-fuzzy-control-of-air-ratio-for-automotive-engines
 
Fractional-order sliding mode controller for the two-link robot arm
Fractional-order sliding mode controller for the two-link robot arm Fractional-order sliding mode controller for the two-link robot arm
Fractional-order sliding mode controller for the two-link robot arm
 
Forecasting day ahead power prices in germany using fixed size least squares ...
Forecasting day ahead power prices in germany using fixed size least squares ...Forecasting day ahead power prices in germany using fixed size least squares ...
Forecasting day ahead power prices in germany using fixed size least squares ...
 
A Brain Computer Interface Speller for Smart Devices
A Brain Computer Interface Speller for Smart DevicesA Brain Computer Interface Speller for Smart Devices
A Brain Computer Interface Speller for Smart Devices
 
Economic Dispatch of Generated Power Using Modified Lambda-Iteration Method
Economic Dispatch of Generated Power Using Modified Lambda-Iteration MethodEconomic Dispatch of Generated Power Using Modified Lambda-Iteration Method
Economic Dispatch of Generated Power Using Modified Lambda-Iteration Method
 
Output feedback trajectory stabilization of the uncertainty DC servomechanism...
Output feedback trajectory stabilization of the uncertainty DC servomechanism...Output feedback trajectory stabilization of the uncertainty DC servomechanism...
Output feedback trajectory stabilization of the uncertainty DC servomechanism...
 
On tracking control problem for polysolenoid motor model predictive approach
On tracking control problem for polysolenoid motor model predictive approach On tracking control problem for polysolenoid motor model predictive approach
On tracking control problem for polysolenoid motor model predictive approach
 
Data-Driven Security Assessment of Power Grids Based on Machine Learning Appr...
Data-Driven Security Assessment of Power Grids Based on Machine Learning Appr...Data-Driven Security Assessment of Power Grids Based on Machine Learning Appr...
Data-Driven Security Assessment of Power Grids Based on Machine Learning Appr...
 
Data-Driven Security Assessment of Power Grids Based on Machine Learning Appr...
Data-Driven Security Assessment of Power Grids Based on Machine Learning Appr...Data-Driven Security Assessment of Power Grids Based on Machine Learning Appr...
Data-Driven Security Assessment of Power Grids Based on Machine Learning Appr...
 
Phasor State Estimation Weighting Coefficients for AC and Hybrid Networks wit...
Phasor State Estimation Weighting Coefficients for AC and Hybrid Networks wit...Phasor State Estimation Weighting Coefficients for AC and Hybrid Networks wit...
Phasor State Estimation Weighting Coefficients for AC and Hybrid Networks wit...
 
CE150--Hongyi Huang
CE150--Hongyi HuangCE150--Hongyi Huang
CE150--Hongyi Huang
 
ML_ Unit 2_Part_B
ML_ Unit 2_Part_BML_ Unit 2_Part_B
ML_ Unit 2_Part_B
 

Recently uploaded

Software Engineering Methodologies (overview)
Software Engineering Methodologies (overview)Software Engineering Methodologies (overview)
Software Engineering Methodologies (overview)eniolaolutunde
 
Incoming and Outgoing Shipments in 1 STEP Using Odoo 17
Incoming and Outgoing Shipments in 1 STEP Using Odoo 17Incoming and Outgoing Shipments in 1 STEP Using Odoo 17
Incoming and Outgoing Shipments in 1 STEP Using Odoo 17Celine George
 
Class 11 Legal Studies Ch-1 Concept of State .pdf
Class 11 Legal Studies Ch-1 Concept of State .pdfClass 11 Legal Studies Ch-1 Concept of State .pdf
Class 11 Legal Studies Ch-1 Concept of State .pdfakmcokerachita
 
Sanyam Choudhary Chemistry practical.pdf
Sanyam Choudhary Chemistry practical.pdfSanyam Choudhary Chemistry practical.pdf
Sanyam Choudhary Chemistry practical.pdfsanyamsingh5019
 
Employee wellbeing at the workplace.pptx
Employee wellbeing at the workplace.pptxEmployee wellbeing at the workplace.pptx
Employee wellbeing at the workplace.pptxNirmalaLoungPoorunde1
 
KSHARA STURA .pptx---KSHARA KARMA THERAPY (CAUSTIC THERAPY)————IMP.OF KSHARA ...
KSHARA STURA .pptx---KSHARA KARMA THERAPY (CAUSTIC THERAPY)————IMP.OF KSHARA ...KSHARA STURA .pptx---KSHARA KARMA THERAPY (CAUSTIC THERAPY)————IMP.OF KSHARA ...
KSHARA STURA .pptx---KSHARA KARMA THERAPY (CAUSTIC THERAPY)————IMP.OF KSHARA ...M56BOOKSTORE PRODUCT/SERVICE
 
Alper Gobel In Media Res Media Component
Alper Gobel In Media Res Media ComponentAlper Gobel In Media Res Media Component
Alper Gobel In Media Res Media ComponentInMediaRes1
 
SOCIAL AND HISTORICAL CONTEXT - LFTVD.pptx
SOCIAL AND HISTORICAL CONTEXT - LFTVD.pptxSOCIAL AND HISTORICAL CONTEXT - LFTVD.pptx
SOCIAL AND HISTORICAL CONTEXT - LFTVD.pptxiammrhaywood
 
A Critique of the Proposed National Education Policy Reform
A Critique of the Proposed National Education Policy ReformA Critique of the Proposed National Education Policy Reform
A Critique of the Proposed National Education Policy ReformChameera Dedduwage
 
Accessible design: Minimum effort, maximum impact
Accessible design: Minimum effort, maximum impactAccessible design: Minimum effort, maximum impact
Accessible design: Minimum effort, maximum impactdawncurless
 
Crayon Activity Handout For the Crayon A
Crayon Activity Handout For the Crayon ACrayon Activity Handout For the Crayon A
Crayon Activity Handout For the Crayon AUnboundStockton
 
Introduction to ArtificiaI Intelligence in Higher Education
Introduction to ArtificiaI Intelligence in Higher EducationIntroduction to ArtificiaI Intelligence in Higher Education
Introduction to ArtificiaI Intelligence in Higher Educationpboyjonauth
 
mini mental status format.docx
mini    mental       status     format.docxmini    mental       status     format.docx
mini mental status format.docxPoojaSen20
 
“Oh GOSH! Reflecting on Hackteria's Collaborative Practices in a Global Do-It...
“Oh GOSH! Reflecting on Hackteria's Collaborative Practices in a Global Do-It...“Oh GOSH! Reflecting on Hackteria's Collaborative Practices in a Global Do-It...
“Oh GOSH! Reflecting on Hackteria's Collaborative Practices in a Global Do-It...Marc Dusseiller Dusjagr
 
Call Girls in Dwarka Mor Delhi Contact Us 9654467111
Call Girls in Dwarka Mor Delhi Contact Us 9654467111Call Girls in Dwarka Mor Delhi Contact Us 9654467111
Call Girls in Dwarka Mor Delhi Contact Us 9654467111Sapana Sha
 
call girls in Kamla Market (DELHI) 🔝 >༒9953330565🔝 genuine Escort Service 🔝✔️✔️
call girls in Kamla Market (DELHI) 🔝 >༒9953330565🔝 genuine Escort Service 🔝✔️✔️call girls in Kamla Market (DELHI) 🔝 >༒9953330565🔝 genuine Escort Service 🔝✔️✔️
call girls in Kamla Market (DELHI) 🔝 >༒9953330565🔝 genuine Escort Service 🔝✔️✔️9953056974 Low Rate Call Girls In Saket, Delhi NCR
 
The basics of sentences session 2pptx copy.pptx
The basics of sentences session 2pptx copy.pptxThe basics of sentences session 2pptx copy.pptx
The basics of sentences session 2pptx copy.pptxheathfieldcps1
 
_Math 4-Q4 Week 5.pptx Steps in Collecting Data
_Math 4-Q4 Week 5.pptx Steps in Collecting Data_Math 4-Q4 Week 5.pptx Steps in Collecting Data
_Math 4-Q4 Week 5.pptx Steps in Collecting DataJhengPantaleon
 

Recently uploaded (20)

Software Engineering Methodologies (overview)
Software Engineering Methodologies (overview)Software Engineering Methodologies (overview)
Software Engineering Methodologies (overview)
 
Incoming and Outgoing Shipments in 1 STEP Using Odoo 17
Incoming and Outgoing Shipments in 1 STEP Using Odoo 17Incoming and Outgoing Shipments in 1 STEP Using Odoo 17
Incoming and Outgoing Shipments in 1 STEP Using Odoo 17
 
Class 11 Legal Studies Ch-1 Concept of State .pdf
Class 11 Legal Studies Ch-1 Concept of State .pdfClass 11 Legal Studies Ch-1 Concept of State .pdf
Class 11 Legal Studies Ch-1 Concept of State .pdf
 
Sanyam Choudhary Chemistry practical.pdf
Sanyam Choudhary Chemistry practical.pdfSanyam Choudhary Chemistry practical.pdf
Sanyam Choudhary Chemistry practical.pdf
 
Employee wellbeing at the workplace.pptx
Employee wellbeing at the workplace.pptxEmployee wellbeing at the workplace.pptx
Employee wellbeing at the workplace.pptx
 
KSHARA STURA .pptx---KSHARA KARMA THERAPY (CAUSTIC THERAPY)————IMP.OF KSHARA ...
KSHARA STURA .pptx---KSHARA KARMA THERAPY (CAUSTIC THERAPY)————IMP.OF KSHARA ...KSHARA STURA .pptx---KSHARA KARMA THERAPY (CAUSTIC THERAPY)————IMP.OF KSHARA ...
KSHARA STURA .pptx---KSHARA KARMA THERAPY (CAUSTIC THERAPY)————IMP.OF KSHARA ...
 
Alper Gobel In Media Res Media Component
Alper Gobel In Media Res Media ComponentAlper Gobel In Media Res Media Component
Alper Gobel In Media Res Media Component
 
Código Creativo y Arte de Software | Unidad 1
Código Creativo y Arte de Software | Unidad 1Código Creativo y Arte de Software | Unidad 1
Código Creativo y Arte de Software | Unidad 1
 
SOCIAL AND HISTORICAL CONTEXT - LFTVD.pptx
SOCIAL AND HISTORICAL CONTEXT - LFTVD.pptxSOCIAL AND HISTORICAL CONTEXT - LFTVD.pptx
SOCIAL AND HISTORICAL CONTEXT - LFTVD.pptx
 
A Critique of the Proposed National Education Policy Reform
A Critique of the Proposed National Education Policy ReformA Critique of the Proposed National Education Policy Reform
A Critique of the Proposed National Education Policy Reform
 
Accessible design: Minimum effort, maximum impact
Accessible design: Minimum effort, maximum impactAccessible design: Minimum effort, maximum impact
Accessible design: Minimum effort, maximum impact
 
Crayon Activity Handout For the Crayon A
Crayon Activity Handout For the Crayon ACrayon Activity Handout For the Crayon A
Crayon Activity Handout For the Crayon A
 
Introduction to ArtificiaI Intelligence in Higher Education
Introduction to ArtificiaI Intelligence in Higher EducationIntroduction to ArtificiaI Intelligence in Higher Education
Introduction to ArtificiaI Intelligence in Higher Education
 
mini mental status format.docx
mini    mental       status     format.docxmini    mental       status     format.docx
mini mental status format.docx
 
“Oh GOSH! Reflecting on Hackteria's Collaborative Practices in a Global Do-It...
“Oh GOSH! Reflecting on Hackteria's Collaborative Practices in a Global Do-It...“Oh GOSH! Reflecting on Hackteria's Collaborative Practices in a Global Do-It...
“Oh GOSH! Reflecting on Hackteria's Collaborative Practices in a Global Do-It...
 
Call Girls in Dwarka Mor Delhi Contact Us 9654467111
Call Girls in Dwarka Mor Delhi Contact Us 9654467111Call Girls in Dwarka Mor Delhi Contact Us 9654467111
Call Girls in Dwarka Mor Delhi Contact Us 9654467111
 
Model Call Girl in Tilak Nagar Delhi reach out to us at 🔝9953056974🔝
Model Call Girl in Tilak Nagar Delhi reach out to us at 🔝9953056974🔝Model Call Girl in Tilak Nagar Delhi reach out to us at 🔝9953056974🔝
Model Call Girl in Tilak Nagar Delhi reach out to us at 🔝9953056974🔝
 
call girls in Kamla Market (DELHI) 🔝 >༒9953330565🔝 genuine Escort Service 🔝✔️✔️
call girls in Kamla Market (DELHI) 🔝 >༒9953330565🔝 genuine Escort Service 🔝✔️✔️call girls in Kamla Market (DELHI) 🔝 >༒9953330565🔝 genuine Escort Service 🔝✔️✔️
call girls in Kamla Market (DELHI) 🔝 >༒9953330565🔝 genuine Escort Service 🔝✔️✔️
 
The basics of sentences session 2pptx copy.pptx
The basics of sentences session 2pptx copy.pptxThe basics of sentences session 2pptx copy.pptx
The basics of sentences session 2pptx copy.pptx
 
_Math 4-Q4 Week 5.pptx Steps in Collecting Data
_Math 4-Q4 Week 5.pptx Steps in Collecting Data_Math 4-Q4 Week 5.pptx Steps in Collecting Data
_Math 4-Q4 Week 5.pptx Steps in Collecting Data
 

Time series analysis use E-views programer

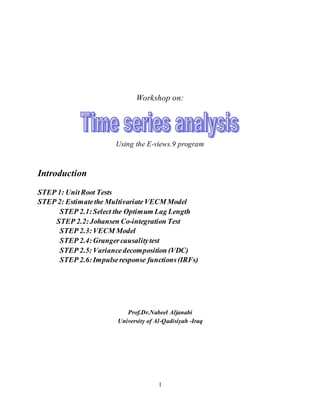
  • 1. 1 Workshop on: Using the E-views.9 program Introduction STEP 1: UnitRoot Tests STEP 2: Estimatethe MultivariateVECM Model STEP 2.1:Select the Optimum Lag Length STEP 2.2:Johansen Co-integration Test STEP 2.3:VECM Model STEP 2.4:Grangercausalitytest STEP 2.5:Variancedecomposition (VDC) STEP 2.6:Impulseresponse functions(IRFs) Prof.Dr.Nabeel Aljanabi University of Al-Qadisiyah -Iraq
  • 2. 2 Introduction This workshop explains the steps to carry out Unit Root tests, Johansen co-integration test, Granger Causality, variance decomposition and Impulse response functions. This example analyzes the importance of the monetary policy and its transmission mechanism in the fast-growing Bahrain economy. The monetary model is: M3 = f(Y, R, P) (1) where M3 is money supply; Y is oil production index, R is Interest Rate, and P is Consumer Price Index (CPI). The data file is covering from 1980M1 to 2008:M12.
  • 3. 3 Year M3 R P Y 1980M1 26281.8 3.49 46.1 12.54 1980M2 27301 3.59 46.21 12.61 1980M3 27926 3.66 46.28 13.22 1980M4 28721.9 3.75 46.13 13.56 1980M5 29483 4.1 46.49 13.72 1980M6 30130 4.17 46.86 12.93 1980M7 30747.6 4.14 47.36 14.06 1980M8 31157.6 4.14 47.78 13.29 1980M9 30864 4.26 47.62 13.95 1980M10 31272.7 4.33 47.89 13.83 1980M11 31906.4 4.47 48.54 13.56 1980M12 32687.6 4.46 48.94 13.39 1981M1 34458.1 4.42 49.78 13.06 : : : : : : : : : : : : : : : 2008M9 912780 3.56 114.73 105.04 2008M10 900443 3.55 114.23 104.35 2008M11 909231 3.38 112.93 100.38 2008M12 931656 3.02 111.83 95.92 1. Open E-view 9 – File – New -- Work file
  • 4. 4 2. Choose the frequency as Monthly – from 1980 M1 to 2008 M12 and then Click “OK” 3. Click the button “Quick” and “Empty Group (Edit Series)” Place your cursor to the left of the first row (obs)
  • 5. 5 4. Copy the original data from Excel file. 5. Paste the data to E-view worksheet
  • 6. 6 6. Transform the variables into logarithm from [Type the following generate (genr) command]: genr lm3 = log(m3) genr lp = log(p) genr lr = log(r) genr ly = log(y) STEP 1: UnitRoot Tests
  • 7. 7 7. Checking for Unit Root – For example: lm3. Double click on “lm3”, click “View” and choose the Unit Root Test. 8. We can choose Augmented Dickey Fuller (ADF) test and the optimal lag length is selected by Akaike Information Criteria (large sample size). i) First, we perform the unit root test of “lm3”: level model with constant but without trend model (let say the maximum lag is 16) . ii) Second, we perform the Unit root test again for the level model but now with constant with trend model.
  • 8. 8 E-view Output for level Unit Root Test: Constant without Trend Model: Null Hypothesis:LM3 has a unit root Exogenous: Constant Lag Length: 16 (Automatic based on AIC, MAXLAG=16) t-Statistic Prob.* Augmented Dickey-Fuller test statistic -1.166712 0.6897 Test critical values: 1% level -3.449917 5% level -2.870057 10% level -2.571377 *MacKinnon (1996) one-sided p-values. Constant with Trend Model: Null Hypothesis:LM3 has a unit root Exogenous: Constant, Linear Trend Lag Length: 15 (Automatic based on AIC, MAXLAG=16) t-Statistic Prob.* Augmented Dickey-Fuller test statistic -1.559270 0.8069 Test critical values: 1% level -3.985941 5% level -3.423418 10% level -3.134664 *MacKinnon (1996) one-sided p-values. After that, we estimate the first difference with and without trend models (repeat the same process but now select 1st difference).
  • 9. 9 E-view Output for First Different Unit Root Test: Constant without Trend Model: Null Hypothesis:D(LM3) has a unit root Exogenous: Constant Lag Length: 14 (Automatic based on AIC, MAXLAG=16) t-Statistic Prob.* Augmented Dickey-Fuller test statistic -2.865942 0.0505 Test critical values: 1% level -3.449857 5% level -2.870031 10% level -2.571363 *MacKinnon (1996) one-sided p-values. Constant with Trend Model: Null Hypothesis:D(LM3) has a unit root Exogenous: Constant, Linear Trend Lag Length: 15 (Automatic based on AIC, MAXLAG=16) t-Statistic Prob.* Augmented Dickey-Fuller test statistic -3.051348 0.1200 Test critical values: 1% level -3.986026 5% level -3.423459 10% level -3.134688 *MacKinnon (1996) one-sided p-values. 9. We also can perform another unit root test namely Phillips-Perron (PP) test. E-views Output:
  • 10. 10 i. Level, Constant Without Trend Null Hypothesis:LM3 has a unit root Exogenous:Constant Bandwidth:9 (Newey-Westusing Bartlett kernel) Adj. t-Stat Prob.* Phillips-Perron teststatistic -2.469495 0.1239 Test critical values: 1% level -3.448998 5% level -2.869653 10% level -2.571161 *MacKinnon (1996) one-sided p-values. ii. Level, Constant With Trend Null Hypothesis:LM3 has a unit root Exogenous:Constant,Linear Trend Bandwidth:9 (Newey-Westusing Bartlett kernel) Adj. t-Stat Prob.* Phillips-Perron teststatistic -1.041872 0.9355 Test critical values: 1% level -3.984726 5% level -3.422828 10% level -3.134315 *MacKinnon (1996) one-sided p-values. iii. First Difference, Constant Without Trend Null Hypothesis:D(LM3) has a unit root Exogenous:Constant Bandwidth:9 (Newey-Westusing Bartlett kernel) Adj. t-Stat Prob.* Phillips-Perron teststatistic -16.62462 0.0000 Test critical values: 1% level -3.449053 5% level -2.869677 10% level -2.571174 *MacKinnon (1996) one-sided p-values. iv. First Difference, Constant With Trend Null Hypothesis:D(LM3) has a unit root
  • 11. 11 Exogenous:Constant,Linear Trend Bandwidth:8 (Newey-Westusing Bartlett kernel) Adj. t-Stat Prob.* Phillips-Perron teststatistic -16.73624 0.0000 Test critical values: 1% level -3.984804 5% level -3.422865 10% level -3.134337 *MacKinnon (1996) one-sided p-values. Table 1 below presents the results of Unit Root Tests: Table 1 Unit Root Tests Augmented Dickey Fuller (ADF) Phillips Perron (PP) Level Variable Constant Without Trend Constant With Trend Constant Without Trend Constant With Trend LM3 -1.1667 (16) -1.5593 (15) -2.4695 [9] -1.0419 [9] LP LR LY First Difference LM3 -2.866** (14) -3.0513 (15) -16.6246*** [9] -16.7362*** [8] LP LR LY Note: *** and ** denotes significant at 1%, and 5% significance level, respectively. The figure in parenthesis (…) represents optimum lag length selected based on Akaike Info Critirion. The figure in bracket […] represents the Bandwidth used in the KPSS test selected based on Newey-West Bandwidth critirion. Please complete the above results of Unit Root Tests STEP 2: Estimatethe MultivariateVECM Model
  • 12. 12 10. After testing the variables are stationary at first order or I(1), then the step is to estimate the Vector Error-correction Model (VECM). Firstly, we need to select an optimum lag of VECM model before performing the Johansen cointegration test. (You should show all the four log variables). Then click “Quick” – “Estimate VAR” – “Vector Error Correction”
  • 13. 13 11. From equation (1), the VECM model can be written as: ∆𝐿𝑀31𝑡 = 𝜇1𝑡 − ∅1(𝐿𝑀3− 𝛾0 − 𝛾1 𝐿𝑌 − 𝛾2 𝐿𝑅 − 𝛾3 𝐿𝑃) 𝑡−1 + ∑ 𝛽1,𝑗 ∆𝐿𝑀31𝑡−𝑖 𝑗 𝑖=1 + ∑ 𝛽2,𝑗 ∆𝐿𝑌1𝑡−𝑖 + ∑ 𝛽3,𝑗 ∆𝐿𝑅1𝑡−𝑖 + ∑ ∆𝐿𝑃1𝑡−𝑖 + 𝜀1𝑡 𝑗 𝑖=1 𝑗 𝑖=1 𝑗 𝑖=1 (2) ∆𝐿𝑌2𝑡 = 𝜇2𝑡 − ∅2 (𝐿𝑀3 − 𝛾0 − 𝛾1 𝐿𝑌 − 𝛾2 𝐿𝑅 − 𝛾3 𝐿𝑃) 𝑡−1 + ∑ ∆𝐿𝑀32𝑡−𝑖 𝑗 𝑖=1 + ∑ ∆𝐿𝑌2𝑡−𝑖 + ∑ ∆𝐿𝑅2𝑡−𝑖 + ∑ ∆𝐿𝑃2𝑡−𝑖 + 𝜀2𝑡 𝑗 𝑖=1 𝑗 𝑖=1 𝑗 𝑖=1 (3) ∆𝐿𝑅3𝑡 = 𝜇3𝑡 − ∅3(𝐿𝑀3 − 𝛾0 − 𝛾1 𝐿𝑌 − 𝛾2 𝐿𝑅 − 𝛾3 𝐿𝑃) 𝑡−1 + ∑ ∆𝐿𝑀33𝑡−𝑖 𝑗 𝑖=1 + ∑ ∆𝐿𝑌3𝑡−𝑖 + ∑ ∆𝐿𝑅3𝑡−𝑖 + ∑ ∆𝐿𝑃3𝑡−𝑖 + 𝜀3𝑡 𝑗 𝑖=1 𝑗 𝑖=1 𝑗 𝑖=1 (4) ∆𝐿𝑃4𝑡 = 𝜇4𝑡 − ∅4(𝐿𝑀3− 𝛾0 − 𝛾1 𝐿𝑌 − 𝛾2 𝐿𝑅 − 𝛾3 𝐿𝑃) 𝑡−1 + ∑ ∆𝐿𝑀34𝑡−𝑖 𝑗 𝑖=1 + ∑ ∆𝐿𝑌4𝑡−𝑖 + ∑ ∆𝐿𝑅4𝑡−𝑖 + ∑ ∆𝐿𝑃4𝑡−𝑖 + 𝜀4𝑡 𝑗 𝑖=1 𝑗 𝑖=1 𝑗 𝑖=1 (5)
  • 14. 14 STEP 2.1: Select the Optimum Lag Length (a) First, we estimate the VECM model with lag 1 (b) Make residuals for the VECM models, click “Proc” – “Make Residuals” EViews will show 4 residuals in the EViews Workfile – resid01 (residual in Equation 1), resid02 (residual in Equation 2), resid03 (residual in Equation 3), and resid04 (residual in Equation 4). Type in all variables with lm3 first (dependent variable) LM3 LY LR LP Change 2 to 1
  • 15. 15 (c) Now, the autocorrelation of the error terms in each regression is checked by using the Ljung-Box Q-statistic. We double click the “resid01” – “View” – “Correlogram…” – “OK”
  • 16. 16 E-Views Output: The Q-statistic shows that the error terms are statistically significant from lag 12 for “resid01”. This indicates that the model with lag 1 has autocorrelation problem. Hence, we need to re-estimate the VECM model by increasing one lag (repeat the same process but now with lag 2). This process will continue until each of the regression error terms is free from autocorrelation problem (where the p-values of Q-statistic are greater than 0.05). In this case, we repeat the same process and the optimum lag is 12. The p-value is less than 0.05. This implies that the regression residuals have autocorrelation problem.
  • 17. 17 12. The E-Views output with 12 lag is as follows: STEP 2.2:Johansen Co-integration Test 13. After obtaining the optimum lag, the next step is to estimate the Johansen Co-integration Test. Click “View” – “Co-integration Test” – “OK”. Error correction terms (ECT) Long-run Equation
  • 18. 18 E-Views Output: Sample (adjusted):1981M02 2008M12 Included observations:335 after adjustments Trend assumption:Linear deterministic trend Series:LM3 LP LR LY Lags interval (in first differences):1 to 12 Unrestricted Cointegration Rank Test(Trace) Hypothesized Trace 0.05 No. of CE(s) Eigenvalue Statistic Critical Value Prob.** None * 0.088734 51.98841 47.85613 0.0194 At most 1 0.043366 20.86000 29.79707 0.3664 At most 2 0.014884 6.007864 15.49471 0.6946 At most 3 0.002934 0.984286 3.841466 0.3211 Trace test indicates 1 cointegrating eqn(s) atthe 0.05 level * denotes rejection ofthe hypothesis at the 0.05 level **MacKinnon-Haug-Michelis (1999) p-values Unrestricted Cointegration Rank Test(Maximum Eigenvalue) Hypothesized Max-Eigen 0.05 No. of CE(s) Eigenvalue Statistic Critical Value Prob.** None * 0.088734 31.12841 27.58434 0.0168 At most 1 0.043366 14.85214 21.13162 0.2994 At most 2 0.014884 5.023578 14.26460 0.7388 At most 3 0.002934 0.984286 3.841466 0.3211 0.05 represent 5% significance level.
  • 19. 19 Max-eigenvalue test indicates 1 co-integrating eqn(s) atthe 0.05 level * denotes rejection ofthe hypothesis at the 0.05 level **MacKinnon-Haug-Michelis (1999) p-values Table 2 presents the Johansen-Juselius Co-integration test. The result shows that both Trace test and Max-Eigen test are statistically significant to reject the null hypothesis of r = 0 at 5% significance level. Therefore, only one long run co-integration relationship between M3 and it determinants. Table 2: Johansen-Juselius Co-integration Tests Hypothesized Trace Max-Eigen Critical Values (5%) No. of CE(s) Statistic Statistic Trace Max-Eigen r = 0 51.9884** 31.1284** 47.856 27.584 r ≤ 1 20.860 14.852 29.797 21.132 r ≤ 2 6.0078 5.0235 15.495 14.265 r ≤ 3 0.9843 0.9843 3.8415 3.8415 Note: ** denotes significant at 5% significance levels. STEP 2.3:VECM Model If the model contains co-integration relationship among the variables, then we can proceed to VECM and the long run equation is: LM3t-1 = - 5.0146 + 3.6031 LPt-1 + 0.2233 LRt-1+ 0.3357 LYt-1 s.e (0.2872) (0.0494) (0.0946) t-stat [12.5459] [4.5212] [3.5477] All variables are positively significant at 5% significance level. You can write this equation by referring to page 15 (but the coefficient signs are now reversed, why?)
  • 20. 20 STEP 2.4: Grangercausalitytest 14. After estimating the long-run VECM model, then we proceed to the short run Granger causality test. Click “View” – “Lag Structure” – “Granger Causality/Block Exogeneity Tests”. E-Views Output: VEC Granger Causality/Block Exogeneity Wald Tests Sample:1980M01 2008M12 Included observations:335 Dependentvariable:D(LM3) Excluded Chi-sq df Prob. D(LP) 30.22932 12 0.0026 D(LR) 14.72288 12 0.2569 D(LY) 21.50639 12 0.0434 All 67.21100 36 0.0012
  • 21. 21 Dependentvariable:D(LP) Excluded Chi-sq df Prob. D(LM3) 23.98443 12 0.0204 D(LR) 23.39792 12 0.0245 D(LY) 23.92561 12 0.0208 All 63.26058 36 0.0033 Dependentvariable:D(LR) Excluded Chi-sq df Prob. D(LM3) 15.82326 12 0.1995 D(LP) 12.32216 12 0.4202 D(LY) 13.98317 12 0.3018 All 36.82666 36 0.4305 Dependentvariable:D(LY) Excluded Chi-sq df Prob. D(LM3) 17.93616 12 0.1176 D(LP) 16.41443 12 0.1730 D(LR) 10.79759 12 0.5463 All 48.57377 36 0.0786 With Co-integration, the dynamic causal interactions among the variables should be phrased in a vector error correction form. This allows us to assess both long-run and short-run causality, respectively, on the 2  -test of the lagged first differenced terms for each right-hand-side variable and the t-test of the error correction term. The results of the test are presented in Table 3.
  • 22. 22 Table 3: Granger Causality Results based on VECM Independent Variables Dependent 2  -statistics of lagged 1st differenced term [p-value] ECTt-1 coefficient Variable ΔLM3 ΔLP ΔLR ΔLY (t-ratio) ΔLM3 -- 30.23*** [0.003] 14.72 [0.257] 21.51** [0.043] -0.028** (-3.533) ΔLP 23.98** [0.020] -- 23.39** [0.024] 23.93** [0.021] 0.009** (2.800) ΔLR 15.82 [0.199] 12.32 [0.420] -- 13.98 [0.302] 0.124 (1.947) ΔLY 17.93 [0.118] 16.41 [0.173] 10.79 [0.546] -- 0.093 (2.052) Note: *** and ** denotessignificant at 1% and 5% significance level, respectively.The figure in the parenthesis(…) denote as t-statistic and the figure in the squared brackets […] represent as p-value. and the causal channels can be summarized as below: LM3 LP LY LR
  • 23. 23 STEP 2.5: Variancedecomposition (VDC) 15. The result of VECM indicates the erogeneity or endogeneity of a variable in the system and the direction of Granger-causality within the sample period. However, it does not provide us with the dynamic properties of the system. The analysis of the dynamic interactions among the variables in the post-sample period is conducted through variance decompositions (VDCs) and impulse response functions (IRFs). E-Views Output: Variance Decomposition of LM3: Period S.E. LM3 LP LR LY 1 0.009207 100.0000 0.000000 0.000000 0.000000 2 0.012581 99.59571 0.237534 7.15E-06 0.166753 3 0.015458 99.50123 0.242707 0.022763 0.233302 4 0.018050 98.21271 0.478537 0.134646 1.174103 5 0.020777 94.57704 1.376087 1.117796 2.929073 6 0.023737 91.01041 2.386103 1.674290 4.929200 7 0.026313 88.11711 2.976382 2.326990 6.579520 8 0.028367 84.90036 3.376980 2.783734 8.938924 9 0.030475 81.38129 2.986563 3.496885 12.13526 10 0.032785 76.88578 2.630474 4.784743 15.69901 Variance Decomposition of LP: Period S.E. LM3 LP LR LY Click “View” – “Variance Decompositions” – “Table”
  • 24. 24 1 0.003904 0.057833 99.94217 0.000000 0.000000 2 0.006102 0.232518 99.30812 0.034317 0.425045 3 0.007787 0.493569 99.04644 0.076551 0.383441 4 0.009032 0.723986 98.88313 0.067843 0.325045 5 0.010067 1.013711 98.49578 0.206479 0.284028 6 0.010816 2.379293 96.86372 0.504991 0.251992 7 0.011544 4.710690 94.19444 0.867165 0.227708 8 0.012314 6.518148 91.82371 1.438480 0.219661 9 0.012968 7.566270 90.49069 1.743578 0.199466 10 0.013545 8.302143 89.10389 2.390148 0.203815 Variance Decomposition of LR: Period S.E. LM3 LP LR LY 1 0.072920 2.995915 0.019765 96.98432 0.000000 2 0.111546 3.619142 0.098381 96.28206 0.000418 3 0.139640 4.349874 0.076814 95.55480 0.018517 4 0.161746 4.672351 0.223168 95.05622 0.048258 5 0.176165 5.039088 0.224267 94.69537 0.041277 6 0.191569 5.355593 0.193439 94.34811 0.102858 7 0.208351 4.742339 0.306652 94.75085 0.200158 8 0.222819 4.361189 0.434910 94.95968 0.244217 9 0.236249 3.960742 0.732402 94.78659 0.520266 10 0.251486 3.503003 0.914070 94.85731 0.725617 Variance Decomposition of LY: Period S.E. LM3 LP LR LY 1 0.051559 0.724280 0.570742 0.577937 98.12704 2 0.060572 0.608491 0.768220 0.439926 98.18336 3 0.072073 0.473792 1.096219 0.640465 97.78952 4 0.082283 1.219285 1.277598 0.572537 96.93058 5 0.089036 1.136213 1.872747 0.548866 96.44217 6 0.094439 1.235009 1.895860 0.577269 96.29186 7 0.098761 1.619555 2.445372 0.530370 95.40470 8 0.104042 2.296307 4.431683 0.639905 92.63211 9 0.108643 2.798176 4.585921 1.005189 91.61071 10 0.112538 3.291952 5.643364 1.336476 89.72821 Cholesky Ordering: LM3 LP LR LY
  • 25. 25 STEP 2.6: Impulseresponse functions(IRFs) 16. Estimate the impulse response functions (IRFs), click “Estimate” and change the “Vector Error Correction” to “Unrestricted VAR” and increase one more lag for the model from lag 12 to lag 13. Select “Impulse”
  • 26. 26 -.010 -.005 .000 .005 .010 .015 1 2 3 4 5 6 7 8 9 10 Response of LM3 to LM3 -.010 -.005 .000 .005 .010 .015 1 2 3 4 5 6 7 8 9 10 Response of LM3 to LP -.010 -.005 .000 .005 .010 .015 1 2 3 4 5 6 7 8 9 10 Response of LM3 to LR -.010 -.005 .000 .005 .010 .015 1 2 3 4 5 6 7 8 9 10 Response of LM3 to LY -.002 .000 .002 .004 .006 1 2 3 4 5 6 7 8 9 10 Response of LP to LM3 -.002 .000 .002 .004 .006 1 2 3 4 5 6 7 8 9 10 Response of LP to LP -.002 .000 .002 .004 .006 1 2 3 4 5 6 7 8 9 10 Response of LP to LR -.002 .000 .002 .004 .006 1 2 3 4 5 6 7 8 9 10 Response of LP to LY -.04 .00 .04 .08 .12 1 2 3 4 5 6 7 8 9 10 Response of LR to LM3 -.04 .00 .04 .08 .12 1 2 3 4 5 6 7 8 9 10 Response of LR to LP -.04 .00 .04 .08 .12 1 2 3 4 5 6 7 8 9 10 Response of LR to LR -.04 .00 .04 .08 .12 1 2 3 4 5 6 7 8 9 10 Response of LR to LY -.04 -.02 .00 .02 .04 .06 1 2 3 4 5 6 7 8 9 10 Response of LY to LM3 -.04 -.02 .00 .02 .04 .06 1 2 3 4 5 6 7 8 9 10 Response of LY to LP -.04 -.02 .00 .02 .04 .06 1 2 3 4 5 6 7 8 9 10 Response of LY to LR -.04 -.02 .00 .02 .04 .06 1 2 3 4 5 6 7 8 9 10 Response of LY to LY Response to Cholesky One S.D. Innovations ± 2 S.E.