1. Preservation of Rent Restricted
Affordable Housing in Oregon
1. Discuss the “little p” preservation challenge
2. What we can do as project sponsors
3. Systems changes
Information based on HDC’s Work with:
• Streamlining Compliance (Ongoing)
• Restructuring of Properties in Oregon
• City of Portland Portfolio Review (Financial and Tenant) (2010)
Also informed by:
• Portfolio repositioning work in Washington, Idaho, Colorado and California
• King County Portfolio Review (2008)
• City of Seattle Capital Needs Assessment (2009)
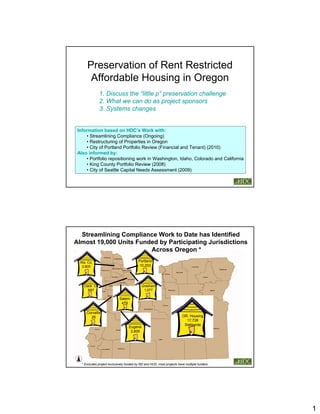
Streamlining Compliance Work to Date has Identified
Almost 19,000 Units Funded by Participating Jurisdictions
Across Oregon *
Wa. Co. Portland
2,605 10,293
Clack. Co Gresham
897 1,077
Salem
479
Corvallis
28 OR. Housing
17,728
Statewide
Eugene
2,605
* Excludes project exclusively funded by RD and HUD, most projects have multiple funders
1
2. Key Challenges
• Financial Performance
– Different from Section 8 & RD Preservation
because of rent subsidy & level of debt
• Physical Condition
– Portfolio aging
– Construction defects (moisture problems)
– Inadequate reserves
• Low Income Housing Tax Credit Year 15
FINANCIAL RISK:
1 OHCS
1 Analysis of Income & Expense: 2008
2 2008 AIES Cash Flow Per Unit Spread: By Region
Region 1 Region 2 Region 3 Region 4 Region 5
5 Maximum $ 2,940 $ 4,081 $ 3,262 $ 1,551 $ 1,476
4 Average $ 509 $ 218 $ 293 $ 185 $ 174
3 Minimum $ (3,937) $ (2,517) $ (1,674) $ (1,841) $ (1,550)
# of Projects
137 79 33 30 28
Reporting
% of Projects Reporting Cash Deficits: By Region
50%
45%
40%
35%
30%
25%
20%
15%
10%
5%
0%
Region 1 Region 2 Region 3 Region 4 Region 5
22.7% 41.8% 27.3% 43.3% 32.1%
2
3. National & Regional Trends
• NeighborWorks America TM Multifamily Initiative tracks 45,000
plus units across the country, and consistently reports about 30%
of projects having negative cashflow
• King County Study of 13,000+ units:
King County Portfolio Review 2009*
Average Net Cash Flow Per Unit
(2006 data) $168.37
Number of projects with annual cash flow of:
Zero or Negative Cash Flow 80 42%
Less than $50 PUPA 10 5%
$51-$250 PUPA 17 9%
$251-500 PUPA 21 11%
$501-1,000 PUPA 32 17%
Over $1,000 PUPA 29 15%
Total Projects in Sample 189
* Study Completed by HDC and Impact Capital
LIHTC Year 15 Projects in Oregon
2010 1,453 Units
2011 813 Units
Planning Needed for Future Years
Riverview Apartments Reaching Year 15 in 2010
Musolf Manor Rehab @ Year 15
Completed 2009
Lancaster Bridge Completing Year 15 in 2010
3
4. Physical Property Condition:
Aging Portfolios
City of Portland Portfolio
4500
4000
3500
Number of Units
3000
2500
2000
1500
1000
500
0
Less than 5 Years 5 to 10 Years 10 - 15 Years 15 Years Plus Unknow n Placed in
Service Date
Years Since Most Recent Placed in Service*
* PHB Tracks Placed in Service by Most Recent Restructure or Financing
Lifecycles for Major Building
Systems:
• 30+ years:
– Gas lines
– Plumbing and sanitation The 5 – 7 Year
– Electrical distribution
Replacement Items
• 20-30 years: Smoke detectors
– Roof, gutters, chimneys Garbage disposal
– Kitchen cabinets, counters, fixtures Carpet
– Bath cabinets, counters, fixtures Exterior lighting
– Hot water tanks Storm doors
– Heating systems Seal coat asphalt
– Siding, flashing, sealants Public bathroom
– Windows, doors accessories
• 15 years:
– Large appliances
– Exterior lighting
– Exterior painting
The examples above are based on the useful life estimates provided in Seattle Office of Housing’s capital needs assessment form
4
5. Moisture
Problems
Envelope Failures
Site Grading, Drainage, Lack of Clearance
Inadequate heating & ventilation
= Mold, mold, mold
Focusing only on
individual Project
- Capital
nonperforming improvements,
- Financial repositioning
projects can be a
bit like looking only Portfolio
-Benchmarks
at the tip of the - Data/ Information Management
iceburg - Planning
Organization
- Mission
- Roles
- Systems
- Communication
Systems Change
- Policy Work
- Advocacy
5
6. As project sponsors, We are working at
& public & private multiple levels to
funders… Project preserve
- Capital
improvements, affordable housing.
- Financial repositioning
Portfolio
- Oversight of Operations
- Annual Capital Budgeting
- Long Term Capital Needs Planning
Organization
- Board Oversight
- Adequate & trained Staff
- Information systems
- Integration of development & asset management
Systems Change
- Underwriting for the long term
- Streamlining Compliance
- Policy support for recapitalization & refinance
- Resource development
What We Can Do as Owners:
During Development:
• Realistic rent & operating
assumptions
• Right size debt payments for
long term
• 30 year rehab and/or adequate
reserves
During Operations:
• Energy & water conservation
measures • Focus on project revenues
• Quality construction: design, • Ensure maintenance value for
the dollar
specifications, materials, quality
• Monitor & maintain physical
control condition
– Regular inspections
– Capital Needs
Assessments
• Long term portfolio planning
6
7. During Development
Factors Impacting Maintenance Costs
HIGH COSTS LOW COSTS
Large Units Small Units
Elevators No Elevator
Lots of landscape Limited landscape
Older building New building =
honeymoon
Small bldgs = High Ratio Large Buildings
of exterior envelope
to Interior Space
Hard to House Population Senior
Amount of Turnover Stable tenancy
(senior)
Far from PM office Close to PM Office
Underwriting for True Operating & Capital Costs:
The Capital Budget vs. the Operating Budget
Capital Operating
Siding
Windows & Doors Interior Paint
Appliances
Roofing & Gutters Smoke detectors
Cabinets Exterior Paint Light fixtures
Countertops Turnover cleaning
Carpet
Water heaters Cadet heaters
replacement
Tubs Drywall repair
Elevator Elevator Landscaping
Sheet flooring maintenance Finish carpentry
Gas furnace Low voltage electrical
Lighting
Water, sewer lines Bath accessories
Bike racks Mini Blinds Fire extinguishers
Play equipment
Sidewalks and paving
Items in the middle are either buried in maintenance expenses
or come out of net cash flow.
7
8. Figure 3
Distribution of Annual Per Unit Replacement
City of Seattle 100
90
Reserve Deposits in 2006
Study: 80
Number of Properties
70
60
RESERVE 50
40
DEPOSITS 30
20
AND 10
0
0 0 - 199 200 - 399 400 - 599 600 - 799 > 800
BALANCES Reserve Deposits per Unit
Figure 4: Cumulative Replacement Reserve Balances Tiered by
Amount
Total
$1,000 to $2,000 to
< 1,000 $3,000+ Projects/
$2,00 $3,000
per unit per unit Units in
per unit per unit
Operation
# projects 65 64 35 81 245
# units 5,016 1,709 1,231 1,533 9,454
Level of Rehab Best Predictor of
Capital Needs:
Many expected correlations weren’t there
Of projects placed in service > 5 years ago:
Partial (strategic) rehabs had needs over the next seven
years = 1.8 times than others
Figure 7: Average Capital Needs per Unit for
Sample Projects 5+ Years in Operation
$9,000
$8,000
$7,000
$6,000
$5,000
$4,000
$3,000
$2,000
$1,000
$0
Occupied (Selective) Rehab at Not Occupied Rehab (Vacant
Placed in Service Rehab or New) at Placed in
Service
8
9. During Operations:
Focus on Revenues
Example: Portfolio Annual Revenue Losses
*
Revenue Losses Across 12 Properties
Collection
Concession, Loss,
$78,713 (2%) $199,395
(5%)
Vacancy
Loss,
$312,946
(8%)
Collected
Rents,
$3,213,116
(85%)
* 559 Total Units in this Portfolio
Capital Planning for 1. Project Financial Milestones
2. Lease terms
the portfolio as a 3. Withdrawals from reserves
whole: 4. Additional capital infusions
Project Financial Milestones and CNAs
Project Name 2009 2010 2011 2012 2013
Cap
Project A Cap NA Yr 15 Infusion
Cap
Project B Infusion
End Pre
Project C Penalty
Project D
Number of Capital Needs Assess. 1 0 0 0 0
Commercial Lease Term Schedules
Project Name 2009 2010 2011 2012 2013
Project A
Project B x
x
Project B
Project G x
Project G x
Lease Terms Ending 3 0 0 1 0
9
10. Systems Change
All Properties Require Reinvestment
2008 study of private market rental properties in Seattle Area (Dupre + Scott):
The typical owner of a invested $513 per unit per year in capital
improvements
Additionally:
The average holding period for Seattle private-market apartment properties
since 2000 has been 10 to12 years. (Dupre and Scott, 2008).
When buildings change ownership, the new owners typically make
substantial investments in capital improvements. For example, buyers
invested an average of $12,000 per unit in 2007 following a building’s
change of ownership (Dupre and Scott, 2008).
These capital investments are often partially paid for through additional
private debt supported by substantial rent increases. In a sample of
buildings purchased from 1995-2005, average rent increased 15.5% within
one year following a building’s change in ownership (Dupre and Scott cited
in OH, 2007).
Dupre and Scott (2004). “The Smart Apartment Investor’s Guide to Capital Plans,” Seattle, WA: Dupre + Scott, and
Apartment Advisors, Inc. and “The Apartment Advisory,” Vol. 31, No. 1, March 2008. Seattle, WA: Dupre + Scott
Apartment Advisors, Inc.
Systems Change Work = Planning
City of Seattle Capital Needs Analysis
“Meeting the capital needs of the current generation of properties will
require a combination of strategies including:
Use of existing reserves,
Operating changes to increase reserve deposits,
Refinancing of private debt where feasible,
Tax credit re-syndication, and
Additional subsidized gap financing.
Investing in the recapitalization of key properties in OH’s portfolio is a
strategic policy choice. OH has already invested more than $286 million to
develop its portfolio, with estimated total development costs of $1.97
billion. Our estimate of additional capital needed to meet the portfolio’s
capital needs during the 2010 to 2016 period is approximately 4-7% of the
City’s initial investment, and about 1% of the portfolio’s initial development
costs.”
10
11. Together we can
preserve
critically needed
housing
Nuevo Amanecer Rehabilitation
11