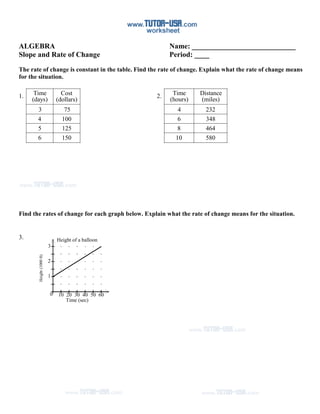
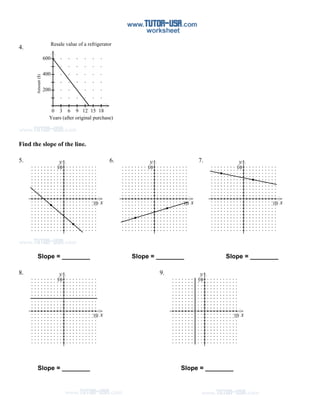
The document contains math problems about calculating rates of change from tables and graphs. It asks students to find rates of change from tables showing time and cost, time and distance, and graphs showing height over time of a balloon, resale value of a refrigerator over years. It also contains problems about finding the slope of lines from their equations and points on the lines. The rates of change and slopes indicate how quantities change in relation to other quantities over time or across other variables for the situations described.