A climatology analysis of the petrie creek catchment maroochydore australia u...
Molly Parks GSA 2
1. Introduction
Stable isotopes of oxygen (δ18O) and hydrogen (δ2H) in precipitation
can be used as tracers in the hydrologic cycle to track large-scale
atmospheric processes, and local controlling factors. In order to use
this technique in the hydrologic studies, the first step is to establish
and understand the temporal and spatial distribution and patters of
the isotopic composition of water in precipitation. Here we present
δ18O and δ2H values of precipitation from a yearlong collection at
different resolution (i.e., daily, weekly, and monthly) at the University
of Dayton in Dayton, Ohio. The isotope data from this study provide
a baseline isotope data for precipitation, and helps to identify factors
that control isotopic composition of water in precipitation (e.g.,
temperature, amount effect, seasonality, and moisture source)
through time. Furthermore, establishing the seasonal distribution of
isotopes in precipitation is extremely important to understand the
surface and groundwater interaction and quantify the amount of
seasonal recharge of aquifers (Great Miami Buried Valley Aquifer
System). In today’s climate change era, making the link and
interaction between surface water and groundwater, as well as
establishing moisture source and seasonal variability of precipitation
is critical to devise sustainable use of water resources.
Objective
• To understand seasonal variation of isotopes in precipitation
• To understand the main controlling factors of the distribution of
isotopes in precipitation
• To compare isotopic values of precipitation collected in different
resolutions and identify factors that dominantly affect daily, weekly,
and monthly collected data
• To quantify seasonal groundwater recharge
Methodology
Precipitation sampling station set up on the Raymond L. Fitz Hall
building roof top, at the University of Dayton campus, Dayton OH.
The precipitation samples were collected at daily, weekly, and
monthly intervals between March 2014 and March 2015 (n=138).
The samples were collected in a custom made containers, which
were comprised of a plastic jug and a funnel affixed to the top. We
used a heavy duty Nalgene containers of 4L, 10L, and 20L for
daily, weekly, and monthly collectors respectively.
Samples were collected and stored in caped glass vials sealed with
parafilm to prevent evaporation. Samples were analyzed at the
University of Utah SIRFER using Picarro CRDS (Cavity Ring-Down
Spectroscopy).
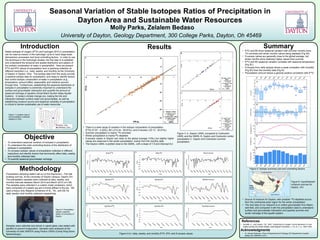
• There is a wide range of variation in the isotopic composition of precipitation
δ18O(-27.97 - 4.22‰), δD (-214.24 - 28.81‰), and D-excess (-22.13 - 20.51‰)
• Summer precipitation is mainly 18O enriched
• Winter precipitation is mainly18O depleted
• D-excess values in Dayton are close to the global average (10‰) but slightly higher
values are observed in the winter precipitation, mainly from the monthly data.
• The Dayton LMWL is plotted close to the GMWL, with a slope of 7.9 and intercept 8.2
Results Summary
Acknowledgments
• Dr. Daniel Goldman, Chair of Department of Geology UD Department of public
safety UD; SIRFER U of U.
Figure 3: A. Dayton LMWL compared to Coshocton
LMWL and the GMWL B. Dayton and Coshocton winter
precipitation C. Dayton and Coshocton summer
precipitation
A B C
D E F
G H I
Figure 4 A-I: daily, weekly, and monthly δ18O, δ2H, and D-excess values
Seasonal Variation of Stable Isotopes Ratios of Precipitation in
Dayton Area and Sustainable Water Resources
Molly Parks, Zelalem Bedaso
University of Dayton, Geology Department, 300 College Parks, Dayton, Oh 45469
Monthly Weekly Daily
Figure 1: Location map of
the precipitation collection
stations in Ohio.
Figure 2: Precipitation
sample collection
station at University of
Dayton.
• δ18O and δD show seasonal variation with summer months more
18O enriched and winter months values being depleted (Fig 5A)
• D-excess values are generally close to the global average, but
winter months show relatively higher values than summer
• δ18O and δD seasonal variation correlate with seasonal temperature
(Fig 5C)
• D-excess from daily isotope shows a weak correlation with humidity
(Fig 5D) than the monthly data (Fig 4I)
• Precipitation amount shows a general positive correlation with δ18O
• Source of moisture for Dayton, with possible 18O depleted source
from the continental polar region for the winter precipitation
• The next step of our research is to collect groundwater from Miami
well field, and compared it with the precipitation data to understand
surface and groundwater interaction and quantify summer and
winter recharge of the aquifer system.
Gulf of Mexico
Continental Polar
North
pacific
Ocean
Dayton, Ohio
Coshocton, Ohio
Figure 6: Hypothesized
moisture sources for
Dayton, OH.
Figure 5: Isotope summary plot and controlling factors
References
• Kendall, C., and Coplen, T.B., 2001. Distribution of oxygen-18 and deuterium in river
waters across the United States: Hydrological Processes, v. 15, no. 7, p. 1363-1393.
B
Dayton, Ohio
Winter
Coshocton, Ohio
GMWL
y=8.4814x+16.558
R2 =0.9934
Winter
y=3.3032x+5.0388
R2 =0.9627
A
Dayton, Ohio
Coshocton, Ohio
GMWL
y=7.9008x+8.2576
R2 =0.9832
y=7.5096x+8.8099
R2 =0.9729
C
Dayton, Ohio
Coshocton, Ohio
Summer
Summer
GMWL
y= 7.5522x+6.3356
R2 =0.9693
y= 7.3928x+7.3802
R2 =0.9665
A
B
C
E
D