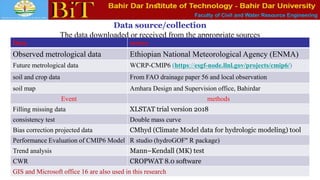
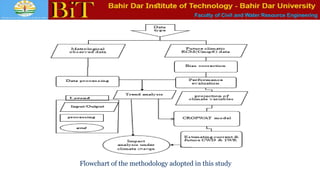
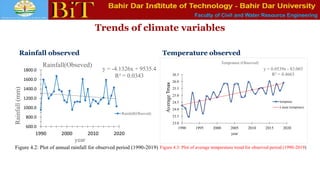
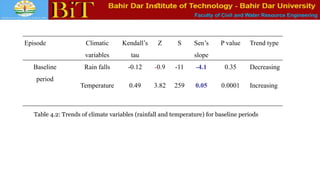
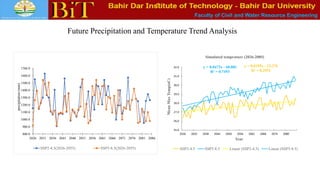
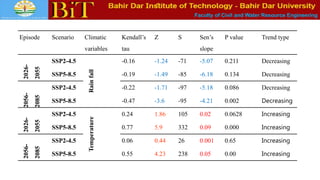
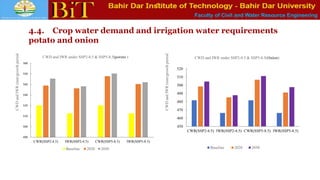
Faculty of Civil and Water Resource Engineering
BAHIR DAR UNIVERSITY
BAHIR DAR INSTITUTE OF TECHNOLOGY
SCHOOL OF RESEARCH AND GRADUATE STUDIES
FACULTY OF CIVIL AND WATER RESOURCES ENGINEERING
Department of Irrigation Engineering and Management
Research Thesis progress:
Evaluating Impacts Of Climate Change On Irrigated Agriculture
A Case Of North Gojjam Sub-basin, Blue Nile Basin, Ethiopia
By: Enyew Belayneh
Advisor: Abebech Abera (PhD) BAHIR DAR, ETHIOPIA
DECEMBER, 2023
Faculty of Civil and Water Resource Engineering
Presentation outline
 Introduction
 Statement of the problem
 Objectives
 Scope of the study
 Significance of the study
 Materials and Methods
 Result and discussion
 Conclusion
 Recommendation
Faculty of Civil and Water Resource Engineering
1. Introduction
1.1 background
 Climate change refers to a systematic change in the long-term statistics
of climate elements over several decades. By changing the average
weather conditions over time, such as rainfall, temperature, streamflow,
groundwater storage, and wind, it alters the composition of the earth’s
atmosphere (IPCC, 2007, 2014).
Faculty of Civil and Water Resource Engineering
Introduction …
 If the climate change phenomenon occurs frequently, future water
availability for crop water demand (CWD), domestic water consumption,
and agricultural production will become more uncertain. Depending on
the crop type and crop characteristics, CWD can be increased by up to
250% by the end of the twenty-first century (Gondim et al., 2012). In
developing regions, irrigation water requirement (IWR) can be increased
by 50% for each degree of global warming, while in developed regions, it
is expected to increase by 16% (Fischer et al., 2007).
Faculty of Civil and Water Resource Engineering
1.2 Statement of the problem
 Higher temperatures due to climate change will result in increased
evapotranspiration, affecting hydrological systems and agriculture. The
investigation of climate change impacts on various sectors, particularly
agriculture, is critical for decision-makers; however, most developing
countries, including Ethiopia, have not done that well.
Faculty of Civil and Water Resource Engineering
 Despite the fact that the effects of climate change and variability are particularly
devastating in the North Gojjam sub-basin, the study of climate change
impacts on crops and irrigation work due to water stress has not been yet
investigated, and also its impact at local level is not quantify rather global, In
addition to this, the majority of small scale irrigation systems, as commonly
found in developing African countries, including Ethiopia particularly in north
gojjam sub- basin directly affected by unpredictable temperature and
rainfall variations, crop water demand and irrigation water requirements
resulting in yield reduction or crop failure. In order to fill this gap, this study
was held.
Faculty of Civil and Water Resource Engineering
1.3 Research question
 How is climate change is expected to trigger changes in rainfall and temperature series?
 How alarming is the future rainfall and temperature change in the study area? Is there a
warming trend?
 What percent (%) changed in precipitation and temperatures from the baseline period?
 Will the future (rainfall and temperatures) affect the irrigation water requirement in the
study area?
 What will be the future CWD and IWR look like compared to the base line period?
Faculty of Civil and Water Resource Engineering
1.4 Objective of the study
General objective
 Assess and evaluate the impacts of climate change on irrigated agriculture.
Specific objectives
 To assess climate change trends of hydro climatic variables (rainfall and temperature)
in the Study area.
 To estimate the current and future crop water demand of selected major crops grown in
the study area under various climate change scenarios.
 To quantifying the climate change parameters (evapotranspiration, temperature &
rainfall) in the projected time period.
Faculty of Civil and Water Resource Engineering
Scope of the study
 Explores the impact of climate change on irrigated agriculture under various climate
change scenarios, in the North Gojjam Sub Basin of Abay Basin.
 Limited to predict rainfall, temperature, CWR and IWR.
Significance of the study
 It is critical for preparing and planning adaptation to climate change effects on water
resources, IWR, and agricultural sustainability.
 It is also critical for proper water management to investigate and resolve risks
associated with available irrigation water resources based on future variability in
climatic variables.
Faculty of Civil and Water Resource Engineering
Cont.…
In general, this study will assist water managers, decision-makers, and producers in
understanding the impact of climate change and planning appropriate adaptation
measures that must be implemented ahead of time.
 Further it increases the scientific community's and other stakeholders' awareness and
knowledge of the effects of climate change on water use for irrigation at the local
level
Faculty of Civil and Water Resource Engineering
2. Methodology
Description of the study area
 Geographically located between 37.3° and 39.6° E longitude and 10.8° and 11.9° N latitude
 Located on its elevation approximately between 1030 and 4090 m a.s.l and has coverage
area of 1,431,360 ha.
 The average maximum and minimum temperatures of the sub-basin range from 24.6 °C to
28.1 °C and 11.0 °C to 14.5 °C, respectively, and the mean annual temperature is 19.41 °C.
Faculty of Civil and Water Resource Engineering
Maps of the study area
Faculty of Civil and Water Resource Engineering
Data source/collection
The data downloaded or received from the appropriate sources
Data source
Observed metrological data Ethiopian National Meteorological Agency (ENMA)
Future metrological data WCRP-CMIP6 (https://esgf-node.llnl.gov/projects/cmip6/)
soil and crop data From FAO drainage paper 56 and local observation
soil map Amhara Design and Supervision office, Bahirdar
Event methods
Filling missing data XLSTAT trial version 2018
consistency test Double mass curve
Bias correction projected data CMhyd (Climate Model data for hydrologic modeling) tool
Performance Evaluation of CMIP6 Model R studio (hydroGOF" R package)
Trend analysis Mann–Kendall (MK) test
CWR CROPWAT 8.0 software
GIS and Microsoft office 16 are also used in this research
Faculty of Civil and Water Resource Engineering
CROPWAT model
Estimation of reference evapotranspiration (ETo)
Rn is the net radiation (MJ/m2/day);
G is the soil heat flux density (MJ/m2 per day);
T is the average daily air temperature at standard height(°C);
u2 is the wind speed at 2 m height (m/s);
es is the saturation vapor pressure (kPa);
FAO Penman Monteith equation ea is the actual vapor pressure (kPa);
es-ea is the saturation vapor pressure deficit (kPa);
Δ is the slope vapor pressure curve (kPa °C-1)
γ is the psychometric constant (kPa °C-1)
Faculty of Civil and Water Resource Engineering
Estimation of Crop Water
Requirement
ETc = Kc × ETo
Where
ETc is crop evapotranspiration (mm/day),
ETo is the reference crop
evapotranspiration (mm/day), and
Kc is the crop coefficient.
Estimation of Effective Rainfall
 By using USDA Soil Conservation Service
 Pe = TR × (125 − 0.2 × TR)/125
When total rainfall is > 250 mm, effective
rainfall is given as:
 Pe = 125 + 0.1 × TR
Faculty of Civil and Water Resource Engineering
Flowchart of CWR
Flowchart of CWR

Faculty of Civil and Water Resource Engineering
Flowchart of the methodology adopted in this study
Faculty of Civil and Water Resource Engineering
4 Result and discussion
 Climatic model bias correction
The climatic model bias was corrected with Delta change method
using CMhyd tool, and observed, corrected and uncorrected
values are shown in the figure below
Faculty of Civil and Water Resource Engineering
0.0
100.0
200.0
300.0
400.0
500.0
600.0
700.0
Jan
Feb
Mar
Apr
May
Jun
Jul
Aug
Sep
Oct
Nov
Dec
RF
in
mm/month
Month
Observed
Corrected
Uncorrected
a)
0.0
5.0
10.0
15.0
20.0
25.0
30.0
Tmax(oC)
Month
Obseved Tmax
Corrected
Uncorrected
b)
Figure. 4.1: Observed, corrected, and uncorrected rainfall (a) Figure. 4.1: Observed, corrected, and uncorrected Tmax (b)
Faculty of Civil and Water Resource Engineering
 The difference between the uncorrected and observed mean
climate variables is significant.
 After bias adjustments, the observed and model-generated data
showed good agreement.
 The difference in temperature between observed and predicted
amounts is greater than the rainfall difference.
 The difference between the observed and predicted minimum
temperatures is larger than the difference between the observed
and predicted maximum temperatures.
 The corrected mean maximum and minimum temperature
values show good agreement with the observed mean
maximum temperatures.
 The corrected mean Tmax of the study sub-basin is nearly 28
°C while the mean daily Tmin is 11 °C.
0.0
2.0
4.0
6.0
8.0
10.0
12.0
14.0
16.0
Tmin(oC)
Month
Min temp
corrected
uncorrected
Figure. 4.1: Observed, corrected, and
uncorrected minimum temperature (c)
Faculty of Civil and Water Resource Engineering
Performance Evaluation of CMIP6 models at regional
scale
The efficiency criteria found in the "hydroGOF" R package were used
to evaluate the performance of CMIP6 models under different
shared socio-economic pathways (SSPs)
 Root-mean-square errors (RMSE),
 percent of bias (PBIAS),
 Nash-Sutcliffe efficiency (NSE),
 Coefficient of Determination (𝑹𝟐) are among the efficiency criteria.
Faculty of Civil and Water Resource Engineering
Performance Evaluation of models …
For both the observed (1990-2019) and two future periods, near-term (2026–2055)
and mid-term (2056–2085), seven models were used to estimate the climate variables
Climate variables Precipitation (mm/month)
Model R2 RMSE (mm) NSE PBIAS %
BCC-CSM-2MR 0.92 23.01 0.90 15.15
CAMS-CSM1-0 0.82 55.07 0.71 -37.2
CanESM5p1 0.90 30.76 0.83 10.25
CanESM5p2 0.90 30.32 0.83 9.55
FGOALS-g3 0.88 47.15 0.75 20.95
MIROC6 0.90 110.65 −0.44 83.32
MIROC-ES2L 0.90 46.12 0.61 37.57
MRI-ESM2-0 0.92 33.42 0.64 25.15
Faculty of Civil and Water Resource Engineering
Performance evolution of models …
Climate
variables
temperature(°C)
Model R2 RMSE (mm) NSE PBIAS %
BCC-CSM2MR 1.42 4.98 0.5 0.9
CanESM5p1 2.26 8.06 0.03 0.92
CanESM5p2 1.65 6.48 0.36 0.88
FGOALS-g3 0.68 0.87 0.82 0.9
MIROC6 1.54 5.06 0.64 0.90
MIROC-ES2L 1.69 −6.05 0.23 0.85
MRI-ESM2-0 0.8 −0.92 0.75 0.92
Table 4.1: Statistics used to evaluate performance climate models
Faculty of Civil and Water Resource Engineering
Performance Evaluation of models…
From the above table BCC-CSM-2MR for precipitation and MRI-ESM2-0 for
temperature models were found to perform better than another model.
This is also in line with other studies that employed an ensemble mean of climatic model outputs
(Alaminie et al., 2021). According to some studies, using the ensemble mean of simulated rainfall is more
accurate than using the output of a single model (Kim et al., 2014). It has also been discovered that using
an ensemble mean instead of individual model rainfall simulations improves the correlation between
simulated and gauged data (Alemseged & Tom, 2015). For example,Foyhirun et al. (2019) used 15
GCMs at various weather stations and proposed the MRI-CGCM3 and GFDL-ESM2M climate models
for predicting wave energy in the future.
Faculty of Civil and Water Resource Engineering
Trends of climate variables
Rainfall observed Temperature observed
y = -4.1326x + 9535.4
R² = 0.0343
600.0
800.0
1000.0
1200.0
1400.0
1600.0
1800.0
1990 2000 2010 2020
Rainfall
(mm)
year
Rainfall(Obseved)
Rainfall(Obseved)
y = 0.0539x - 83.003
R² = 0.4663
1990 1995 2000 2005 2010 2015 2020
23.0
23.5
24.0
24.5
25.0
25.5
26.0
26.5
year
Average
Tmax
Temprature (Observed)
tempmax
Linear (tempmax)
Figure 4.2: Plot of annual rainfall for observed period (1990-2019) Figure 4.3: Plot of average temperature trend for observed period (1990-2019)
Faculty of Civil and Water Resource Engineering
Episode Climatic
variables
Kendall’s
tau
Z S Sen’s
slope
P value Trend type
Baseline
period
Rain falls -0.12 -0.9 -11 -4.1 0.35 Decreasing
Temperature 0.49 3.82 259 0.05 0.0001 Increasing
Table 4.2: Trends of climate variables (rainfall and temperature) for baseline periods
Faculty of Civil and Water Resource Engineering
Future Precipitation and Temperature Trend Analysis
800.0
900.0
1000.0
1100.0
1200.0
1300.0
1400.0
1500.0
1600.0
1700.0
2026 2031 2036 2041 2046 2051 2056 2061 2066 2071 2076 2081 2086
precipitation
(mm)
SSP2-4.5(2026-2055) SSP5-8.5(2026-2055)
y = 0.0195x - 12.376
R² = 0.2952
y = 0.0473x - 68.081
R² = 0.7493
25.0
26.0
27.0
28.0
29.0
30.0
31.0
32.0
2026 2032 2038 2044 2050 2056 2062 2068 2074 2080
Mean
Max
Temp(oC)
Year
Simulated temprature (2026-2085)
SSP2-4.5 SSP5-8.5 Linear (SSP2-4.5) Linear (SSP5-8.5)
Faculty of Civil and Water Resource Engineering
Episode Scenario Climatic
variables
Kendall’s
tau
Z S Sen’s
slope
P value Trend type
2026-
2055
SSP2-4.5
Rain
fall
-0.16 -1.24 -71 -5.07 0.211 Decreasing
SSP5-8.5 -0.19 -1.49 -85 -6.18 0.134 Decreasing
2056-
2085
SSP2-4.5 -0.22 -1.71 -97 -5.18 0.086 Decreasing
SSP5-8.5 -0.47 -3.6 -95 -4.21 0.002 Decreasing
2026-
2055
SSP2-4.5
Temperature
0.24 1.86 105 0.02 0.0628 Increasing
SSP5-8.5 0.77 5.9 332 0.09 0.000 Increasing
2056-
2085
SSP2-4.5 0.06 0.44 26 0.001 0.65 Increasing
SSP5-8.5 0.55 4.23 238 0.05 0.00 Increasing
Faculty of Civil and Water Resource Engineering
 In relation to this study Bekele et al. (2019) the MK tested showed that there is
decreasing trend in annual rainfall of three station that found in birr watershed
(Adet, Dembecha, and Lay birr). The change in rainfall magnitude was 8.19, 2.20,
and 3.90 mm/ year in Adet, Dembecha, and Lay birr station respectively
Faculty of Civil and Water Resource Engineering
20
22
24
26
28
30
32
Jan Feb Mar Apr May Jun Jul Aug Sep Oct Nov Dec
Maximum
temprature
oC
SSP5-8.5(2056-2085) SSP2-4.5(2056-2085)
SSP5-8.5(2026-2056) SSP2-4.5(2026-2056)
North gojam areal-Averaged (observed)
a)
Mean monthly temperature
0
50
100
150
200
250
300
350
400
450
500
550
600
Jan Feb Mar Apr May Jun Jul Aug Sep Oct Nov Dec
mean
Precipitation
(mm/month)
month
SSP5-8.5(2056-2085) SSP2-4.5(2056-2085)
SSP5-8.5(2026-2056) SSP2-4.5(2026-2056)
North gojam areal-Averaged (observed)
b) Mean monthly precipitation
As shown in figure 4.5(b) the monthly average precipitation is decrease in month December, January, February,
and May i.e., irrigation season for the study area, this less amount of rain fall has direct effect on effective rain
fall and consequently it has effect on crop water demand and irrigation water requirements while the
temperature is high during march
Faculty of Civil and Water Resource Engineering
Comparative change in climate variables
RCM Runs Time BCC-CSM-2MR Scenarios
Mean Precipitation (mm/30 years) SSP2-4.5 SSP5-8.5
Baseline 1251.6 1251.6
2026-2055 1224.8 1183.8
2056-2085 1260.8 1218.7
2026-2085 1242.8 1201.2
Change of Near-term (%) -2.1 -5.4
Change of Mid-term (%) 0.7 -2.6
Change of 21th Century (%) -0.7 -4.0
MRI-ESM2-0 Max. Temperature (◦C) SSP2-4.5 SSP5-8.5
Baseline 25.1 25.1
2026-2055 27.3 28.5
2056-2085 28 29.7
2026-2085 27.6 29.1
Change of Near-term (◦C) 2.2 3.4
Change of mid-term (◦C) 2.9 4.6
Change of 21th Century (◦C) 2.5 4
Faculty of Civil and Water Resource Engineering
4.4. Crop water demand and irrigation water requirements
570
580
590
600
610
620
630
640
650
660
CWR(SSP2-4.5) IWR(SSP2-4.5) CWR(SSP5-8.5) IWR(SSP5-8.5)
CWD
and
IWR
(mm/growth
period
CWD and IWR under SSP2-4.5 & SSP5-8.5(Maize)
Baseline 2020 2050
430
440
450
460
470
480
490
500
CWR(SSP2-4.5) IWR(SSP2-4.5) CWR(SSP5-8.5) IWR(SSP5-8.5)
CWD
and
IWR
(mm/growth
period
CWD and IWR under SSP2-4.5 & SSP5-8.5(wheat)
Baseline 2020 2050
Faculty of Civil and Water Resource Engineering
4.4. Crop water demand and irrigation water requirements
potato and onion
490
500
510
520
530
540
550
560
CWR(SSP2-4.5) IWR(SSP2-4.5) CWR(SSP5-8.5) IWR(SSP5-8.5)
CWD
and
IWR
(mm/growth
period
CWD and IWR under SSP2-4.5 & SSP5-8.5(potato )
Baseline 2020 2050
450
460
470
480
490
500
510
520
CWR(SSP2-4.5) IWR(SSP2-4.5) CWR(SSP5-8.5) IWR(SSP5-8.5)
CWD
and
IWR
(mm/growth
period
CWD and IWR under SSP2-4.5 & SSP5-8.5(Onion)
Baseline 2020 2050
Faculty of Civil and Water Resource Engineering
5. Conclusion
From this study
 Results from the Mann-Kendall trend test generally showed that climate change and
variability are expected to trigger changes in temperature and precipitation series that
would affect the irrigation water availability in the study area.
 The areal average precipitation may decrease under all SSP scenarios.
 The rise in IWR and CWD is found in all future scenarios. The maximum incremental
CWD and IWR are expected during the developmental growth stage. This increment in
future CWD and IWR of crops may be attributed due to increase in average
temperature and evapotranspiration.
Faculty of Civil and Water Resource Engineering
6. Recommendation
 The study points to an upcoming increase in irrigation water requirements that will
raise problems so that mitigation and adaptation strategies can be made ahead of time.
The study will also assist policymakers in making decisions on irrigation development
in the sub-basin and watersheds.
 Policymakers, water managers, and users should be curious about the proper use and
implementation of water projects. Appropriate irrigation schedules, reservoir operation
rules, and environmental protection procedures shall be in place.
Faculty of Civil and Water Resource Engineering

Msc 2023.pptx

  • 1.
    Faculty of Civiland Water Resource Engineering BAHIR DAR UNIVERSITY BAHIR DAR INSTITUTE OF TECHNOLOGY SCHOOL OF RESEARCH AND GRADUATE STUDIES FACULTY OF CIVIL AND WATER RESOURCES ENGINEERING Department of Irrigation Engineering and Management Research Thesis progress: Evaluating Impacts Of Climate Change On Irrigated Agriculture A Case Of North Gojjam Sub-basin, Blue Nile Basin, Ethiopia By: Enyew Belayneh Advisor: Abebech Abera (PhD) BAHIR DAR, ETHIOPIA DECEMBER, 2023
  • 2.
    Faculty of Civiland Water Resource Engineering Presentation outline  Introduction  Statement of the problem  Objectives  Scope of the study  Significance of the study  Materials and Methods  Result and discussion  Conclusion  Recommendation
  • 3.
    Faculty of Civiland Water Resource Engineering 1. Introduction 1.1 background  Climate change refers to a systematic change in the long-term statistics of climate elements over several decades. By changing the average weather conditions over time, such as rainfall, temperature, streamflow, groundwater storage, and wind, it alters the composition of the earth’s atmosphere (IPCC, 2007, 2014).
  • 4.
    Faculty of Civiland Water Resource Engineering Introduction …  If the climate change phenomenon occurs frequently, future water availability for crop water demand (CWD), domestic water consumption, and agricultural production will become more uncertain. Depending on the crop type and crop characteristics, CWD can be increased by up to 250% by the end of the twenty-first century (Gondim et al., 2012). In developing regions, irrigation water requirement (IWR) can be increased by 50% for each degree of global warming, while in developed regions, it is expected to increase by 16% (Fischer et al., 2007).
  • 5.
    Faculty of Civiland Water Resource Engineering 1.2 Statement of the problem  Higher temperatures due to climate change will result in increased evapotranspiration, affecting hydrological systems and agriculture. The investigation of climate change impacts on various sectors, particularly agriculture, is critical for decision-makers; however, most developing countries, including Ethiopia, have not done that well.
  • 6.
    Faculty of Civiland Water Resource Engineering  Despite the fact that the effects of climate change and variability are particularly devastating in the North Gojjam sub-basin, the study of climate change impacts on crops and irrigation work due to water stress has not been yet investigated, and also its impact at local level is not quantify rather global, In addition to this, the majority of small scale irrigation systems, as commonly found in developing African countries, including Ethiopia particularly in north gojjam sub- basin directly affected by unpredictable temperature and rainfall variations, crop water demand and irrigation water requirements resulting in yield reduction or crop failure. In order to fill this gap, this study was held.
  • 7.
    Faculty of Civiland Water Resource Engineering 1.3 Research question  How is climate change is expected to trigger changes in rainfall and temperature series?  How alarming is the future rainfall and temperature change in the study area? Is there a warming trend?  What percent (%) changed in precipitation and temperatures from the baseline period?  Will the future (rainfall and temperatures) affect the irrigation water requirement in the study area?  What will be the future CWD and IWR look like compared to the base line period?
  • 8.
    Faculty of Civiland Water Resource Engineering 1.4 Objective of the study General objective  Assess and evaluate the impacts of climate change on irrigated agriculture. Specific objectives  To assess climate change trends of hydro climatic variables (rainfall and temperature) in the Study area.  To estimate the current and future crop water demand of selected major crops grown in the study area under various climate change scenarios.  To quantifying the climate change parameters (evapotranspiration, temperature & rainfall) in the projected time period.
  • 9.
    Faculty of Civiland Water Resource Engineering Scope of the study  Explores the impact of climate change on irrigated agriculture under various climate change scenarios, in the North Gojjam Sub Basin of Abay Basin.  Limited to predict rainfall, temperature, CWR and IWR. Significance of the study  It is critical for preparing and planning adaptation to climate change effects on water resources, IWR, and agricultural sustainability.  It is also critical for proper water management to investigate and resolve risks associated with available irrigation water resources based on future variability in climatic variables.
  • 10.
    Faculty of Civiland Water Resource Engineering Cont.… In general, this study will assist water managers, decision-makers, and producers in understanding the impact of climate change and planning appropriate adaptation measures that must be implemented ahead of time.  Further it increases the scientific community's and other stakeholders' awareness and knowledge of the effects of climate change on water use for irrigation at the local level
  • 11.
    Faculty of Civiland Water Resource Engineering 2. Methodology Description of the study area  Geographically located between 37.3° and 39.6° E longitude and 10.8° and 11.9° N latitude  Located on its elevation approximately between 1030 and 4090 m a.s.l and has coverage area of 1,431,360 ha.  The average maximum and minimum temperatures of the sub-basin range from 24.6 °C to 28.1 °C and 11.0 °C to 14.5 °C, respectively, and the mean annual temperature is 19.41 °C.
  • 12.
    Faculty of Civiland Water Resource Engineering Maps of the study area
  • 13.
    Faculty of Civiland Water Resource Engineering Data source/collection The data downloaded or received from the appropriate sources Data source Observed metrological data Ethiopian National Meteorological Agency (ENMA) Future metrological data WCRP-CMIP6 (https://esgf-node.llnl.gov/projects/cmip6/) soil and crop data From FAO drainage paper 56 and local observation soil map Amhara Design and Supervision office, Bahirdar Event methods Filling missing data XLSTAT trial version 2018 consistency test Double mass curve Bias correction projected data CMhyd (Climate Model data for hydrologic modeling) tool Performance Evaluation of CMIP6 Model R studio (hydroGOF" R package) Trend analysis Mann–Kendall (MK) test CWR CROPWAT 8.0 software GIS and Microsoft office 16 are also used in this research
  • 14.
    Faculty of Civiland Water Resource Engineering CROPWAT model Estimation of reference evapotranspiration (ETo) Rn is the net radiation (MJ/m2/day); G is the soil heat flux density (MJ/m2 per day); T is the average daily air temperature at standard height(°C); u2 is the wind speed at 2 m height (m/s); es is the saturation vapor pressure (kPa); FAO Penman Monteith equation ea is the actual vapor pressure (kPa); es-ea is the saturation vapor pressure deficit (kPa); Δ is the slope vapor pressure curve (kPa °C-1) γ is the psychometric constant (kPa °C-1)
  • 15.
    Faculty of Civiland Water Resource Engineering Estimation of Crop Water Requirement ETc = Kc × ETo Where ETc is crop evapotranspiration (mm/day), ETo is the reference crop evapotranspiration (mm/day), and Kc is the crop coefficient. Estimation of Effective Rainfall  By using USDA Soil Conservation Service  Pe = TR × (125 − 0.2 × TR)/125 When total rainfall is > 250 mm, effective rainfall is given as:  Pe = 125 + 0.1 × TR
  • 16.
    Faculty of Civiland Water Resource Engineering Flowchart of CWR Flowchart of CWR 
  • 17.
    Faculty of Civiland Water Resource Engineering Flowchart of the methodology adopted in this study
  • 18.
    Faculty of Civiland Water Resource Engineering 4 Result and discussion  Climatic model bias correction The climatic model bias was corrected with Delta change method using CMhyd tool, and observed, corrected and uncorrected values are shown in the figure below
  • 19.
    Faculty of Civiland Water Resource Engineering 0.0 100.0 200.0 300.0 400.0 500.0 600.0 700.0 Jan Feb Mar Apr May Jun Jul Aug Sep Oct Nov Dec RF in mm/month Month Observed Corrected Uncorrected a) 0.0 5.0 10.0 15.0 20.0 25.0 30.0 Tmax(oC) Month Obseved Tmax Corrected Uncorrected b) Figure. 4.1: Observed, corrected, and uncorrected rainfall (a) Figure. 4.1: Observed, corrected, and uncorrected Tmax (b)
  • 20.
    Faculty of Civiland Water Resource Engineering  The difference between the uncorrected and observed mean climate variables is significant.  After bias adjustments, the observed and model-generated data showed good agreement.  The difference in temperature between observed and predicted amounts is greater than the rainfall difference.  The difference between the observed and predicted minimum temperatures is larger than the difference between the observed and predicted maximum temperatures.  The corrected mean maximum and minimum temperature values show good agreement with the observed mean maximum temperatures.  The corrected mean Tmax of the study sub-basin is nearly 28 °C while the mean daily Tmin is 11 °C. 0.0 2.0 4.0 6.0 8.0 10.0 12.0 14.0 16.0 Tmin(oC) Month Min temp corrected uncorrected Figure. 4.1: Observed, corrected, and uncorrected minimum temperature (c)
  • 21.
    Faculty of Civiland Water Resource Engineering Performance Evaluation of CMIP6 models at regional scale The efficiency criteria found in the "hydroGOF" R package were used to evaluate the performance of CMIP6 models under different shared socio-economic pathways (SSPs)  Root-mean-square errors (RMSE),  percent of bias (PBIAS),  Nash-Sutcliffe efficiency (NSE),  Coefficient of Determination (𝑹𝟐) are among the efficiency criteria.
  • 22.
    Faculty of Civiland Water Resource Engineering Performance Evaluation of models … For both the observed (1990-2019) and two future periods, near-term (2026–2055) and mid-term (2056–2085), seven models were used to estimate the climate variables Climate variables Precipitation (mm/month) Model R2 RMSE (mm) NSE PBIAS % BCC-CSM-2MR 0.92 23.01 0.90 15.15 CAMS-CSM1-0 0.82 55.07 0.71 -37.2 CanESM5p1 0.90 30.76 0.83 10.25 CanESM5p2 0.90 30.32 0.83 9.55 FGOALS-g3 0.88 47.15 0.75 20.95 MIROC6 0.90 110.65 −0.44 83.32 MIROC-ES2L 0.90 46.12 0.61 37.57 MRI-ESM2-0 0.92 33.42 0.64 25.15
  • 23.
    Faculty of Civiland Water Resource Engineering Performance evolution of models … Climate variables temperature(°C) Model R2 RMSE (mm) NSE PBIAS % BCC-CSM2MR 1.42 4.98 0.5 0.9 CanESM5p1 2.26 8.06 0.03 0.92 CanESM5p2 1.65 6.48 0.36 0.88 FGOALS-g3 0.68 0.87 0.82 0.9 MIROC6 1.54 5.06 0.64 0.90 MIROC-ES2L 1.69 −6.05 0.23 0.85 MRI-ESM2-0 0.8 −0.92 0.75 0.92 Table 4.1: Statistics used to evaluate performance climate models
  • 24.
    Faculty of Civiland Water Resource Engineering Performance Evaluation of models… From the above table BCC-CSM-2MR for precipitation and MRI-ESM2-0 for temperature models were found to perform better than another model. This is also in line with other studies that employed an ensemble mean of climatic model outputs (Alaminie et al., 2021). According to some studies, using the ensemble mean of simulated rainfall is more accurate than using the output of a single model (Kim et al., 2014). It has also been discovered that using an ensemble mean instead of individual model rainfall simulations improves the correlation between simulated and gauged data (Alemseged & Tom, 2015). For example,Foyhirun et al. (2019) used 15 GCMs at various weather stations and proposed the MRI-CGCM3 and GFDL-ESM2M climate models for predicting wave energy in the future.
  • 25.
    Faculty of Civiland Water Resource Engineering Trends of climate variables Rainfall observed Temperature observed y = -4.1326x + 9535.4 R² = 0.0343 600.0 800.0 1000.0 1200.0 1400.0 1600.0 1800.0 1990 2000 2010 2020 Rainfall (mm) year Rainfall(Obseved) Rainfall(Obseved) y = 0.0539x - 83.003 R² = 0.4663 1990 1995 2000 2005 2010 2015 2020 23.0 23.5 24.0 24.5 25.0 25.5 26.0 26.5 year Average Tmax Temprature (Observed) tempmax Linear (tempmax) Figure 4.2: Plot of annual rainfall for observed period (1990-2019) Figure 4.3: Plot of average temperature trend for observed period (1990-2019)
  • 26.
    Faculty of Civiland Water Resource Engineering Episode Climatic variables Kendall’s tau Z S Sen’s slope P value Trend type Baseline period Rain falls -0.12 -0.9 -11 -4.1 0.35 Decreasing Temperature 0.49 3.82 259 0.05 0.0001 Increasing Table 4.2: Trends of climate variables (rainfall and temperature) for baseline periods
  • 27.
    Faculty of Civiland Water Resource Engineering Future Precipitation and Temperature Trend Analysis 800.0 900.0 1000.0 1100.0 1200.0 1300.0 1400.0 1500.0 1600.0 1700.0 2026 2031 2036 2041 2046 2051 2056 2061 2066 2071 2076 2081 2086 precipitation (mm) SSP2-4.5(2026-2055) SSP5-8.5(2026-2055) y = 0.0195x - 12.376 R² = 0.2952 y = 0.0473x - 68.081 R² = 0.7493 25.0 26.0 27.0 28.0 29.0 30.0 31.0 32.0 2026 2032 2038 2044 2050 2056 2062 2068 2074 2080 Mean Max Temp(oC) Year Simulated temprature (2026-2085) SSP2-4.5 SSP5-8.5 Linear (SSP2-4.5) Linear (SSP5-8.5)
  • 28.
    Faculty of Civiland Water Resource Engineering Episode Scenario Climatic variables Kendall’s tau Z S Sen’s slope P value Trend type 2026- 2055 SSP2-4.5 Rain fall -0.16 -1.24 -71 -5.07 0.211 Decreasing SSP5-8.5 -0.19 -1.49 -85 -6.18 0.134 Decreasing 2056- 2085 SSP2-4.5 -0.22 -1.71 -97 -5.18 0.086 Decreasing SSP5-8.5 -0.47 -3.6 -95 -4.21 0.002 Decreasing 2026- 2055 SSP2-4.5 Temperature 0.24 1.86 105 0.02 0.0628 Increasing SSP5-8.5 0.77 5.9 332 0.09 0.000 Increasing 2056- 2085 SSP2-4.5 0.06 0.44 26 0.001 0.65 Increasing SSP5-8.5 0.55 4.23 238 0.05 0.00 Increasing
  • 29.
    Faculty of Civiland Water Resource Engineering  In relation to this study Bekele et al. (2019) the MK tested showed that there is decreasing trend in annual rainfall of three station that found in birr watershed (Adet, Dembecha, and Lay birr). The change in rainfall magnitude was 8.19, 2.20, and 3.90 mm/ year in Adet, Dembecha, and Lay birr station respectively
  • 30.
    Faculty of Civiland Water Resource Engineering 20 22 24 26 28 30 32 Jan Feb Mar Apr May Jun Jul Aug Sep Oct Nov Dec Maximum temprature oC SSP5-8.5(2056-2085) SSP2-4.5(2056-2085) SSP5-8.5(2026-2056) SSP2-4.5(2026-2056) North gojam areal-Averaged (observed) a) Mean monthly temperature 0 50 100 150 200 250 300 350 400 450 500 550 600 Jan Feb Mar Apr May Jun Jul Aug Sep Oct Nov Dec mean Precipitation (mm/month) month SSP5-8.5(2056-2085) SSP2-4.5(2056-2085) SSP5-8.5(2026-2056) SSP2-4.5(2026-2056) North gojam areal-Averaged (observed) b) Mean monthly precipitation As shown in figure 4.5(b) the monthly average precipitation is decrease in month December, January, February, and May i.e., irrigation season for the study area, this less amount of rain fall has direct effect on effective rain fall and consequently it has effect on crop water demand and irrigation water requirements while the temperature is high during march
  • 31.
    Faculty of Civiland Water Resource Engineering Comparative change in climate variables RCM Runs Time BCC-CSM-2MR Scenarios Mean Precipitation (mm/30 years) SSP2-4.5 SSP5-8.5 Baseline 1251.6 1251.6 2026-2055 1224.8 1183.8 2056-2085 1260.8 1218.7 2026-2085 1242.8 1201.2 Change of Near-term (%) -2.1 -5.4 Change of Mid-term (%) 0.7 -2.6 Change of 21th Century (%) -0.7 -4.0 MRI-ESM2-0 Max. Temperature (◦C) SSP2-4.5 SSP5-8.5 Baseline 25.1 25.1 2026-2055 27.3 28.5 2056-2085 28 29.7 2026-2085 27.6 29.1 Change of Near-term (◦C) 2.2 3.4 Change of mid-term (◦C) 2.9 4.6 Change of 21th Century (◦C) 2.5 4
  • 32.
    Faculty of Civiland Water Resource Engineering 4.4. Crop water demand and irrigation water requirements 570 580 590 600 610 620 630 640 650 660 CWR(SSP2-4.5) IWR(SSP2-4.5) CWR(SSP5-8.5) IWR(SSP5-8.5) CWD and IWR (mm/growth period CWD and IWR under SSP2-4.5 & SSP5-8.5(Maize) Baseline 2020 2050 430 440 450 460 470 480 490 500 CWR(SSP2-4.5) IWR(SSP2-4.5) CWR(SSP5-8.5) IWR(SSP5-8.5) CWD and IWR (mm/growth period CWD and IWR under SSP2-4.5 & SSP5-8.5(wheat) Baseline 2020 2050
  • 33.
    Faculty of Civiland Water Resource Engineering 4.4. Crop water demand and irrigation water requirements potato and onion 490 500 510 520 530 540 550 560 CWR(SSP2-4.5) IWR(SSP2-4.5) CWR(SSP5-8.5) IWR(SSP5-8.5) CWD and IWR (mm/growth period CWD and IWR under SSP2-4.5 & SSP5-8.5(potato ) Baseline 2020 2050 450 460 470 480 490 500 510 520 CWR(SSP2-4.5) IWR(SSP2-4.5) CWR(SSP5-8.5) IWR(SSP5-8.5) CWD and IWR (mm/growth period CWD and IWR under SSP2-4.5 & SSP5-8.5(Onion) Baseline 2020 2050
  • 34.
    Faculty of Civiland Water Resource Engineering 5. Conclusion From this study  Results from the Mann-Kendall trend test generally showed that climate change and variability are expected to trigger changes in temperature and precipitation series that would affect the irrigation water availability in the study area.  The areal average precipitation may decrease under all SSP scenarios.  The rise in IWR and CWD is found in all future scenarios. The maximum incremental CWD and IWR are expected during the developmental growth stage. This increment in future CWD and IWR of crops may be attributed due to increase in average temperature and evapotranspiration.
  • 35.
    Faculty of Civiland Water Resource Engineering 6. Recommendation  The study points to an upcoming increase in irrigation water requirements that will raise problems so that mitigation and adaptation strategies can be made ahead of time. The study will also assist policymakers in making decisions on irrigation development in the sub-basin and watersheds.  Policymakers, water managers, and users should be curious about the proper use and implementation of water projects. Appropriate irrigation schedules, reservoir operation rules, and environmental protection procedures shall be in place.
  • 36.
    Faculty of Civiland Water Resource Engineering