
Recommended
Recommended
More Related Content
What's hot
What's hot (20)
Viewers also liked
Similar to Dub-_et_al-2013-Integrated_Environmental_Assessment_and_Management
Similar to Dub-_et_al-2013-Integrated_Environmental_Assessment_and_Management (20)
Dub-_et_al-2013-Integrated_Environmental_Assessment_and_Management
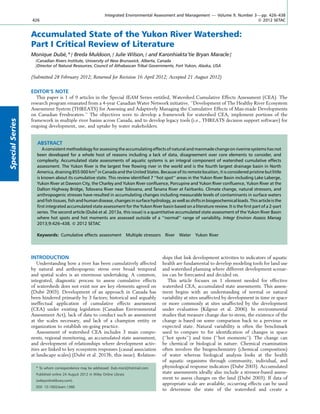
- 1. Accumulated State of the Yukon River Watershed: Part I Critical Review of Literature Monique Dube´,*y Breda Muldoon,y Julie Wilson,y and Karonhiakta’tie Bryan Maraclez yCanadian Rivers Institute, University of New Brunswick, Alberta, Canada zDirector of Natural Resources, Council of Athabascan Tribal Governments, Fort Yukon, Alaska, USA (Submitted 28 February 2012; Returned for Revision 16 April 2012; Accepted 21 August 2012) ABSTRACT A consistent methodology for assessing theaccumulating effects of natural and manmade change on riverinesystems has not been developed for a whole host of reasons including a lack of data, disagreement over core elements to consider, and complexity. Accumulated state assessments of aquatic systems is an integral component of watershed cumulative effects assessment. The Yukon River is the largest free flowing river in the world and is the fourth largest drainage basin in North America, draining 855 000 km2 in Canada and the United States. Because of its remote location, it is considered pristine but little is known about its cumulative state. This review identified 7 ‘‘hot spot’’ areas in the Yukon River Basin including Lake Laberge, Yukon River at Dawson City, the Charley and Yukon River confluence, Porcupine and Yukon River confluence, Yukon River at the Dalton Highway Bridge, Tolovana River near Tolovana, and Tanana River at Fairbanks. Climate change, natural stressors, and anthropogenic stresses have resulted in accumulating changes including measurable levels of contaminants in surface waters and fish tissues, fish and humandisease, changesin surface hydrology, aswell asshifts in biogeochemical loads. This article is the first integrated accumulated state assessment for the Yukon River basin based on a literature review. It is the first part of a 2-part series. The second article (Dube´ et al. 2013a, this issue) is a quantitative accumulated state assessment of the Yukon River Basin where hot spots and hot moments are assessed outside of a ‘‘normal’’ range of variability. Integr Environ Assess Manag 2013;9:426–438. ß 2012 SETAC Keywords: Cumulative effects assessment Multiple stressors River Water Yukon River INTRODUCTION Understanding how a river has been cumulatively affected by natural and anthropogenic stress over broad temporal and spatial scales is an enormous undertaking. A common, integrated, diagnostic process to assess cumulative effects of watersheds does not exist nor are key elements agreed on (Dube´ 2003). Development of an approach in Canada has been hindered primarily by 3 factors; historical and arguably ineffectual application of cumulative effects assessment (CEA) under existing legislation (Canadian Environmental Assessment Act), lack of data to conduct such an assessment at the scales necessary, and lack of a champion entity or organization to establish on-going practice. Assessment of watershed CEA includes 3 main compo- nents, regional monitoring, an accumulated state assessment, and development of relationships where development activ- ities are linked to key ecosystem responses (causal association at landscape scales) (Dube´ et al. 2013b, this issue). Relation- ships that link development activities to indicators of aquatic health are fundamental to develop modeling tools for land use and watershed planning where different development scenar- ios can be forecasted and decided on. This article focuses on 1 element needed for effective watershed CEA, accumulated state assessments. This assess- ment begins with an understanding of normal or natural variability at sites unaffected by development in time or space or more commonly at sites unaffected by the development under evaluation (Kilgour et al. 2006). In environmental studies that measure change due to stress, the existence of the change is based on some comparison back to a previous or expected state. Natural variability is often the benchmark used to compare to for identification of changes in space (‘‘hot spots’’) and time (‘‘hot moments’’). The change can be chemical or biological in nature. Chemical examination often involves the biogeochemistry (chemical composition) of water whereas biological analysis looks at the health of aquatic organisms through community, individual, and physiological response indicators (Dube´ 2003). Accumulated state assessments ideally also include a stressor-based assess- ment to assess changes on the land (Dube´ 2003). If data of appropriate scale are available, occurring effects can be used to determine the state of the watershed and create a Integrated Environmental Assessment and Management — Volume 9, Number 3—pp. 426–438 426 ß 2012 SETAC EDITOR’S NOTE This paper is 1 of 9 articles in the Special IEAM Series entitled, Watershed Cumulative Effects Assessment (CEA). The research program emanated from a 4-year Canadian Water Network initiative, ‘‘Development of The Healthy River Ecosystem Assessment System (THREATS) for Assessing and Adaptively Managing the Cumulative Effects of Man-made Developments on Canadian Freshwaters.’’ The objectives were to develop a framework for watershed CEA, implement portions of the framework in multiple river basins across Canada, and to develop legacy tools (i.e., THREATS decision support software) for ongoing development, use, and uptake by water stakeholders. * To whom correspondence may be addressed: Dub.mon@hotmail.com Published online 24 August 2012 in Wiley Online Library (wileyonlinelibrary.com). DOI: 10.1002/ieam.1360 SpecialSeries
- 2. benchmark to assess the sustainability of future development (Dube´ and Munkittrick 2001). This article assesses the accumulated state of the Yukon River Basin (YRB) based on a critical literature review of existing information. Areas of documented disturbance, as concluded by the authors of the literature, were catalogued as hotspots or areas most at risk for accumulating effects and later verified through quantitative accumulated state analysis (second article in series, this issue). As data availability are a core limiting factor to assessments and very few studies have collected data in the context of broad accumulated state assessments, this article intended to illustrate how results from existing literature could be integrated to identify hot spots and hot moments as a preliminary, ‘‘first pass’’ assessment. The Yukon River was selected as a model river for this study, as it is the largest free flowing river in the world (Nilsson et al. 2005) and the fourth largest drainage basin in North America, draining 855 000 km2 in Canada and the United States (Brabets et al. 2000) (Figure 1). Its headwaters begin in British Columbia (BC) where it flows into the central Yukon curving into Alaska and finally discharging into the Bering Sea. Water that flows from the Yukon contributes 8% of water in the Arctic Sea (Brabets et al. 2000). It contributes most of the freshwater runoff, sediments, and dissolved solutes (such as terrigenous dissolved organic C) to the eastern part of the Bering Sea (Lisitsysn 1969; Opsahl et al. 1999; Hansell et al. 2004). Because of its remote location it is considered pristine but little is known about its accumulated state. EFFECTS-BASED REVIEW This section reviews the literature where different responses were measured in environmental indicators for the Yukon River including water quality, quantity, fish tissue burdens, and fish and human disease reports. It summarizes the indicators that have been measured and documented changes and conclusions based on the original authors’ articles. It also presents a baseline from these studies in the form of describing expected patterns and trends of indicator responses commonly observed in the Yukon River. Water quality baseline The water quality of the Yukon River varies seasonally and spatially. From May to September, when the water is ice-free, 75% of the annual stream flow runoff occurs (Brabets et al. 2008) concurrent with the greatest discharge of organic C, nutrients, and sediments. Dissolved organic C (DOC) has been studied extensively in the Yukon River because of its composition and cycle in the environment and the potential to be influenced by climate change. Loads are generally Figure 1. Map of the Yukon River Basin showing drainage sub basins, Canada/US border, and location of hotspots identified from the literature review (inset modified from http://www.water.usgs.gov). Qualitative Accumulated State Assessment of the Yukon River—Integr Environ Assess Manag 9, 2013 427
- 3. highest in spring during freshet and lowest in winter (Striegl et al. 2005) with 63% exported during ice out (Raymond et al. 2007). Tributaries of the Yukon River surrounded by wetlands, such as the Porcupine River, have the highest DOC loads whereas tributaries surrounded by bare rock, such as the Tanana River, have the lowest DOC loads (Striegl et al. 2005). The Yukon River is oligotrophic, limiting biological growth (Guo et al. 2004). Additional nutrient loads into the river will alter growth in the system. The major flux of N and P occurs during open water, May to September. The maximum loading of nutrients occurs during spring freshet, May, and decreases through September. The dominant species are particulate P (PP) and dissolved organic N (DON) (Guo et al. 2004). The source of P and N differs with P coming from chemical rock weathering, whereas N comes from plant material, land erosion in the spring, leaching of deeper soil horizons in the summer–autumn, and from groundwater in the winter (Dornblaser and Striegl 2007). Phosphorus is limited in the system and any increases in P discharge could impact aquatic growth and water quality (Guo et al. 2004). Suspended sediment (SS) in the Yukon River carries organic C, nutrients, contaminants, and a full suite of other minerals to the Bering Sea. Changes in SS concentrations have the potential to impact aquatic life by interfering with fish respiration, surface-prey feeding, spawning site availability, and benthic habitats (McLeay et al. 1987; Dornblaser and Striegl 2009). Suspended sediment concentrations of the Tanana River and White River contribute the highest SS loads to the Yukon River (Brabets et al. 2000; Dornblaser and Striegl 2009). Currently 95% of SS discharge occurs from May to September (Brabets et al. 2008) although the source of the SS deposition changes throughout the seasons. In spring, sources are from bank erosion and the resuspension of deposited sediments whereas in the summer–autumn, SS comes from glacial melt (Dornblaser and Striegl 2009). Suspended sediment composition is mostly silt and clay but also contains carbonate, quartz, and feldspars (Brabets et al. 2000; Eberl 2004). Effects on water quantity and quality In the interior regions of Alaska, south of the Yukon River, permafrost is warming between 0.3 8C to 1 8C (Osterkamp 2005). These authors report that permafrost warming will increase groundwater runoff consequently altering stream flow. Changes in stream flow have occurred in the Yukon River at Whitehorse and on the tributaries of the Stewart, Tanana, Takhini, Salcha, and Porcupine Rivers (Table 1:1.12, 1.13). Increases in groundwater discharge have also been observed through much of the basin over the past few years (Table 1:1.14). These results are supported by Peterson et al. (2002) who showed that freshwater flows from 6 of the largest Eurasian rivers to the Arctic Ocean (Yenisey, Lena, Ob’, Pechora, Kolyma, and Severnaya Dvina) have increased as average air temperatures have risen. Increases in freshwater runoff are expected to affect ocean stratification, circulation, and even global climate processes through the slowing of thermohaline circulation (Schiller et al. 1997; Weaver et al. 1999; Ottera˚ et al. 2003). Dissolved organic C loadings are predicted to change, as northern regions become warmer, permafrost melts, and river and groundwater flows are altered. Striegl et al. (2005, 2007) have predicted that as permafrost thaws DOC yields will initially increase, as meltwater runoff to the Yukon River increases, but as flow paths deepen DOC will be consumed more rapidly in the soil and groundwater (Table 1.16). Raymond et al. (2007) are consistent with this prediction stating that warming permafrost will increase stream flow leading to increase DOC loading across the Yukon River Basin as so far that the land has no more DOC to yield to the water (Table 1.17). The discrepancy between the single year results shown by Raymond et al. (2007) (a rising trend) and the 3-year results shown by Striegl et al. (2005) (a falling trend) illustrate the need for multidecadal monitoring and observa- tion. There is agreement that DOC will increase as temper- atures warm and flows increase but the persistence of the increase (how long it will occur) is unknown. Permafrost thaw and consequently a deeper active layer are expected to alter N, P, and SS levels in the Yukon River based on conclusions of Guo et al. (2004), Walvoord and Striegl (2007), McLeay et al. (1987), and Dornblaser and Striegl (2009). Suspended sediment concentrations in the Yukon River have increased as water yields have increased (Table 1.18). Increased SS in rivers have affected Arctic grayling appearance, lowered their food consumption, increased consumption of O2, reduced fish size, and increased susceptibility to contaminants (Table 1.9) (McLeay et al. 1987). Benthic invertebrate studies in the Yukon River have shown that high SS loads increased the abundance of pollution tolerant taxa (Table 1.10) (LePage 2009). Effects—disease and contamination in fish and water Nearly all village residents of the Yukon River Basin rely heavily on fish and game resources for survival (Kruse 1998; Brabets et al. 2000). All communities along the river obtain their drinking water from the Yukon River, its tributaries, or related aquifers and lakes (Roach et al. 1993). In some areas, the water is not treated before being consumed (Roach et al. 1993). Therefore, for many Alaska Natives who rely on traditional and customary activities any deleterious changes in water quality could have profound societal impacts (Houser et al. 2001). Studies on fish from the Yukon River Basin have reported detectable levels of contaminants in tissues, some of which exceed consumption guidelines. In addition, sediment cores taken from Lake Laberge showed residues of contaminants originating from anthropogenic sources (Rawn et al. 2001). Some studies have reported waterborne contaminants in surface waters at concentrations that exceed Canadian and US guidelines for drinking and recreational activities. Recent studies on salmon have shown them to carry a parasitic disease known as Ichthyophoniasis that currently threatens their migrations from the Bering Sea up the Yukon River (Kocan et al. 2004). The extent and details of these findings are presented in the sections below. Trace contaminants Mercury (Hg) and selenium (Se) have been measured in fish tissues from the Yukon River at levels exceeding consumption criteria or toxicity thresholds (Duffy et al. 1998; Jewett et al. 2003; Hinck et al. 2004, 2006). In northern pike, longnose sucker, and burbot, Hg levels (0.08–0.65 mg/g) exceeded toxicity thresholds for all bird and small mammal models suggesting a risk to piscivorous wildlife throughout 428 Integr Environ Assess Manag 9, 2013—M Dube´ et al.
- 6. the Yukon River basin (Hinck et al. 2006). Hg concentrations exceeding 0.3 mg/g w/w have been shown to cause repro- ductive impairment in loons through dietary exposure (Table 1.2) (Hinck et al. 2004, 2006). Jewett et al. (2003) measured methylmercury (MeHg) in muscle (1.56 mg/g) and liver (1.20 mg/g) of northern pike at levels that exceeded State of Alaska Epidemiology action levels (1.0 mg/g) (SAE 2001). Duffy et al. (1998) measured 7 species of fish for muscle tissue Hg in the Yukon-Kuskokwim Delta Region of Alaska and compared these levels for individual species to human and animal critical values established by Yeardley et al. (1998). The critical value of 0.1 mg/g of MeHg is the lowest legal limit used in the world with 1 of 26 countries surveyed using this value. Using this value as a reference, 85% of the sites sampled exceeded this value. Mean MeHg concentra- tions in sheefish (0.226 mg/g) and northern pike (0.718 mg/g) exceeded the critical value for both human consumption (0.2 mg/g) and animal consumption (0.1 mg/g) (Table 1.2). Methylmercury is of concern because it biomagnifies through the food chain and can cause neurological and developmental disorders in humans through indirect dietary exposure (Jewett et al. 2003). Hinck et al. (2004, 2006) measured several contaminants including Se in northern pike, burbot, and longnose sucker at 10 sites in the Yukon River basin. Selenium (0.23–0.85 mg/g wet weight [ww]) concentrations at 4 sites, in all 3 species exceeded whole body toxicity thresholds for fish of 0.8 mg/g ww (assuming 80% moisture; 4 mg/g dry weight [dw]) and 0.6 mg/g ww (3 mg/g dw) for piscivorous wildlife (Table 1.1). These authors concluded that Se was a concern at these sites (Charley-Kandik, AK; Fish Hook Bend, AK; The Bridge, AK; Fairbanks, AK) (Hinck et al. 2004). Persistent organic pollutants Persistent organic pollutants (POPs) including polychlori- nated biphenyls (PCBs), DDT, and toxaphene have been measured in water, fish tissues, and sediments in the Yukon River basin. These contaminants were historically used as coolants, pesticides, and herbicides but are no longer in use. Braune et al. (1999) measured organochlorines including PCBs, DDT, and toxaphene in fish tissues from Yukon Lakes. Polychlorinated biphenyls in burbot liver (1267 ng/g), lake trout muscle (448 ng/g), and white fish muscle (61 ng/g) from Lake Laberge (1990–1994) were 25-fold, 128-fold, and 610-fold higher, respectively, than levels in the same species and tissues in other Yukon regional lakes (Table 1.3, 1.4, and 1.5). Mueller and Matz (2000) reported similar results for burbot livers sampled in the Yukon, Koyukuk, and Tanana rivers in Alaska (AK). Specifically, they reported concen- trations of PCBs in burbot livers were greater than 0.11 mg/g ww with the highest concentrations (1.4 mg/g) in samples collected near Fairbanks, AK. Sediment PCB concentrations in Lake Laberge were lower than the levels found in the fish and concentrations have decreased by 50% (from 16.1 ng/g to 8.0 ng/g) over the period of 1964 to 1991 (Table 1.3) (Rawn et al. 2001). Hinck et al. (2006) reported PCB concentrations from 0.02 to 0.09 mg/g ww in fish tissue samples collected from 9 stations in the Yukon River basin with the highest concentration measured in female longnose sucker near Fairbanks. None of the PCB concentrations from the research of Hinck et al. (2006) exceeded New York State Department of Environmental Conservation wildlife guideline for fish of Table1.(Continued) NrStressvariableEffectmeasuredReference 1.16Averageflow1978–1980:avg.flowwas193Æ24km3 /aStreigletal.2005 DOCexport0.88TgC DOC2001–2003:avg.flowwas212Æ21km3 /a DOCexport0.53TgC 1.17DOCexport2004:Annualwaterfluxwas183km/yandannualDOCflux1.21Â109kg/yRaymondetal.2007 2005:Annualwaterfluxwas247km/yandannualDOCflux2.18Â109kg/y 1.18SSTRatNenana:avg.annualSSyieldandwateryield1966–1970:330Æ120gm2 /a,31.7Æ5.6cmDornblaserandStriegl2009 Avg.annualSSyieldandwateryield1983–1987:559Æ93gm2 /a,33.7Æ2.6cm Avg.annualSSyieldandwateryield2001–2005:503Æ58gm2 /a,35.6Æ1.3cm AG¼Arcticgrayling;avg.¼average;B¼burbot;C-Kconfl.¼Charley-KandikRiverConfluence;DHB¼DaltonHighwayBridge;DOC¼dissolvedorganiccarbon;FB¼Fairbanks;GW¼groundwater;LS¼longnosesucker;LT¼lake trout;MeHg¼methylmercury;NP¼Northernpike;PR¼PorcupineRiver;SS¼suspendedsediment;THg¼totalmercury;ToR¼TolovanaRiver;TR¼TananaRiver;TRatFB¼TananaRiveratFairbanks;WF¼whitefish;YR¼Yukon River. Qualitative Accumulated State Assessment of the Yukon River—Integr Environ Assess Manag 9, 2013 431
- 7. 0.11 mg/g ww. These studies suggest PCB contamination at locations within the Yukon basin (Lake Laberge, Fairbanks) appears to be decreasing with time and chemical use. DDT, a persistent organochlorine insecticide, remains present in the environment as a result of historical use dating back to the 1960s and 1970s. Hinck et al. (2006) measured DDT in fish tissues within the basin reporting the highest concentration in 2002 found in female northern pike (0.009 mg/g ww) and male longnose sucker (0.0047 mg/g ww) (Table 1.4). These concentrations were compared to fish and wildlife toxicity thresholds from the literature (wildlife criteria of 0.2 mg/g ww; piscivorous birds of 1– 3 mg/g ww; whole body fish criterion of 0.5 mg/g ww) showing levels in 2002 of low risk to fish and wildlife in the Yukon River basin. Rawn et al. (2001) have also showed a significant decrease in DDT in soil samples from 1960 to 1989 (Table 1.4). Hinck et al. (2006), Mueller and Matz (2000), and Braune et al. (1999) measured toxaphene concentrations in fish in the Yukon basin. This contaminant has been classified as the major organochlorine contaminant in the Canadian Arctic with concentrations in Lake Laberge burbot livers (2.3 mg/g ww) 125 times greater than in other Arctic lakes including Atlin Lake, Tagish Lake, March Lake, Fox Lake, etc. (Table 1.5) (Braune et al. 1999). Toxaphene was also detected in whole body samples of northern pike and longnose sucker in 2002 (0.012–0.034 mg/g ww) (Hinck et al. 2006). Mueller and Matz (2000) measured concen- trations of 0.14 mg/g and 0.29 mg/g in burbot liver in Fairbanks and Yukon Flats. As reviewed by Mueller and Matz (2000) and Hinck et al. (2006), acute and chronic effects of toxaphene on freshwater fish have been observed at whole body concentrations equal to or greater than 0.4 mg/g ww and fish for human consumption should be below the Health and Welfare Canada residue threshold of 0.1 mg/g. Historically, a ‘‘consumption advisory’’ has been in place for areas in the Yukon including Lake Laberge due to elevated levels of toxaphene and other organochlorine contaminates (Diamond et al. 2005). Bacteriological contaminants Various waterborne contaminants were detected in surface waters of both the Yukon and Alaska in 2 separate studies in 1993 and 2005 (Table 1.6–1.8) (Roach et al. 1993; Voytek et al. 2005). These contaminants include Enterococci, Giardia cysts, and Cryptosporidium oocytes. In the early 1990s, approximately 1000 Yukon residents required treatment for diarrheal illnesses due to Enterococcus, Giardia cysts, and Cryptosporidium oocytes in their water supply (Roach et al. 1993). However, the report rate may be lower than actual due to underreported cases (Roach et al. 1993). The biological action of cysts is slowed by cold temper- atures but survival rates are prolonged through drops in temperature (Roach et al. 1993). Two villages in Alaska, Stevens Village and Nenana, reported Enterococci above the US Environmental Protection Agency (USEPA) and State of Alaska drinking and recreational water standards of 0 counts/ L and 610 counts/L (USEPA 2000) (Table 1.6). The presence of Giardia cysts and Cryptosporidium oocysts were found in surface waters of Lake Laberge and were measured to be at higher levels than the surface waters in other areas (Table 1.7 and 1.8). Disease and salmon migration failures Ichthyophonus is a genus of unicellular parasites of fish and was first identified in Chinook salmon in Alaska in the 1980s (Kocan et al. 2004). Studies show that salmon infected with the disease ichthyophoniasis present with varying degrees of white spots on their heart, liver, and skeletal muscle. Reports also suggest that the disease prevents the salmon from drying properly and results in a slight ‘‘fruity’’ smell to those consuming infected fish (Kocan et al. 2004). Infected fish suffered reduced swimming stamina and growth and may cause early onset of fatigue in migrating Chinook leading them to die before they reach spawning grounds (Kocan and Hershberger 2006). Table 1:1.11 outlines the infection prevalence in male and female Chinook salmon during migrations from 1999 to 2003. Currently no concrete data exists on how infection occurs, but it is believed that salmon become infected in their time spent in the Bering Sea while feeding on other infected organisms (Kocan et al. 2004). Human cancer in Alaska Current and historical cancer rates within some areas of Alaska are higher than seen in other states throughout the United States. The incidence of malignant cancer for example from 1996 to 2004 was higher for all years compared to the US rate (O’Brien and Upton 2008). Cancer incidence (per 100 000 people) is significantly higher in the Fairbanks North Star Borough with 499 to 727 deaths occurring from 1996 to 2004. The most prominent types of cancer in the North Star Borough at that time were prostate cancer and female breast cancer (O’Brien and Upton 2008). The US national cancer incidence rate from 2002 to 2006 was approximately 541 to 560 deaths per 100 000 people (CDC 2007). No specific causality was assigned in these reports. Rather, the dominant risk factors (including tobacco, adult diet and obesity, sedentary lifestyle) known to contribute to cancer deaths were described. STRESSOR-BASED REVIEW The remote location of the Yukon River basin and its low population density result in anthropogenic sources of stress being concentrated around cities and villages along the river and its tributaries including Whitehorse, Dawson City, Fort Yukon, Tanana, and Fairbanks. Anthropogenic stressors which may result in environmental changes include the discharge of wastewater (municipal sewage) from treatment facilities, waste disposal, hard rock and placer mining, military activities, and activities associated with oil and gas develop- ment and forestry as described below. Wastewater treatment Whitehorse is home to 22 898 people and is the largest settlement in the Canadian portion of the Basin followed by Dawson City with a population of 1327 people (Statistics Canada 2006). Both communities have, at some point, discharged sewage into the Yukon River. Before 1996, Whitehorse discharged treated effluent into the Yukon River from the Porter Creek lagoon (Roach et al. 1993). When fecal coliforms were detected in Lake Laberge surface waters, Whitehorse began an upgrade to a 3-cell lagoon system with associated groundwater monitoring wells and completion occurred in 1996 (Roach et al. 1993; Cabott 2007). 432 Integr Environ Assess Manag 9, 2013—M Dube´ et al.
- 8. In 2003, Dawson City was charged by the Yukon Territorial Court under section 36(3) of the Fisheries Act for discharging harmful substances into the Yukon River from their wastewater (YG 2009a). Currently, Dawson City has primary treatment in place using rotostrainers that remove any solids greater than 0.75 mm (R v. C 2003). There is no disinfection. Samples taken from the sewage have shown high levels of ammonia, solids, pathogenic microorganisms, and detergents (R v. C 2003). From 1983 to 1996, Dawson City failed 25 of 35 LC50 toxicity tests for determining the toxicity of the effluent to fish (R v. C 2003). Tests were also failed in 2000 and 2001 (R v. C 2003). The municipality has been put under court order to build a new wastewater treatment facility that conducts secondary treatment (YG 2009a). The new secondary treatment plant was completed in December 2011 (YG 2009a). Sewage lagoons, outhouses, and ‘‘honey buckets’’ are used extensively by aboriginal communities throughout the Yukon River Basin. Many problems exist with these systems including flooding, erosion, and improper maintenance resulting in sewage discharge into surrounding water bodies (YRITWC 2002). Many communities and First Nations within the Yukon River Basin have expressed concern about their sewage treatment and the potential risk it poses to the environment and to their communities (YRITWC 2002). The Alaska Department of Environmental Conservation oversees the permitting and installation of treatments systems. Of the 47 village communities in Alaska there is currently only 1 community (Anatuvik Pass) operating under an active discharge permit. The Department does not have, or maintain, a current facility list for the 47 village communities in the Yukon River Basin. A study by Indian and Northern Affairs Canada (INAC) assessed 11 wastewater systems in First Nation communities in the Yukon (2003). Of those systems, 7 had no to minimal problems, 2 needed repairs, and 2 systems had potential health and safety concerns (INAC 2003). In Alaska, the only major wastewater treatment facility within the Yukon River Basin is located in the city of Fairbanks. Before the 1970s, there were no wastewater treatment facilities and in the late 1960s recorded coliform counts upstream from Fairbanks were 50/100 mL but down- stream they were 500 000/100 mL (Frey et al. 1970). In the 1970s, the population of Fairbanks jumped to 17 000 and a wastewater treatment system was installed (Pearson and Smith 1975). There were 5 sewage systems in total; 3 primary treatment facilities with 1 within the city, 2 at Fort Wainwright, and 2 secondary treatment facilities at the University of Alaska Fairbanks and the International Fairbanks Airport (Pearson and Smith 1975). Currently, a secondary wastewater treatment facility, called The Golden Hearts Utilities Wastewater Treatment Plant, services the city of Fairbanks as well as the University of Alaska Fairbanks, Fort Wainwright, College Utilities Corporation, and commercial septage haulers (USAI 2010). It operates under a National Pollutant Discharge Elimination System (NPDES) permit (USAI 2010). Waste disposal A potential source of contaminants within the Yukon River may be from unregulated landfills located along the river that leach into the groundwater and into the river (YRITWC 2002). Many First Nation communities and villages located along the river have expressed concern over waste disposal in their area (YRITWC 2002). In 1972 in Fairbanks, State authorities were threatening to shut down the local landfill because it did not meet required standards (Pearson and Smith 1975). It is now partially redeveloped and a new regulated landfill has been installed in another area. There are also several sites in the North where chemicals were disposed of off the record. For example, there is speculation that PCBs may have been disposed of in the Whitehorse area because of high levels of PCBs detected in Lake Laberge (Hinck et al. 2004). Mining Mining has been occurring in the basin since the mid-1800s and currently employs thousands of workers in both the Yukon and Alaska bringing in significant revenue to the economy (YRITWC 2002). The greatest environmental impact from mining operations within the Yukon River Basin is from mines that have been abandoned without site remediation. These mine sites often have elevated levels of metals and contaminants that leach into groundwater and runoff into surface water. In the Yukon, there are many abandoned mines but the ones of greatest concern are the Faro Mine, Mt. Nansen, and Clinton Creek (YG 2009b). In Alaska alone, there are over 400 abandoned mines. It is unknown how many of these impact water quality, however, the most high-risk mine openings are near Fairbanks (USDOI 2009). Two types of mining occur frequently within the Yukon River Basin; placer mining and hard rock mining. Mining within Alaska is concentrated between Eagle and Tanana with 90% placer mines and 10% lode mines (Hinck et al. 2004). The mines are concentrated near Circle, Livengood, Fairbanks, Wiseman, Eagle, and Tanana (Hinck et al. 2004). Placer mining occurs through various techniques of hydraulically separating large quantities of sediments that are brought to the surface and discharged back into the stream usually after being discharged into a settling pond (Pentz and Kostaschuk 1999). This may increase sediment deposition and affect local habitat (McLeay et al. 1987; Pentz and Kostaschuk 1999; Dornblaser and Striegl 2009). In earlier times, Hg was used to remove impurities from the Au and create a Au amalgam but it is no longer used due to its toxic effects. However, high levels of Hg are still present in fish within the Yukon River as summarized above and in Table 1 (Hinck et al. 2004). Many operations within Alaska have permission to discharge effluents into small tributaries of the Yukon including the Fortymile, Tolovana, Chatnika, Chena, Tanana, Koyukuk Rivers, Birch Creek and Yukon-Charley River confluence (Hinck et al. 2004). Smaller tributaries often have lower potential to dilute tailings discharges. Hard rock mining also occurs to a large extent in both the Yukon and Alaska. Valuable minerals are removed and waste rock (tailings) remains with some potential for seepage into local water sources (i.e., Se, Cd, Cu, and Zn) (Edmonds and Peplow 2000). Acid mine drainage is perhaps the most significant source of mine pollution. Water from precipitation or surface flow becomes contaminated when it comes in contact with mining wastes, including waste rock and tailings. As water filters through the wastes, metallic sulfides in the ore oxidize, dissolve, and release heavy metals, forming a highly Qualitative Accumulated State Assessment of the Yukon River—Integr Environ Assess Manag 9, 2013 433
- 9. acidic effluent. Effluent that contains mineral processing chemicals such as cyanide may also leak from leach pads, well seals, and pipes. Seeps from tailings impoundments represent another source of contamination. Oil and gas development and/or spills Oil development in Alaska began in the mid-1950s. When a large supply of oil was found in the North Slope in the 1960s, plans to build a pipeline were proposed. The Trans Alaska Pipeline System (TAPS) was constructed and com- plete by 1977 and carries oil 800 miles to Valdez, Alaska. It crosses the Yukon River between Stevens Village and Rampart and runs south to Fairbanks crossing many of the tributaries including the Koyukuk, Tanana, Tolovana, Chena, Salcha, and Delta Rivers (YRITWC 2002; Hinck et al. 2004). There have been 3 larger oil spills within the Basin from the pipeline; 627 000 gallons at Steele Creek in 1978, 285 000 gallons near Livengood in 2001, and several thousand barrels at pump station 9 in 2010; the latter contained in a contaminant overflow area (Mach et al. 2000; Bohrer 2010). The Trans Alaska Pipeline was built in 1974 and transports crude oil from the North Slope of Alaska to Port Valdez in Prince William Sound crossing numerous creeks and large rivers of the Yukon River basin including sensitive terrestrial and aquatic habitats (Hinck et al. 2004). Impacts attributed to pipeline operation include oil spills, water discharges, and emissions of volatile organic compounds from valves and pump stations. In December 1997, tribal leaders from the entire length of the Yukon River met in Galena, Alaska to discuss their concerns over the health of the watershed. Residents of Stevens Village, located 20 miles upstream of the Trans Alaska Pipeline crossing of the Yukon River, expressed concern about benzene emissions from the pipeline pump station (YRITWC 2002). Future plans of a natural gas pipeline do exist (Cooney 2004). Military Military presence in the North began growing during World War II with the Japanese invasion of the Aleutian Islands. Presence expanded during the Cold War when many Arctic training and air force bases were established. Function- ing bases within the Yukon River Basin currently include Fort Greely, Fort Wainwright, and Eielson Air Force Base. All 3 are located within the Tanana River basin (Hinck et al. 2004). Historical ‘‘bury it’’ or ‘‘out of site out of mind’’ disposal methods prevalent during pre-environmental assessment law resulted in leaching of contaminants from the military sites. Sites like Fort Greely’s antiballistic and cold weather training center (Walsh et al. 2003) produces concern because the Delta River watershed drains the training grounds into the Tanana River. Walsh et al. (2003) found munitions residues, relatively high concentrations of research department explo- sives (RDX), high melting explosives (HMX), trinitrotoluene (TNT), 2,4-dinitrotoluene (DNT) and 2,6-DNT, Cr, Cu, Pb, Zn, and Sb in the soils where the developmental weapons have occurred. From 1961 to 1971 the Fort Greely nuclear facility buried waste material and a leak was discovered in 1997 with site decommissioning still ongoing by the US Army (Griffeth et al. 2001). Additionally, between 1963 and 1967, a series of open-air tests of chemical and biological warfare agents were performed at the Gerstle River test site (Hummel 2005). The Fort Eielson Air Force Base in 1989 was identified as a federal ‘‘superfund’’ site due to 66 potential sources of contamination (Wilkinson et al. 2008). Contaminants in Garrison slough (located within the Tanana drainage) included; trichloroethane, toluene, ethylbenzene, xylene, tetrachloroethene, jet propellant, hydrocarbons, chlorinated VOCs, and other hazardous wastes (waste oils, solvents, etc.) (Wilkinson et al. 2008). Fish tissues from Garrison slough showed elevated concentrations of DDT, DDD, and DDE (Wilkinson et al. 2008). Bioaccumulation in migratory fish poses a potential mechanism for contaminant transport across the basin, particularly through feeding on exposed macro- invertebrates. The Chena River, which empties into the Tanana River, runs through Fort Wainwright and was placed on the list of ‘‘superfund’’ sites by the USEPA in 1990 (ADEC 2009). Taku Gardens reports 115 000 mg/kg of PCBs, munitions related debris, buried drums, scrap metal, concentrated petroleum, chlorinated solvents, herbicides, pesticides, diox- ins/furans, Pb, nitroaromatics, and propellants (ADEC 2009). All contaminants are listed as a threat to human and environmental health and remediation of the site is in progress (ADEC 2009). Historic construction projects and urban development Expansion during the Au rush and World War II resulted in use of chemicals not previously found in the Yukon. Polychlorinated biphenyls transported during construction of the Alaska Highway (INAC 2003) resulted in 3840 L of liquid PCB and 183 200 kg of PCB contaminated soil that was removed from the Yukon and disposed at Swan Hills because of the risk to human and environment health (INAC 2010). Many First Nation communities express concerns about construction contaminants, including an old railroad tie plant (Carcross Tagish First Nation), discarded barrels and vehicles at Johnson Crossing (Teslin First Nation), and barrels filled with various substances (left by the military in 1950s) scattering the banks of the Yukon River at Galena (YRITWC 2002). The significance or potential risk associated with this stressor source is unknown. Long range transport and deposition Atmospheric currents are key pathways for long-range transport of contaminants (heavy metals, organic pollutants, radionuclides) from industrial and agricultural sources to Arctic regions (Hinck et al. 2004). Global air transport is an important source of pollutant loadings to the Yukon River basin. Deposition over forming ice creates a storage and transport mechanism to the aquatic system. Typically these contaminants bioaccumulate in organisms and Arctic food chains. Hg, for example, is a key metal transported through the atmosphere to the Yukon and has been quantified in snowmelt and correlated with tissue burdens of Hg in northern pike and longnose sucker (Hinck et al. 2004). Forests Disturbances like forest fires and pest infestation occur frequently from May to September. In the Yukon Territory from 1992 to 2002, 1463 forest fires occurred in total and over 1.5 million ha burned (YCS 2003). In 2009, approx- imately 3 million acres burned in Alaska (approximately 1.2 million ha) (Lamb and Winton 2009). In 2007, a 434 Integr Environ Assess Manag 9, 2013—M Dube´ et al.
- 10. significant number of Yukon Territory white spruce were observed to be dead and dying in areas along the Yukon River (YG 2008). The cause of this initial mortality was determined to be drought but during the wet summer of 2009 an area of approximately 2546 ha along the Yukon River (YG 2008) was determined to be impacted by the Northern Spruce engraver beetle. In Alaska from 2007 to 2009, white spruce were infested with the spruce budworm along the Yukon River at the Dalton Highway Bridge (Lamb and Winton 2009). Additionally, an infestation of the willow blotch miner was noted as one of the most severe infestations in the area (YG 2008). Approximately 136 336 ha of willow were attacked by the willow leaf blotch miner with the mass of infestation occurring on the Yukon mainstem between Circle and Beaver and along the Tanana River (Lamb and Winton 2009). Forest fires and pest infestations occur commonly through forest ecosystems and should be an important stressor to consider in any cumulative effects assessment where causal sources of environmental change require consideration. Climate change Increasing temperatures in subarctic and Arctic regions have resulted in thawing of permafrost, drying of lakes, common infestations of beetles in pine tree stands, increased frequency of forest fires, and accelerated shoreline erosion (ACIA 2004; Prowse et al. 2006). These changes will dramatically alter wildlife habitats and threaten traditional lifestyles of Indigenous peoples. Alaska and northwestern Canada, in particular, have been experiencing some of the largest increases in ambient temperature of any region on the planet. Evidence suggests that freshwater flow from the Arctic’s major rivers is increasing as average air temperatures rise (Peterson et al. 2002). Alterations in flow is one vulnerability associated with climate change that could subsequently alter pH of the Yukon River and its tributaries, influencing the solubility and chemical speciation of the various constituents, particularly metals (Environment Yukon 2011). Moreover, with increasing permafrost thaw, loads of N (organic and inorganic) may increase. On the pan-Arctic scale, the Yukon River is fundamental to the function of the Bering Sea and Bering Strait ecosystems (Lisitsysn 1969; Opsahl et al. 1999; Hansell et al. 2004). Therefore, impacts to the Yukon River have implications for the circulation and species distribution in the coastal zone of the Yukon-Kuskokwim Delta (an area the size of Massachu- setts), and for large-scale fisheries and marine ecosystems in the Bering Sea, Bering Strait, and Arctic Sea. Increases in freshwater runoff are expected to affect ocean stratification, circulation, and global climate processes through the slowing of the thermohaline circulation (Schiller et al. 1997; Weaver et al. 1999; Ottera˚ et al. 2003). ACCUMULATED STATE ASSESSMENT An accumulated state assessment is one element necessary to conduct a watershed CEA where changes are measured in an aquatic system over time and space. This information is critical to understand the level of existing environmental deterioration. Ideally, this is done quantitatively using regional monitoring data and statistical determinations of change relative to a defined benchmark of ‘‘normal’’ based on natural variation (Dube´ et al. 2013a, 2013b, this issue). Regional monitoring databases do not commonly exist but their importance for CEA is being recognized (Main et al. 2011; Wrona et al. 2011). Often for assessments of this kind, integration of many different sources of data are required (Squires et al. 2010). In this article, we illustrate the value of conducting a literature review as a qualitative accumulated state assessment to support more quantitative assessments (see Dube´ et al. 2013a, 2013b, this issue). In this light, this literature review has identified a total of 7 ‘‘hot spot’’ areas of change in the Yukon River Basin (Figure 1). These areas include Lake Laberge, Yukon River at Dawson City, the Charley and Yukon River confluence, Porcupine and Yukon River confluence, Yukon River at the Dalton Highway Bridge, Tolovana River near Tolovana, and Tanana River at Fairbanks. Lake Laberge Lake Laberge was identified as a hot spot because of historical contamination, from the 1940s and 1960s, and waterborne contamination of surface waters. Since the mid- 1990s, levels of contaminants in fish tissues have declined (Hinck et al. 2004) although PCBs, DDT (and derivates), and toxaphene can still be found in fish tissue and soil around the area (Table 1.3, 1.4, and 1.5). In addition, toxaphene measured in burbot liver continues to exceed threshold levels for human consumption (Hinck et al. 2004). Risk is increased by Whitehorse’s action to resume discharge of wastewater discharge after Giardia cysts and Cryptosporidium oocytes were found in the surface waters of Lake Laberge (Table 1.7 and 1.8). These studies were conducted in 1993 and it is unclear of the ongoing risk to humans who drink untreated water from Lake Laberge in the absence of more recent monitoring or publications. The Yukon River including Lake Laberge is a location of extensive tourism, kayaking, canoeing, and hiking. The Yukon River Quest and Yukon 1000 canoe and kayak races, for example, are the longest races of their kind bringing competitors from around the world. In 2010 and 2011, Dr. M. Dube´, an author of this article, participated as a scientist during these events and was aggressively challenged by guides and journalists who accompanied her when she required water treatment for racers as a basic health and safety consideration in the absence of more recent data (Casey 2011). Clearly the need for accumulated state assessments has direct relevance to understanding river health and supporting use of the river watershed for recreation and tourism. Risk cannot be accurately assessed in the absence of more recent data to confirm the efficacy of municipal effluent treatment. Yukon River at Dawson City Dawson City is a hotspot along the river because of the quality of effluent discharged from the wastewater treatment facility. The city itself is small, and the direct impacts of the effluent on the Yukon River are not known. For several months of the year, the effluent fails toxicity tests and elevated bacterial levels exist (R v. C 2003). The new secondary wastewater treatment facility should produce a treated effluent that meets water quality standards and this should be confirmed with follow-up monitoring. Yukon River near the Charley-Kandik river confluence The Charley-Kandik (C-K) river confluence location had Se in fish tissues that exceeded guidelines (0.6 mg/g) for the Qualitative Accumulated State Assessment of the Yukon River—Integr Environ Assess Manag 9, 2013 435
- 11. protection of piscivorous wildlife (Hinck et al. 2004). Toxaphene was highest in a northern pike and levels approached thresholds (35–900 ng/g) for growth and repro- ductive failure in freshwater fish. Toxaphene use as a pesticide historically may account for elevated levels although long-range transport may also be a factor. Increased mining activity between Eagle and Tanana may also be a factor contributing to increased Se concentrations. Porcupine and Yukon River confluence The Porcupine River is one of the few areas within the basin that is underlain by a continuous layer of permafrost. The permafrost in this area is deteriorating and is accom- panied by thermokarst formation and in some areas surface waters underlain with permafrost have drained (Striegl et al. 2007). Furthermore, from 2001 to 2005 average annual flows in the Porcupine River were 15% lower than the 19-year average (Table 1:1.12). Changes in permafrost coverage could be affecting groundwater and river flow dynamics thereby affecting the biogeochemical cycles. Such a change could disturb the Yukon River’s productivity through altering C and nutrient cycling. Yukon River at the Dalton Highway Bridge The Dalton Highway Bridge is the location where the Trans Alaska pipeline crosses the Yukon River. In 1978, 55 gallon oil drums were reported downstream of the bridge a year after construction was completed (Dapkus et al. 1978). Hinck et al. (2006) found that all pike sampled in this area had levels of Hg exceeding 0.3 mg/g (Table 1:1.2). Se levels were also exceedingly high and approached levels dangerous to piscivorous wildlife (Table 1:1.1). White spruce infestation in this area yields an altered forest leading to a modification of C and nutrient unloading. Tanana River at Fairbanks and Nenana and Tolovana River at Tolovana The Tanana River is one of the major tributaries of the Yukon River and the Tolovana River drains into the Tanana. Military, mining, oil and gas development, and municipal wastewater discharge have affected these rivers and climate change is altering groundwater inputs and average annual flows (Table 1:1.12, 1.13, and 1.14). High levels of Hg, Se, PCB, and DDT were detected in fish within the Tanana River with the high levels of PCB, DDT, and Se at Fairbanks. The Tolovana River at Tolovana also showed high levels of Hg, toxaphene, and DDT. Elevated cancer rates in Fairbanks North Star Borough (includes Fairbanks and Tolovana residents) were also reported confirming the need for research to explore potential causal links. Military facilities at Fort Greely, Fort Wainwright, and the Eielson Air Force Base have released chemicals of concern that remain in soils and surface waters in the area. Mining in the area, around Fairbanks and near Tolovana and effluents discharged into tributaries of the Tanana River require monitoring. The Trans Alaska pipeline traverses through this area as well and 2 significant spills have occurred at Livengood near the Tolovana River and Pump station 9. The Tanana River is fairly sensitive to climate change as its headwaters originate in the mountains, in the southern portion of the basin, where alpine glaciers and perennial snowfields are receding (Striegl et al. 2007). Average annual flows have increased over a 4-year period from 2001 to 2005 (Table 1:1.12) and at Nenana ground- water input also increased significantly (Table 1:1.14). Increases in groundwater input and changes in stream flow will alter sediment discharge rates and biogeochemical cycles within this river and the Yukon River. CONCLUDING COMMENTS The assessment of cumulative change in river systems has been significantly affected by a lack of methodology and most certainly by a lack of data at the temporal and spatial scales required. To facilitate an accumulated state assessment for the Yukon River basin, a critical literature review was conducted and 6 hot spots were identified where further investigation is required. Climate change, long-range transport, mining, past use of chemicals for pest control, sewage discharges, and military operation have occurred in the basin and contributed to contamination of fish and surface waters, altered hydrol- ogy, and shifted in biogeochemical loads. Although a river ecosystem travels on a geological time scale, impacts from human activities from a short time period can have significant and lasting effects (e.g., spraying in the 1950s continues to affect chemical levels measured in 2000s) as evidenced in the Yukon basin. Limitation of data and knowledge to assess cumulative change is currently our most significant challenge. The Indigenous people of the Yukon River Basin have an extensive oral history and hands-on experience that encompasses both the published reports and direct experience. Because knowledge transmission, within Indigenous society, occurs through cultural mediums there exists an unknown amount of information that has never been reported in formal literature. Our understanding of regional influences on system-wide ecological balance does not, or even attempt, to account for Indigenous knowledge of change. Thus, analysis of effects in the Yukon River Basin would greatly benefit from a mechanism that bridges multiple knowledge systems (Western and Indigenous). Acknowledgment—Funding was provided by the Canadian Water Network (Dube´). We thank Vince McMullin, Elise Pietroniro, and Jeff Lettvenuk. REFERENCES [ACIA] Arctic Climate Impact Assessment. 2004. Impacts of a warming Arctic: Arctic climate impact assessment. Cambridge, UK: Cambridge University Press. 140 p. [ADEC] Alaska Department of Environmental Conservation. 2009. Division of spill prevention and response: contaminated sites program. Fort Wainwright, Taku Garden (102 Communications Site). [cited 2010 June 8]. Available from: www.dec.state.ak.us/spar/csp/sites/ftwainwright.htm#info Bohrer B. 2010. Alaska oil pipeline shuts off after spill [Internet]. [cited 2010 June 8]. Whitehorse Star, 12. Canadian Newsstand Prairies. (Document ID: 2046166991). Available from: http://www.cbn.com/cbnnews/us/2010/May/ Alaskan-Pipeline-Shut-Down-After-Oil-Spill Brabets TP, Schuster PF. 2008. Transport of water, carbon, and sediment through the Yukon River Basin. Anchorage (AK): US Geological Survey. Fact Sheet 2008- 3005. Brabets TP, Walvoord MA. 2009. Trends in streamflow in the Yukon River Basin from 1944 to 2005 and the influence of the Pacific Decadal Oscillation. J Hydrol 371:108–119. Brabets TP, Wang B, Meade RH. 2000. Environmental and hydrologic overview of the Yukon River basin, Alaska and Canada. Anchorage (AK): US Geological Survey. Water-Resources Investigations Report 99-4204. 436 Integr Environ Assess Manag 9, 2013—M Dube´ et al.
- 12. Braune B, Muir D, DeMarch B, Gamberg M, Poole K, Currie R, Dodd M, Duschenko W, Eamer J, Elkin B. 1999. Spatial and temporal trends of contaminants in Canadian Arctic and terrestrial ecosystems: A review. Sci Total Environ 230:145–208. Cabott L. 2007. City of Whitehorse Integrated Community Sustainability Plan. [cited 2010 August 23]. Available from: http://www.city.whitehorse.yk.ca Casey A. 2011. Environmental Scientist of the Year Award 2011. In: Canadian Geographic: Protecting Our Water. June 2011. Available from: http:// www.canadiangeographic.ca/magazine/jun11 [CDC] Centers for Disease Control and Prevention. 2007. US cancer statistics: An interactive atlas. [cited 2010 August 20]. Available from: http://apps.nccd. cdc.gov/DCPC_INCA/DCPC_INCA.aspx Coleman JM, Huh OK, Braud D Jr. 2008. Wetland loss in world deltas. J Coast Res 24:1–14. Cooney S. 2004. Proposed Alaska natural gas pipelines: Potential impacts on the steel industry. Congressional Research Service Report for Congress. Order Code RL31888. [cited 2010 August 23]. Available from: http://ncseonline.org/NLE/ CRSreports/04Feb/RL31888.pdf Dapkus D, Gabriel B, O’Sullivan T, Pruex W, Motoya P, Crenshaw R. 1978. Field inspection of the Yukon River (Rampart) June 5-12, 1978. Heritage Conservation and Recreation Service, Division of Parks and Bureau of Land Management Fairbanks District. Diamond ML, Bhavsar SP, Hel PA, Stern GA, Alaee M. 2005. Fate of organochlorine contaminants in Arctic and subarctic lakes estimated by mass balance modeling. Sci Total Environ 342:245–259. Dornblaser MM, Striegl RG. 2007. Nutrient (N, P) loads and yields at multiple scales and subbasin types in the Yukon River basin, Alaska. J Geophys Res-Biogeosci 112:10–20. Dornblaser MM, Striegl RG. 2009. Suspended sediment and carbonate transport in the Yukon River Basin, Alaska: Fluxes and potential future responses to climate change. Water Resour Res 45:12–24. Dube´ MG. 2003. Cumulative effect assessment in Canada: A regional framework for aquatic ecosystems. Environ Impact Assess 23:723–745. Dube´ M, Munkittrick K. 2001. Integration of effects-based and stress-based approaches into a holistic framework for cumulative effects assessment in aquatic ecosystems. Hum Ecol Risk Assess 7:247–258. Dube´ M, Wilson J, Waterhouse J. 2013a. Accumulated state of the Yukon River watershed: Part II quantitative effects-based analysis integrating Western science with Traditional Ecological Knowledge. Integrated Environ Assess Manag 9:439–455. Dube´ M, Duinker P, Greig L, Carver M, Servos M, McMaster M, Noble B, Schreier H, Jackson L, Munkittrick K. 2013b. A framework for assessing cumulative effects in Canadian watersheds. Integrated Environ Assess Manag 9:363– 369. Duffy LK, Rodger T, Patton M. 1998. Regional health assessment relating to mercury content of fish caught in the Yukon-Kuskokwim Delta rivers system. Alaska Med 40:75–77. Eberl DD. 2004. Quantitative mineralogy of the Yukon River system: Changes with reach and season, and determining sediment provenance. Am Mineral 89: 1784–1794. Edmonds R, Peplow D. 2000. Environmental impacts of hardrock mining in eastern Washington. [cited 2010 August 23]. Available from: www.cfr.washington. edu/research/factSheets/08-CSSminingimpacts.pdf Environment Yukon. 2011. Yukon water: A summary of climate change vulnerabilities. Whitehorse, Yukon. ISBN 978-1-55362- 516-2. Frey PJ, Mueller EW, Berry EC. 1970. The Chena River: A study of a subarctic stream. Reference project no. 1610-10/70. Fairbanks (AK): Federal Water Quality Administration. Griffeth L, Orr A, Splain W, Kelley J, Dasher D, Read S, Barnes D. 2001. Radiation in the environment. [cited 2010 August 24]. Available from: http://www.ims.uaf. edu/orion/publications/images/poster_radiation.pdf Guo LD, Zhang JZ, Gueguen C. 2004. Speciation and fluxes of nutrients (N, P, Si) from the upper Yukon River. Global Biogeochem Cy 18:12–24. Hansell DA, Kadko D, Bates NR. 2004. Degradation of terrigenous dissolved organic carbon in the western Arctic Ocean. Science 304:858–861. Hinck JE, Bartish TM, Blazer VS, Denslow ND, Gross TS, Myers MS, Anderson PJ, Orazio CE, Tillitt DE. 2004. Biomonitoring Environmental Status and Trends (BEST) program: Environmental contaminants and their effect on fish in the Yukon River basin. SIR 2004-5285. Columbia (MO): US Geological Survey, Biologic Resources Division. Hinck JE, Schmitt CJ, Echols KR, May TW, Orazio CE, Tillitt DE. 2006. Environmental contaminants in fish and their associated risk to piscivorous wildlife in the Yukon River basin, Alaska. Arch Environ Contam Toxicol 51:661–672. Houser S, Teller V, MacCracken M, Gough R, Spears P. 2001. Potential consequences of climate variability and change for Native Peoples and Native homelands. National Assessment Synthesis Team for the US Global Change Research Program. Cambridge, UK: Cambridge University Press. p 351–377. Hummel LJ. 2005. The US Military as geographical agent: The case of Cold War Alaska. Geogr Rev 95:47–72. [INAC] Indian and Northern Affairs Canada. 2003. National assessment of water and wastewater systems in First Nations communities: Summary report. [cited 2010 August 2]. Available from: http://www.ainc-inac.gc.ca/enr/wtr/pubs/ watw/watw-eng.asp [INAC] Indian and Northern Affairs Canada. 2010. Persistent organic pollutants (POPs) fact sheet series: Polychlorinated biphenyls. [cited 2010 August 24]. Available from: http://www.ainc-inac.gc.ca/ai/scr/yt/pubs/2010fs/pcbs-eng.asp Jewett SC, Zhang XM, Naidu AS, Kelley JJ, Dasher D, Duffy LK. 2003. Comparison of mercury and methylmercury in northern pike and Arctic grayling from western Alaska Rivers. Chemosphere 50:383–392. Kilgour BW, Dube´ MG, Hedley K, Portt CB, Munkittrick KR. 2006. Aquatic environmental effects monitoring guidance for environmental assessment practitioners. Environ Monitor Assess 130:423–36. Kocan R, Hershberger P. 2006. Differences in Ichthyophonus prevalence and infection severity between upper Yukon River and Tanana River chinook salmon, Oncorhynchus tshawytscha (Walbaum), stocks. J Fish Dis 29:497–503. Kocan R, Hershberger P, Winton J. 2004. Ichthyophoniasis: An emerging disease of chinook salmon in the Yukon River. J Aquat Anim Health 16:58–72. Kruse GH. 1998. Salmon run failures in 1997-1998 : A link to anomalous ocean conditions? Alaska Fish Res Bull 5:55–63. Lamb M, Winton L. editors 2009. Forest Health Conditions in Alaska—009. Anchorage (AK): U.S. Forest Service, Department of Agriculture, Alaska Region, Forest Health. Protection. R10-PR-21. LePage P. 2009. Appendix F: Benthic Monitoring Program Report. Georgetown (ON): Minnow Environmental. Project Reference: 2230. Lisitsysn AP. 1969. Recent sedimentation in the Bering Sea (in Russian). Jerusalem, Israel: Program for Science Translation. Mach JL, Sandefur PE, Lee JH. 2000. Estimation of oil spill risk from Alaska north slope, Trans Alaska Pipeline, and Arctic Canada oil spill data sets. Anchorage (AK): Hart Crowser. OCS Study MMS 2000-07. Main C, Burn D, Dixon G, Dube´ MG, Flotemersch J, Franzin WG, Gibson J, Munkittrick KR, Post J, Watmough S. 2011. 2010 Regional Aquatics Monitoring Program (RAMP) review. Technical Report of the RAMP Review Panel, Integrated Water Management Program, Alberta Innovates— Technology Futures. Calgary (AB): Alberta Innovates Technology Futures. 20 p. McLeay DJ, Birtwell IK, Hartman GF, Ennis GL. 1987. Responses of Arctic grayling (Thymallus arcticus) to acute and prolonged exposure to Yukon placer mining sediment. Can J Fish Aquat Sci 44:658–673. Mueller KA, Matz AC. 2000. Organochlorine concentrations in burbot (Lota lota) livers from Fairbanks, Alaska, and Kanuti, Tetlin and Yukon Flats National Wildlife Refuges, Alaska, 1998. Fairbanks (AK): US Fish and Wildlife Service. Technical Report NAES-TR- 00-001. 49 p. Nilsson C, Reidy CA, Dynesius M, Revenga C. 2005. Fragmentation and flow regulation of the world’s large river systems. Science 308:405–408. O’Brien DK, Upton L. 2008. Cancer incidence and mortality in Alaska, 1996-2004. Anchorage (AK): Alaska Department of Health and Social Services, Section of Chronic Disease and. Health Promotion, Alaska Cancer Registry. 60 p. Opsahl S, Benner R, Amon RMW. 1999. Major flux of terrigenous dissolved organic matter through the Arctic Ocean. Limnol Oceanogr 44:2017–2023. Osterkamp TE. 2005. The recent warming of permafrost in Alaska. Global Planet Change 49:187–202. Qualitative Accumulated State Assessment of the Yukon River—Integr Environ Assess Manag 9, 2013 437
- 13. Ottera˚ OH, Drange H, Bentsen M, Kvamstø NG, Jiang D. 2003. The sensitivity of the present-day Atlantic meridional overturning circulation to freshwater forcing. Geophys Res Lett 30:1898–1902. Pearson RW, Smith DW. 1975. Fairbanks: A study of environmental quality. Arctic 28:99–109. Pentz SB, Kostaschuk RA. 1999. Effect of placer mining of suspended sediment in reaches of sensitive fish habitat. Environ Geol 37:78–89. Peterson BJ, Holmes RM, McClelland JW, Vorosmarty CJ, Lammers RB, Shiklomanov AI, Rahmstorf S. 2002. Increasing river discharge to the Arctic Ocean. Science 298:2171–2173. Prowse TD, Wrona FJ, Reist JD, Gibson JJ, Hobbie JE, Levesque LMJ, Vincent WF. 2006. Climate change effects on hydroecology of Arctic freshwater ecosystems. Ambio 35:347–358. Rawn DFK, Lockhart WL, Wilkinson P, Savoie DA, Rosenberg GB, Muir DCG. 2001. Historical contamination of Yukon Lake sediments by PCBs and organochlorine pesticides: Influence of local sources and watershed characteristics. Sci Total Environ 280:17–37. Raymond PA, McClelland JW, Holmes RM, Zhulidov AV, Mull K, Peterson BJ, Striegl RG, Aiken GR, Gurtovaya TY. 2007. Flux and age of dissolved organic carbon exported to the Arctic Ocean: A carbon isotopic study of the five largest arctic rivers. Global Biogeochem Cy 21:9–18. Roach PD, Olson ME, Whitley G, Wallis PM. 1993. Waterborne Giardia cysts and Cryptosporidium oocysts in the Yukon, Canada. Appl Environ Microb 59: 67–73. [R v. C] R. vs. City of Dawson. 2003. YKTC 18. Court document: http:// www.yukoncourts.ca/judgements/territorial/2003/r_v_cityofdawson_2003_ yktc_16.pdf [SAE] State of Alaska Epidemiology. 2001. Mercury and national fish advisories statement from Alaska Division of Public Health: Recommendations for fish consumption in Alaska. [cited 2010 August 19]. Available from: www.epi.hss. state.ak.us/bulletins/docs/b2001_06.htm Schiller A, Mikolajewicz U, Voss R. 1997. The stability of the North Atlantic thermohaline circulation in a coupled ocean-atmosphere general circulation model. Clim Dynam 13:325–347. Squires AJ, Westbrook CJ, Dube´ MG. 2010. An approach for assessing cumulative effects in a model river, the Athabasca River Basin. Integr Environ Assess Manag 6:119–134. Statistics Canada. 2006. Population and dwelling counts, for Canada, provinces and territories, and census subdivisions (municipalities), 2006 census. [cited 2010 August 23]. Available from: www12.statcan.gc.ca/census-recensement/ 2006/ref/index-eng.cfm Striegl RG, Aiken GR, Dornblaser MM, Raymond PA, Wickland KP. 2005. A decrease in discharge-normalized DOC export by the Yukon River during summer through autumn. Geophys Res Lett 32:L21413. Striegl RG, Dornblaser MM, Aiken GR, Wickland KP, Raymond PA. 2007. Carbon export and cycling by the Yukon, Tanana, and Porcupine rivers, Alaska, 2001- 2005. Water Resour Res 43:2–11. [USAI] Utility Services of Alaska. 2010. Wastewater treatment. [cited 2010 August 10]. Available from: http://www.akwater.com/wastewater_treatment.shtml [USDOI] US Department of the Interior. 2009. Project case study: Alaska. Bureau of Land Management. [cited 2010 August 10]. Available from: http://www. blm.gov/wo/st/en/prog/more/Abandoned_Mine_Lands/Environment_Water/ case_studies_by_state/project_case_study0.html [USEPA] US Environmental Protection Agency. 2000. Improved enumeration method for the recreational water quality indicators: Enterococci and Escherichia coli. Washington (DC): Office of Science and Technology. EPA/ 821/R-97/004. Voytek MA, Ashen JB, Fogarty LR, Kirshtein JD, Landa ER. 2005. Detection of Helicobacter pylori and fecal indicator bacteria in five North American Rivers. J Water Health 3:405–422. Walsh ME, Collins CM, Jenkins TF, Hewitt AD, Stark J, Myers K. 2003. Sampling for explosives-residues at Fort Greely, Alaska. Soil Sed Contam 12:631–634. Walvoord MA, Striegl RG. 2007. Increased groundwater to stream discharge from permafrost thawing in the Yukon River basin: Potential impacts on lateral export of carbon and nitrogen. Geophys Res Lett 34:6–12. Weaver AJ, Bitz CM, Fanning AF, Holland MM. 1999. Thermohaline circulation: High-latitude phenomena and the difference between the Pacific and Atlantic. Annu Rev Earth Pl Sc 27:231–285. Wilkinson M, Pang J, Harding J. 2008. Five Year ROD Review Report, Eielson Air Force Base, Alaska. Springfield (VA), USA: The United States Air Force Installation Restoration Program. FA8903-04-D-8685-0009. Wrona FJ, di Cenzo P, Baird D, Banic C, Bickerton G, Burn D, Dillon P, Droppo I, Dube´ M, Hazewinkel R., et al. 2011. Lower Athabasca Water Quality Monitoring Program, PHASE 1, Athabasca River Mainstem and Major Tributaries. Ottawa: Environment Canada. 81 p. [YCS] Yukon Community Services. 2003. Devolution fact sheet: Fire Management Program. [cited 2010 August 23]. Available from: http://www.community. gov.yk.ca/pdf/factsheet2.pdf Yeardley RB, Lazorchal JM, Paulsen SG. 1998. Elemental fish tissue contamination in northeastern US lakes: Evaluation of an approach to regional assessment. Environ Toxicol Chem 17:1874–1884. [YG] Yukon Government. 2008. Yukon Forest Health Report 2008. Forestry Management and Energy, Mines and Resources. [cited 2010 August 23]. Available from: http://www.emr.gov.yk.ca/forestry/pdf/forest_health_report 2008.pdf [YG] Yukon Government. 2009a. Dawson City wastewater treatment project backgrounder/timeline. [cited 2010 August 23]. Available from: www.dawsonwastewater.ca/projectoverview.html [YG] Yukon Government. 2009b. Yukon energy, mines and resources: Assessment and abandoned mines. [cited 2010 August 10]. Available from: http:// www.emr.gov.yk.ca/aam/ [YRITWC] Yukon River Inter-Tribal Watershed Council. 2002. Yukon River unified watershed assessment. [cited 2010 August 23]. Available from: http:// www.yritwc.org/Media/Publications/tabid/80/Default.aspx 438 Integr Environ Assess Manag 9, 2013—M Dube´ et al.