SlideShare a Scribd company logo
1 of 43
Global Stressors
on Water Quality
and Quantity
Growing population and
wealth will impact sustain-
ability, technology selection,
and governance strategies
related to water issues.
J U L I E BE T H Z I M M E R M A N
YA L E U N I V E R SI T Y
JA M E S R . M I H E L C IC
M IC H IG A N T EC H NOLO GIC A L U N I V E R SI T Y
JA M E S SM I T H
U N I V E R SI T Y OF V I RGI N I A
This inequality is especially critical for Asia, which
has 60% of the world’s population but only 36% of
the world’s water. Water quality in terms of pollutant
loading also is not distributed equally and is related
to the type of use and a country’s level of develop-
ment (Figure 2). Developing countries often have
less capacity to improve water quality and depend
on lower-quality water for a variety of uses, includ-
ing drinking water.
To capture an overall picture of a nation’s water
use, researchers calculate the national water foot-
print; this represents the total volume of freshwater
used to produce the goods and services consumed
by a population and the impact of globalization by
F
or more than a decade, the scientific com-
munity as well as nongovernmental orga-
nizations have sought to raise an alarm
concerning the unsustainable use of the
planet’s available water resources (1). Rising
world populations and consumption are inexorably
increasing human demand for domestic, industrial,
and agricultural water. Population and wealth along
with other global stressors will have a direct and
significant impact on the sustainability goals, tech-
nology selection, and governance strategies that are
related to water quality and quantity.
On a global basis, ~70% of freshwater is currently
used for crop irrigation, ~20% for industrial purpos-
es, and ~10% for domestic purposes (2). However, wa-
ter use varies dramatically from one part of the world
to another. Egypt, for example, uses 98% of its water
for irrigation, leaving only ~27 L/capita-day for do-
mestic use. In contrast, the U.S. uses 40% of its water
for irrigation, and domestic water use exceeds 410 L/
capita-day. In refugee camps in Africa and Asia, resi-
dents may receive only 15 L/capita-day for both con-
sumption and hygiene. For comparison, the World
Health Organization defines reasonable access as
the availability of at least 20 L/capita-day from a
source within 1 km of the user’s dwelling (3).
Although the quantity of water used varies by
region, water is not distributed equally (Figure 1).
© 20 08 American Chemical Society
is
t
o
c
k
p
h
o
t
o
June 15, 20 0 8 / env ironmentA l SCienC e & t eChnology ■
4247
accounting for water across the life cycle of imports
and exports (5). Water use is measured in terms of
water volumes consumed (evaporated) or pollut-
ed per unit of time. In this way, it is similar to the
concept of “virtual” water, because it accounts for
water use associated with consuming agricultural
and industrial imports. For the period of 1997–2001,
the global water footprint was 1243 m3/capita-year,
16% of which was the external water footprint (as-
sociated with importing goods and services for
consumption; 5). However, some countries have ex-
ternal footprints that account for 50–80% of their to-
tal footprint, whereas other countries—for example,
some countries in Africa—have external footprints
near zero (Figure 3).
Given the current state of global water interde-
pendence, water will become even more critical and
difficult to manage under highly variable future sce-
narios that involve numerous interconnected global
stressors. In this article, we examine the individu-
al and integrated effects of several important stres-
sors on the global water resource: population and
consumption, demographic and land-use changes,
urbanization, and of course climate change, all of
which can contribute to changes in quality, quan-
tity, and availability of water (7). We then explore
the relationships between these stressors and the
design, development, and implementation of tech-
nology and governance strategies for sustainable
water systems in a dynamic world.
Water stressors
Increased stresses on the world’s water are affect-
ing quality, quantity, and availability. Many studies
have predicted that climate change will affect water
supply and use (8–10). Water scarcity felt by 20% of
the 1 billion people who are estimated to experi-
ence shortages by 2025 is projected to be the direct
effect of climate change (11). The Intergovernmental
Panel on Climate Change has summarized impacts
on water resources that are expected by the mid to
late 21st century (Table 1; 12).
According to the best estimates associated with
climate change, 75% of the earth’s land area will ex-
perience increases in runoff compared with 1995
F I G U R E 1
Water for people
Global overview of water availability vs population (data from
Ref. 4).
F I G U R E 2
Water quality
Annual biochemical oxygen demand (BoD) loading in global
water-
ways by sector as an indicator for water quality for 1995 and
esti-
mated for 2010 and 2020. the data are compared for
organisation for
Economic co-operation and Development (oEcD) countries and
non-
oEcD countries (4).
BOD loading to waterways by sector
1995 2010 2020
Megatons
0 50 100 150 200
Industry
Household
Agriculture
Industry
Household
Agriculture
N
on
-O
EC
D
O
EC
D
4248 ■ environmentAl SCienCe & teChnology / June 15, 2008
15%
North and Central
America
South
America
Africa
Percentage of the
world’s water
Percentage of the
world’s population
8%
5%
Australia and
Oceania
<1%
26% 6%
Europe
8% 13%
11% 13%
Asia
36% 60%
levels, and 25% will experience decreases (8). Higher
variability in precipitation and runoff impacts ero-
sion and sedimentation. This particular impact of
climate will be exacerbated by changes in land use
that result in sedimentation as-
sociated with loss of forested
riparian cover along streams,
filling of wetlands, and agri-
cultural practices. The coast-
al–urban interface is especially
vulnerable to the impact of these
integrated stressors because the
average population density in
these fragile areas is twice the
global average. These exam-
ples demonstrate the complex
and unresolved links between
individual stressors. Although
the environmental and human
response to integrated stressors
is still largely unknown, the best
strategy to achieve sustainable
water systems is likely one that
considers the stressors as a sys-
tem with positive and negative
feedback loops, synergies, and
interferences.
Figure 4 depicts trends from
1750 to 2000 of some major
stressors on water quality and
quantity. We note the common
shape to all these stressors and
resulting impacts—it mirrors
the shape of a hockey stick.
Stressors are depicted in Fig-
ures 4a–4f. Two resulting changes that are occur-
ring globally are also illustrated: the use of water
(Figure 4g) and the deterioration of water quality
as indicated by nitrogen loading (Figure 4h). Fig-
F I G U R E 3
Water for trade
National virtual-water balances related to the international trade
of products for 1997–2001. Net exporters are
shown in green, and net importers are shown in red (6).
–100 to –50
–50 to –25
–25 to –10
–10 to – 5
–5 to 0
0 to 5
5 to 25
25 to 50
50 to 100
No data
Net virtual-water import (Gm3/yr)
T A B L E 1
Possible impacts of climate change on water resources project-
ed for the mid to late 21st century1
Phenomena and
direction of trends
Likelihood
of future
trends2 Major impact(s)
over most land areas, warmer and
fewer cold days and nights as well
as warmer and more frequent hot
days and nights
Virtually
certain
Effects on water resources that
rely on snowmelt; effects on
some water supplies
Warm spells/heat waves; frequen-
cy increases over most land areas
Very likely increased water demand;
water-quality problems (e.g.,
algal blooms)
heavy precipitation events; fre-
quency increases over most areas
Very likely Adverse effects on quality of
surface water and groundwater;
contamination of water supply;
water scarcity may be relieved
Area affected by drought
increases
Likely More widespread water stress
intense tropical cyclone activity
increases
Likely power outages causing disrup-
tion of public water supply
increased incidence of extreme
high sea level (excludes tsunamis)
Likely Decreased freshwater availabili-
ty due to saltwater intrusion
1table spM.1 in Ref. 12.
2these projections are for the 21st centur y and are based on
the special Repor t on Emissions scenarios.
June 15, 20 0 8 / env ironmentA l SCienC e & t eChnology ■
4249
ure 4 shows that changes are occurring on a global
scale and, more importantly, that the rate of change
is increasing. Furthermore, as shown in Figure 5, the
spatial scale that will be affected by water-quality
and -quantity challenges is also increasing. That is,
the impacts of the stressors are increasing, and both
the number of locations and the
number of people that will be af-
fected by these stressors in terms
of water quality and quantity are
increasing.
One challenge to both the sci-
entific community and govern-
ments is that the impacts of global
stressors are not independent (Ta-
ble 2). The link between energy
generation from fossil fuels and
climate change is a clear exam-
ple. Previously, we discussed the
impacts that climate change, land
use, and population have on wa-
ter quality in terms of sedimen-
tation. Another example would
be that as the stress of globaliza-
tion progresses, the external wa-
ter footprints of many countries
(the part of the footprint that is
served by other countries) will
become even more significant
because of greater importation
of goods and services. Similarly,
as societies develop, they tend to
increase water and energy con-
sumption (13).
The stressors and impacts
of the “hockey-stick world” to
come suggest that we need to
expand our design consider-
ations in infrastructure systems
for water and sanitation, which
typically have useful lifetimes
meant to last for decades (and
often function beyond their de-
signed lifetime). We also need to
acknowledge that the conditions
in which the design will function
over its life cycle will take place
in a world of rapid and increasing
change. Recognition of this inter-
connectedness has led the Afri-
can Development Bank and other
development organizations (14) to
agree that integrating adaptation
responses into development plan-
ning, which includes improve-
ments in water and sanitation,
is an important way to address
climate change impacts on the
poor. For example, is a sanitary
sewer an appropriate technology
in a city that will become water-
scarce by 2025? Sewers require
on average up to 75 L/capita-day,
whereas other sanitation technol-
ogies are available that require no water (15). Sew-
ers can also distribute nutrients over a wide spatial
scale, whereas other sanitation technologies can
consolidate nutrients at the community level. And
if a sewer project is deemed appropriate today, what
should the community do to prepare for future ef-
F I G U R E 4
Global water stressors
Global trends over time of stressors (a–f) and the corresponding
trends in water quanti-
ty and quality (g–h). (a–e, g, and h adapted with permission
from Ref. 16; f adapted with
permission from Ref. 13.)
Pe
op
le
(b
ill
io
n)
17
50
18
00
18
50
19
00
19
50
20
00
Population
(a) (b)
(c) (d)
(e) (f)
(g) (h)
Year
7
6
5
4
3
2
1
0
Pe
rc
en
ta
ge
o
f t
ot
al
la
nd
a
re
a
17
50
18
00
18
50
19
00
19
50
20
00
Amount of domesticated land
Year
50
25
0
CO
2
(p
pm
v)
17
50
18
00
18
50
19
00
19
50
20
00
CO2
Year
360
340
320
300
280
0
km
3 /
yr
17
50
18
00
18
50
19
00
19
50
20
00
Water use
Year
6000
4000
2000
0
Pe
rc
en
ta
ge
o
f 1
70
0
va
lu
e
Q
ua
dr
ill
io
n
B
TU
17
50
18
00
18
50
19
00
19
50
20
00
Loss of tropical rain
forest and woodland
Year
35
30
25
20
15
10
5
0
N
itr
og
en
fl
ux
(1
01
2
m
ol
es
/y
r)
17
50
18
00
18
50
19
00
19
50
20
00
Nitrogen flux to
coastal zone
Year
10
8
6
4
2
0
17
50
18
50
18
00
19
00
19
50
20
00
Total energy consumption
Year
500
400
300
200
100
0
19
90
In
te
rn
at
io
na
l
do
lla
rs
(1
01
2 )
17
50
18
00
18
50
19
00
19
50
20
00
Total real GDP
Year
45
30
15
0
4250 ■ environmentAl SCienCe & teChnology / June 15, 2008
fects of climate change? These questions raise the
issue of how to best meet basic human needs for
water and sanitation, including technology selec-
tion and governance strategies, under increasingly
variable and more water-scarce circumstances. They
also raise broader questions of why we continue to
design solutions that have an extended lifetime with-
out considering the dynamic global conditions and
the increasing rate of change.
Selecting technology in a dynamic world
Science must play a key role in solving present and
future global water problems (20). Although signif-
icant advances have helped address water-quality
and -quantity issues, many challenges still exist for
technology research, development, and implemen-
tation. As these next-generation technologies are
considered, the selection of those for further de-
velopment and implementation ought to consider
a broadened definition of performance to include
improved water quality and quantity as well as en-
ergy and materials consumption, ecosystem func-
tion at the source and sink, life-cycle impacts, and
human-health outcomes.
T A B L E 2
Current status of several global stressors on water resources and
examples of the relation-
ships between individual stressors
Stressor Current situation (13) Link to other stressors
Energy and
climate
More than 82% of global ener-
gy demand was met by fossil
fuels in 2004.
co2 levels have risen to 380
ppm from preindustrial levels of
280 ppm.
the global impacts on the water cycle from human development
stressors of
changes in land cover, urbanization, and water-resources
development may
surpass impacts from recent or anticipated climate change (17).
the stressor will result in greater variability in precipitation,
and runoff will af-
fect erosion and sedimentation, which is already impacted by
land use.
population current population is 6.7 billion
with average annual grow th
rate of 1.4%.
of the world’s 33 megacities, 21
are located in coastal areas.
During the next century, most of the 3 billion people added will
live in urban
areas.
Large segments of the population are still impacted by water-
related
pathogens; this results in 64.4 million disability-adjusted life
years (also known
as DALYs).
Just achieving the Millennium Development Goal for reducing
hunger will re-
quire a doubling in agricultural water use by 2050. climate-
induced variability
in precipitation and runoff will impact farmers dependent on
rain-fed agricul-
ture to a greater extent.
climate change affects the burden of disease due to
malnutrition, diarrhea,
and vector-borne diseases significantly more than it affects the
risk associat-
ed with flooding or thermal extremes (18).
Land use Approximately 50% of precip-
itation recharges to ground-
water in a natural system,
whereas only 15% recharg-
es in a highly urbanized envi-
ronment.
human changes in land cover
increase runoff and sediment
loading.
current methods of urbanization result in loss of forested
riparian cover along
streams and increased flooding, sedimentation, dredging and
filling of wet-
lands, and eutrophication.
Urbanization only half of the increase of the
100 largest urban areas in the
U.s. from 1970 to 1990 was be-
cause of population grow th.
Average population density in coastal areas is twice the global
average, and
the biodiversity of aquatic ecosystems continues to decline.
Nitrogen loading is directly related to the loss of wetlands
within an urban wa-
tershed.
Urbanization leads to heat islands that influence energy use and
climate.
Economic
grow th
By 2025, water withdrawals
are predicted to increase from
current levels by 50% in de-
veloping countries and 18% in
developed countries.
impact includes water used for energy production and increased
use in both
the nonconsumptive domestic sector and the consumptive
industrial sector.
one-half of the jobs worldwide are associated with water-
dependent resourc-
es, such as fisheries, forests, and agriculture (19).
June 15, 20 0 8 / env ironmentA l SCienC e & t eChnology ■
4251
Table 3 provides a review of several technological
opportunities and challenges associated with ad-
dressing the impacts of the global water stressors
presented in Figure 4. Design methodologies and
assessments that will adapt to fast rates of change
in stressors and will integrate current and emerging
global stressors need to be developed.
Developing governance strategies for a dynamic
world
As with technolog y designs and selections, gover-
nance strategies should account for the dynamic
global condition. These strategies, which will inf lu-
ence human behavior regarding water consump-
tion and use, need to be able to support sustainable
water systems under the scenario of multiple stres-
sors and rapid rates of change. Governance strat-
egies can have a significant inf luence over which
technologies are pursued and on the amount of
water consumed, recycled, and discharged and
by whom.
For example, water-allocation systems are chal-
lenged by droughts, which can adversely affect hu-
man and natural systems. To address this problem,
drought-management mechanisms have been insti-
tuted in jurisdictions around the world. Historically,
these mechanisms have involved a crisis-manage-
ment or reactive approach. An important trend dur-
ing the past decade in places such as the U.S. has
been a shift to a more proactive approach, empha-
sizing drought preparedness and local involvement
(26–28). Water managers traditionally have main-
tained that consumers do not respond to price sig-
nals, so demand management has occurred most
frequently through restrictions on specific water
uses (i.e., banning car washing and lawn irrigation)
and requirements for the adoption of specific tech-
nologies. In theory, raising prices to bring about wa-
ter conservation is less costly than implementing a
command-and-control approach, even if the prices
in question are inefficient (29).
This example demonstrates the potential for ex-
panded opportunities for governance options to
encourage desired behavior in terms of water use;
however, it also raises issues about setting the ap-
propriate pricing scheme, because adjustments in
cost may mean that certain segments of society or in-
dustry are “priced out” of the market, affecting local
economic development. It also raises issues of fair-
ness, because much of the global population is not
currently served by adequate water sanitation and
will need access to clean water to improve hygiene.
Again, it is imperative to include considerations of
sustainability outcomes and dynamic conditions
when establishing long-term policies, that is, water
allocation strategies, that can significantly influence
water quality and quantity.
A review of several governance opportunities
and challenges that can inf luence behavior and,
subsequently, the human-dominated water stres-
sors (Figure 4) is provided in Table 4. Like techno-
logical solutions, governance strategies established
to address human behavior and water quality and
quantity must also consider how the incentivized
actions will relate to desired behavior under future
conditions.
Conclusions
One challenge to solving global water problems is
the large number and integrated impact of global
stressors such as population and consumption, de-
mographic and land-use changes, urbanization, and
climate change. Another challenge is the rapid rate
of change projected for all of these stressors and their
resulting impacts, which are expected to accelerate
even further over the next century. The large num-
ber of stressors, their unknown interrelations, and
the observed rapid change must all be considered
when selecting and adapting new technology and
governance structures for sustainable water and
sanitation systems.
Julie Beth Zimmerman is an assistant professor of green
engineering jointly appointed to the environmental en-
gineering program and the School of Forestry and Envi-
4252 ■ environmentAl SCienCe & teChnology / June 15, 2008
F I G U R E 5
Freshwater concerns
Freshwater stress by country (top map) in 1995 and
(bot tom map) projected for 2025 (13).
People suffering from
water stress and scarcity
Water withdrawal
as percentage of
total available
Population projections
1995
Stress Scarcity
7
6
5
4
3
2
1
0
2050
Low
Medium
High>40
20–40
10–20
<10
People
(billion)
T A B L E 3
Opportunities in technology and engineering and associated
challenges
Opportunity Current status Challenge(s)
Desalination More than 15,000 desalination plants
operate in >125 countries, with a total
daily capacity of 32.4 million m3 of
water (21).
significant energy demands are required (e.g., a reverse-osmosis
plant needs 1.5 –2.5 kWh of electricity to produce 1 m3 of
water).
Emissions from brine effluent
Large global population located in water-stressed areas cannot
afford the technology.
Long-distance
water transfer
Water needs of southern california re-
quire 770 mi of pipes and canals, 34
reservoirs, 20 pumping plants, 3 pump-
generating plants, and 5 hydroelectric
power plants.
Embodied energy and materials associated with transferring wa-
ter and wastewater long distances are large over the life cycle.
Water transfer can impact hydrology of local ecosystems at both
the source and sink.
Design of distributed wastewater treatment systems that con-
serve water resources, nutrients, and biogas potential within the
watershed (22)
Water reclamation
and reuse
Water-reuse capacity is expected to
increase globally from 19.4 to 54.5 mil-
lion m3/day by 2015 (23).
Matching demand and supply as they relate to quality of treated
water for a particular use and geographical location
Water efficiency/
substitution in en-
gineering design
industrial and agricultural sectors rep-
resent >80% of global water consump-
tion (24).
Large water footprints in agriculture are caused by
inappropriate
water pricing, subsidies, inefficient technology, and the lack of
water-saving measures (5).
Decreasing embodied (virtual) water associated with process or
product through disruptive or “leapfrog” innovations
Appropriate water
technologies
point-of-use treatment technologies
provide a barrier to pathogen exposure
and are a possible solution when cen-
tralized systems are ineffective or in-
appropriate (25).
health improvement studies have largely ignored nondiarrhea
water-borne diseases (e.g., typhoid, hepatitis A) and water-
washed diseases (e.g., trachoma).
Does not provide as many nonhealth benefits compared with
source improvements, and noneconomic factors (e.g.,
compatibil-
ity, complexity) need to be integrated with adoption.
June 15, 20 0 8 / env ironmentA l SCienC e & t eChnology ■
4253
ronmental Studies at Yale University, and she serves as
the associate director for research at the Center for Green
Chemistry and Green Engineering at Yale. James R. Mi-
helcic is a professor of civil and environmental engineer-
ing at Michigan Technological University and serves as
the director of the master’s international program in en-
gineering. James Smith is a professor of environmental
and water resources engineering in the department of
civil and environmental engineering at the University
of Virginia. Address correspondence about this article
to Zimmerman at [email protected]
References
(1) Gleick, P. H.; et al. The World’s Water 2006–2007: The
Bien-
nial Report on Freshwater Resources; Island Press: Wash-
ington, DC, 2006.
(2) UN Human Settlements Programme. Water and Sanita-
tion in the World’s Cities: Local Action for Global Goals;
Earthscan Publications: London, 2003.
(3) World Health Organization. Global Water Supply and
Sanitation Assessment 2000 Report; WHO and UN Chil-
dren’s Fund: New York, 2000.
(4) UN Educational, Scientific, and Cultural Organization
World Water Assessment Programme. Water for People,
Water for Life; UN World Water Development Report 1;
UNESCO/Berghahn Books: New York, 2003.
(5) Hoekstra, A. Y.; Chapagain, A. K. Water Footprints of Na-
tions: Water Use by People as a Function of Their Con-
sumption Pattern. Water Resour. Manage. 2006, DOI
10.1007/s11269-006-9039-x.
(6) Hoekstra, A. Y.; Hung, P. Q. Virtual Water Trade: A Quan-
tification of Virtual Water Flows between Nations in Re-
lation to International Crop Trade; Value of Water Report
Series 11; UN Educational, Scientific, and Cultural Orga-
nization–Institute of Hydraulic Engineering: Delft, The
Netherlands, 2002.
(7) Gleick, P. H. Water in Crisis: Paths to Sustainable Water
Use. Ecol. Appl. 1998, 8, 571–579.
(8) Alcamo, J.; et al. Global Change and Global Scenarios
of Water Use and Availability: An Application of Water-
GAP1.0; Center for Environmental Systems Research,
University of Kassel: Kassel, Germany, 1997.
(9) Arnell, N. W. Climate Change and Global Water Resourc-
es. Global Environ. Change 1999, 9, S31–S49.
(10) Meigh, J. R.; McKenzie, A. A.; Sene, K. J. A Grid-Based
Ap-
proach to Water Scarcity Estimates for Eastern and South-
ern Africa. Water Resour. Manage. 1999, 13, 85–115.
(11) Vorosmarty, C.; et al. Global Water Resources: Vulnera-
bility from Climate Change and Population Growth. Sci-
ence 2000, 289, 284–288.
(12) Adger, N.; et al. Summary for Policy Makers. In Climate
Change 2007: Impacts, Adaptation, and Vulnerability;
Parry, M. L., et al., Eds.; Contribution of Working Group
II to the Fourth Assessment Report of the Intergovern-
mental Panel on Climate Change; Cambridge Universi-
ty Press: Cambridge, U.K., 2007.
(13) UN Environment Programme. Global Environmental Out-
look: Environment for Development; Report GEO-4; Prog-
ress Press: Valletta, Malta, 2007.
(14) African Development Bank; et al. Poverty and Climate
Change: Reducing the Vulnerability of the Poor through
Adaptation; 2003; w w w.unpei.org/PDF/Povert y-and-
Climate-Change.pdf.
(15) Fry, L. M.; Mihelcic, J. R.; Watkins, D. W. Water and
Non-
Water-Related Challenges of Achieving Global Sanitation
Coverage. Environ. Sci. Technol. 2008, 42, 4298–4304.
(16) Crutzen, P. J. The Anthropocene: The Current Human-
Dominated Geological Era—Human Impacts on Climate
and the Environment. In Climate Change and Its Effect
on Sustainable Development, Proceedings of the Global
Environmental Action International Conference, Tokyo,
Oct 14–16, 2005; GEA: Tokyo, 2005.
(17) Meybeck, M.; Vörösmarty, C. The Integrity of River and
Drainage Basin Systems: Challenges from Environmen-
tal Changes. In Vegetation, Water, Humans and the Cli-
mate: A New Perspective on an Interactive System; Kabat,
P., et al., Eds.; International Geosphere–Biosphere Pro-
gramme Global Change Series; IGBP/Springer-Verlag:
Berlin, 2004.
(18) McMichael, A. J.; et al. Global Climate Change. In Com-
parative Quantification of Health Risks: Global and Re-
gional Burden of Disease Attributable to Selected Major
Risk Factors; Ezzati, M., et al., Eds.; World Health Organi-
zation: Geneva, 2004; Vol. 2, Chapter 20, pp 1543–1650.
(19) UN Food and Agriculture Organization. The State of Food
and Agriculture 2003–2004: Agricultural Biotechnology—
Meeting the Needs of the Poor?; FAO Agriculture Series No.
35; FAO: Rome, 2004; www.fao.org/docrep/006/Y5160E/
Y5160E00.htm.
(20) Jury, W. A.; Vaux, H., Jr. The Role of Science in Solving
the
World’s Emerging Water Problems. Proc. Natl. Acad. Sci.
U.S.A. 2005, 102 (44), 15,715–15,720.
(21) Service, R. F. Desalination Freshens Up. Science 2006,
313 (5790), 1088–1090.
(22) Pinkman, R. Valuing Decentralized Wastewater Technolo-
gies: A Catalog of Benefits, Costs, and Economic Analysis
Tech-
niques; Rocky Mountain Institute: Snowmass, CO, 2004.
(23) Global Water Intelligence. Water Reuse Markets 2005–
2015:
A Global Assessment and Forecast; Media Analytics: Ox-
ford, U.K., 2005.
(24) Oki, T.; Kanae, S. Global Hydrological Cycles and World
Water Resources. Science 2006, 313 (5790), 1068–1072.
(25) Montgomery, M. A.; Elimelech, M. Water and Sanitation
in Developing Countries: Including Health in the Equa-
tion. Environ. Sci. Technol. 2007, 41 (1), 17–24.
(26) Pirie, R. L.; de Loe, R.C.; Kreutzwiser, R. Drought
Planning
and Water Allocation: An Assessment of Local Capacity
in Minnesota. J. Environ. Manage. 2004, 73 (1), 25–38.
(27) Ramaswami, R.; Zimmerman, J. B.; Mihelcic, J. R. Inte-
grating Developed and Developing World Knowledge
into Global Discussions and Strategies for Sustainabili-
ty. Part 2: Economics and Governance. Environ. Sci. Tech-
nol. 2007, 41 (10), 3422–3430.
(28) Clasen, T., et al. Cost-Effectiveness of Water Quality In-
Cost-Effectiveness of Water Quality In-
terventions for Preventing Diarrhoeal Disease in Devel-
oping Countries. J. Water Health 2007, 5 (4), 599–608.
(29) Olmstead, S. M.; Hanemann, W. M.; Stavins, R. N. Water
Demand under Alternative Price Structures. J. Environ.
Econ. Manage. 2007, 54 (2), 181–198.
(30) Rogers, P.; Silva, R. D.; Bhatia, R. Water Is an Economic
Good: How To Use Prices To Promote Equity, Efficiency,
and Sustainability. Water Policy 2002, 4, 1–17.
T A B L E 4
Examples of governance and economic issues associated with
managing water
Governance
strategy Opportunities and challenges
technology
incentives
interventions by governments through funding, purchase
commitments, regulatory driv-
ers, and voluntary programs can influence the success or failure
of a given technology.
Decisions to support certain technologies should consider
performance under current and
future conditions that integrate multiple stressors and
acknowledge the rapid changes in
stressors.
Water valuation population and other stressors will increase
demand for water, which is currently underval-
ued relative to other scarce natural resources. increases in
population and wealth will shif t
demand among agricultural, industrial, and domestic sectors in
many parts of the world;
this will affect land use, energy demand, and climate change
and, in turn, will impact water
quantity, quality, and availability. of ten much of the value of
water is unaccounted for in the
price (30).
Full-cost water assessments require that the value be related to
economic, environmental,
and social (including health) benefits. By using the full cost of
water to influence prices, the
market can potentially contribute to sustainable water systems
through innovations in effi-
ciency, water substitution, and conservation to avoid higher
costs. this will reduce the im-
pacts of individual and combined stressors, thereby reducing
demand.
Gray water
regulations
Establishing dual water-quality standards (drinking water vs
service water) can significant-
ly enhance the adoption rate of water-recovery and -reuse
systems. Because of the grow-
ing drivers for conservation, an opportunity exists to quantify
the risks and benefits of
water-reuse systems, define the appropriate scale, and develop
regulations to support im-
plementation. Management of gray water provides an
opportunity to bet ter manage nu-
trients primarily found in black water and to integrate the gray
water resource with local
agricultural activities. this can mitigate several stressors,
including those related to pro-
viding food for a growing population through agriculture and
land-use changes, by reduc-
ing the demand for freshwater and the energy related to water
treatment through recycling
and reuse.
4254 ■ environmentAl SCienCe & teChnology / June 15, 2008
CENE 599 – Rural Water / Wastewater
Spring 2016
Study Guide
Stressors on Global Water Quality and Quantity
Zimmerman, et al., 2008
1) What is a national water footprint?
2) Water use is often measured in units of volumes consumed
per time, what is another way to
measure water use that is mentioned in the paper? Name an
example of an indicator for this
alternative measure.
3) Which continent has the most water availability per capita?
Which has the least?
4) What is virtual water?
5) Name some continents and/or regions in which most nations
are generally strong importers of
virtual water.
6) Name some nations that do not reflect the greater regional
trend surrounding them concerning
the importation/exportation of virtual water.
7) Are water withdrawals in 2025 projected to increase more
within the developed or developing
world?
8) As a whole, is the greatest portion of BOD loading to
waterways from industrial, residential, or
agricultural sectors? Are the same trends relating the three true
for OECD vs Non-OECD
countries as a whole?
9) What are the main stressors discussed in the paper, and is it
best to think of these stressors as
integrated with each other or not?
10) What are the most likely major impacts of climate change
on water availability described in
Table 1?
11) Why is the coastal-urban interface especially sensitive to
the integrated stressors mentioned in
the paper, and in general what has been the characteristic shape
of all global water stressors?
12) According to the “low” projection in Figure 5; how many
people will be affected by water
scarcity and stress in 2050? How many face water scarcity and
stress as of 1995?
13) Name a potential benefit accompanying a likely climate
change impact mentioned in Table 1.
   Global Stressors     on Water Quality            and Qu.docx

More Related Content

Similar to Global Stressors on Water Quality and Qu.docx

World water day:water for cities
World water day:water for citiesWorld water day:water for cities
World water day:water for citiesPreksha Bhardwaj
 
World water day:water for cities
World water day:water for citiesWorld water day:water for cities
World water day:water for citiesPreksha Bhardwaj
 
Impacts of climate change on agriculture
Impacts of climate change on agricultureImpacts of climate change on agriculture
Impacts of climate change on agricultureCarmen Capriles
 
Dr. Junguo Liu's presentation on IPCC findings Water chapter
Dr. Junguo Liu's presentation on IPCC findings Water chapterDr. Junguo Liu's presentation on IPCC findings Water chapter
Dr. Junguo Liu's presentation on IPCC findings Water chapterweADAPT
 
Climate Change & Anthropogenic Impact On Water Resources
Climate Change & Anthropogenic Impact On Water ResourcesClimate Change & Anthropogenic Impact On Water Resources
Climate Change & Anthropogenic Impact On Water ResourcesVempi Satriya
 
The Importance Of Water Resources In Africa
The Importance Of Water Resources In AfricaThe Importance Of Water Resources In Africa
The Importance Of Water Resources In AfricaCarolina Lewis
 
Increasing Access to Safe Drinking Water - by Summer
Increasing Access to Safe Drinking Water - by SummerIncreasing Access to Safe Drinking Water - by Summer
Increasing Access to Safe Drinking Water - by SummerAmalia Giebitz
 
Climate resilient and environmentally sound agriculture - Module 1
Climate resilient and environmentally sound agriculture - Module 1Climate resilient and environmentally sound agriculture - Module 1
Climate resilient and environmentally sound agriculture - Module 1FAO
 
What Soil Science can offer, for a Society demanding more food with less wate...
What Soil Science can offer, for a Society demanding more food with less wate...What Soil Science can offer, for a Society demanding more food with less wate...
What Soil Science can offer, for a Society demanding more food with less wate...NetNexusBrasil
 
What Soil Science can Offer, for a Society Demanding more Food with less Wate...
What Soil Science can Offer, for a Society Demanding more Food with less Wate...What Soil Science can Offer, for a Society Demanding more Food with less Wate...
What Soil Science can Offer, for a Society Demanding more Food with less Wate...NetNexusBrasil
 
IRJET- Hydrogeochemistry and Environmental Implication of Periyar River S...
IRJET-  	  Hydrogeochemistry and Environmental Implication of Periyar River S...IRJET-  	  Hydrogeochemistry and Environmental Implication of Periyar River S...
IRJET- Hydrogeochemistry and Environmental Implication of Periyar River S...IRJET Journal
 
Global warming in print July 31 15
Global warming in print July 31 15Global warming in print July 31 15
Global warming in print July 31 15M .B. Goli
 
Methods and technologies to improve efficiency of water use
Methods and technologies to improve efficiency of water useMethods and technologies to improve efficiency of water use
Methods and technologies to improve efficiency of water useDamion Lawrence
 
USR_Funding Paper_FinalDraft
USR_Funding Paper_FinalDraftUSR_Funding Paper_FinalDraft
USR_Funding Paper_FinalDraftRobert Jenkins
 
Water Supply Restrictions
Water Supply RestrictionsWater Supply Restrictions
Water Supply RestrictionsJamie Boyd
 
city resources final l.ppt
city resources final                            l.pptcity resources final                            l.ppt
city resources final l.pptAshishGahlawat9
 

Similar to Global Stressors on Water Quality and Qu.docx (20)

World water day:water for cities
World water day:water for citiesWorld water day:water for cities
World water day:water for cities
 
World water day:water for cities
World water day:water for citiesWorld water day:water for cities
World water day:water for cities
 
Impacts of climate change on agriculture
Impacts of climate change on agricultureImpacts of climate change on agriculture
Impacts of climate change on agriculture
 
Mexico UN-Water Country Brief
Mexico UN-Water Country BriefMexico UN-Water Country Brief
Mexico UN-Water Country Brief
 
Dr. Junguo Liu's presentation on IPCC findings Water chapter
Dr. Junguo Liu's presentation on IPCC findings Water chapterDr. Junguo Liu's presentation on IPCC findings Water chapter
Dr. Junguo Liu's presentation on IPCC findings Water chapter
 
Climate Change & Anthropogenic Impact On Water Resources
Climate Change & Anthropogenic Impact On Water ResourcesClimate Change & Anthropogenic Impact On Water Resources
Climate Change & Anthropogenic Impact On Water Resources
 
The Importance Of Water Resources In Africa
The Importance Of Water Resources In AfricaThe Importance Of Water Resources In Africa
The Importance Of Water Resources In Africa
 
Increasing Access to Safe Drinking Water - by Summer
Increasing Access to Safe Drinking Water - by SummerIncreasing Access to Safe Drinking Water - by Summer
Increasing Access to Safe Drinking Water - by Summer
 
Climate resilient and environmentally sound agriculture - Module 1
Climate resilient and environmentally sound agriculture - Module 1Climate resilient and environmentally sound agriculture - Module 1
Climate resilient and environmentally sound agriculture - Module 1
 
What Soil Science can offer, for a Society demanding more food with less wate...
What Soil Science can offer, for a Society demanding more food with less wate...What Soil Science can offer, for a Society demanding more food with less wate...
What Soil Science can offer, for a Society demanding more food with less wate...
 
What Soil Science can Offer, for a Society Demanding more Food with less Wate...
What Soil Science can Offer, for a Society Demanding more Food with less Wate...What Soil Science can Offer, for a Society Demanding more Food with less Wate...
What Soil Science can Offer, for a Society Demanding more Food with less Wate...
 
IRJET- Hydrogeochemistry and Environmental Implication of Periyar River S...
IRJET-  	  Hydrogeochemistry and Environmental Implication of Periyar River S...IRJET-  	  Hydrogeochemistry and Environmental Implication of Periyar River S...
IRJET- Hydrogeochemistry and Environmental Implication of Periyar River S...
 
Amazonia: The Security Agenda (ASA)
Amazonia: The Security Agenda (ASA)Amazonia: The Security Agenda (ASA)
Amazonia: The Security Agenda (ASA)
 
Global warming in print July 31 15
Global warming in print July 31 15Global warming in print July 31 15
Global warming in print July 31 15
 
Methods and technologies to improve efficiency of water use
Methods and technologies to improve efficiency of water useMethods and technologies to improve efficiency of water use
Methods and technologies to improve efficiency of water use
 
USR_Funding Paper_FinalDraft
USR_Funding Paper_FinalDraftUSR_Funding Paper_FinalDraft
USR_Funding Paper_FinalDraft
 
Policy Brief 11
Policy Brief 11Policy Brief 11
Policy Brief 11
 
Water Supply Restrictions
Water Supply RestrictionsWater Supply Restrictions
Water Supply Restrictions
 
Climate change impacts on water quantity and quality: Implications for agricu...
Climate change impacts on water quantity and quality: Implications for agricu...Climate change impacts on water quantity and quality: Implications for agricu...
Climate change impacts on water quantity and quality: Implications for agricu...
 
city resources final l.ppt
city resources final                            l.pptcity resources final                            l.ppt
city resources final l.ppt
 

More from joyjonna282

In a 250-300 word response, critically examine your personal level o.docx
In a 250-300 word response, critically examine your personal level o.docxIn a 250-300 word response, critically examine your personal level o.docx
In a 250-300 word response, critically examine your personal level o.docxjoyjonna282
 
In a 10 –12 page paper, identify and analyze the benefits and challe.docx
In a 10 –12 page paper, identify and analyze the benefits and challe.docxIn a 10 –12 page paper, identify and analyze the benefits and challe.docx
In a 10 –12 page paper, identify and analyze the benefits and challe.docxjoyjonna282
 
In a 1-2 page Microsoft Word document, discuss the following case st.docx
In a 1-2 page Microsoft Word document, discuss the following case st.docxIn a 1-2 page Microsoft Word document, discuss the following case st.docx
In a 1-2 page Microsoft Word document, discuss the following case st.docxjoyjonna282
 
In a 16–20 slide PowerPoint presentation (excluding title and refere.docx
In a 16–20 slide PowerPoint presentation (excluding title and refere.docxIn a 16–20 slide PowerPoint presentation (excluding title and refere.docx
In a 16–20 slide PowerPoint presentation (excluding title and refere.docxjoyjonna282
 
In a 1-2 page Microsoft Word document, using APA, discuss the follow.docx
In a 1-2 page Microsoft Word document, using APA, discuss the follow.docxIn a 1-2 page Microsoft Word document, using APA, discuss the follow.docx
In a 1-2 page Microsoft Word document, using APA, discuss the follow.docxjoyjonna282
 
In a 1-2 page paper, discuss how the government, the media, and the .docx
In a 1-2 page paper, discuss how the government, the media, and the .docxIn a 1-2 page paper, discuss how the government, the media, and the .docx
In a 1-2 page paper, discuss how the government, the media, and the .docxjoyjonna282
 
In 2010, plans were announced for the construction of an Islamic cul.docx
In 2010, plans were announced for the construction of an Islamic cul.docxIn 2010, plans were announced for the construction of an Islamic cul.docx
In 2010, plans were announced for the construction of an Islamic cul.docxjoyjonna282
 
In 2011, John Jones, a middle school social science teacher began .docx
In 2011, John Jones, a middle school social science teacher began .docxIn 2011, John Jones, a middle school social science teacher began .docx
In 2011, John Jones, a middle school social science teacher began .docxjoyjonna282
 
In 5-7 pages (double-spaced,) provide a narrative explaining the org.docx
In 5-7 pages (double-spaced,) provide a narrative explaining the org.docxIn 5-7 pages (double-spaced,) provide a narrative explaining the org.docx
In 5-7 pages (double-spaced,) provide a narrative explaining the org.docxjoyjonna282
 
In 2004 the Bush Administration enacted changes to the FLSA and the .docx
In 2004 the Bush Administration enacted changes to the FLSA and the .docxIn 2004 the Bush Administration enacted changes to the FLSA and the .docx
In 2004 the Bush Administration enacted changes to the FLSA and the .docxjoyjonna282
 
In 200-250 wordsGiven the rate of technological chang.docx
In 200-250 wordsGiven the rate of technological chang.docxIn 200-250 wordsGiven the rate of technological chang.docx
In 200-250 wordsGiven the rate of technological chang.docxjoyjonna282
 
in 200 words or more..1  do you use twitter if so , how often do.docx
in 200 words or more..1  do you use twitter if so , how often do.docxin 200 words or more..1  do you use twitter if so , how often do.docx
in 200 words or more..1  do you use twitter if so , how often do.docxjoyjonna282
 
In 200 words or more, answer the following questionsAfter reading .docx
In 200 words or more, answer the following questionsAfter reading .docxIn 200 words or more, answer the following questionsAfter reading .docx
In 200 words or more, answer the following questionsAfter reading .docxjoyjonna282
 
In 2005, serial killer Dennis Rader, also known as BTK, was arrested.docx
In 2005, serial killer Dennis Rader, also known as BTK, was arrested.docxIn 2005, serial killer Dennis Rader, also known as BTK, was arrested.docx
In 2005, serial killer Dennis Rader, also known as BTK, was arrested.docxjoyjonna282
 
In 2003, China sent a person into space. China became just the third.docx
In 2003, China sent a person into space. China became just the third.docxIn 2003, China sent a person into space. China became just the third.docx
In 2003, China sent a person into space. China became just the third.docxjoyjonna282
 
In 250 words briefly describe the adverse effects caused by exposure.docx
In 250 words briefly describe the adverse effects caused by exposure.docxIn 250 words briefly describe the adverse effects caused by exposure.docx
In 250 words briefly describe the adverse effects caused by exposure.docxjoyjonna282
 
In 2.5 pages, compare and contrast health care reform in two differe.docx
In 2.5 pages, compare and contrast health care reform in two differe.docxIn 2.5 pages, compare and contrast health care reform in two differe.docx
In 2.5 pages, compare and contrast health care reform in two differe.docxjoyjonna282
 
In 2014 Virginia scientist Eric Betzig won a Nobel Prize for his res.docx
In 2014 Virginia scientist Eric Betzig won a Nobel Prize for his res.docxIn 2014 Virginia scientist Eric Betzig won a Nobel Prize for his res.docx
In 2014 Virginia scientist Eric Betzig won a Nobel Prize for his res.docxjoyjonna282
 
In 200-300 words  - How is predation different from parasitism What.docx
In 200-300 words  - How is predation different from parasitism What.docxIn 200-300 words  - How is predation different from parasitism What.docx
In 200-300 words  - How is predation different from parasitism What.docxjoyjonna282
 
In 3 and half pages, including a title page and a reference page, di.docx
In 3 and half pages, including a title page and a reference page, di.docxIn 3 and half pages, including a title page and a reference page, di.docx
In 3 and half pages, including a title page and a reference page, di.docxjoyjonna282
 

More from joyjonna282 (20)

In a 250-300 word response, critically examine your personal level o.docx
In a 250-300 word response, critically examine your personal level o.docxIn a 250-300 word response, critically examine your personal level o.docx
In a 250-300 word response, critically examine your personal level o.docx
 
In a 10 –12 page paper, identify and analyze the benefits and challe.docx
In a 10 –12 page paper, identify and analyze the benefits and challe.docxIn a 10 –12 page paper, identify and analyze the benefits and challe.docx
In a 10 –12 page paper, identify and analyze the benefits and challe.docx
 
In a 1-2 page Microsoft Word document, discuss the following case st.docx
In a 1-2 page Microsoft Word document, discuss the following case st.docxIn a 1-2 page Microsoft Word document, discuss the following case st.docx
In a 1-2 page Microsoft Word document, discuss the following case st.docx
 
In a 16–20 slide PowerPoint presentation (excluding title and refere.docx
In a 16–20 slide PowerPoint presentation (excluding title and refere.docxIn a 16–20 slide PowerPoint presentation (excluding title and refere.docx
In a 16–20 slide PowerPoint presentation (excluding title and refere.docx
 
In a 1-2 page Microsoft Word document, using APA, discuss the follow.docx
In a 1-2 page Microsoft Word document, using APA, discuss the follow.docxIn a 1-2 page Microsoft Word document, using APA, discuss the follow.docx
In a 1-2 page Microsoft Word document, using APA, discuss the follow.docx
 
In a 1-2 page paper, discuss how the government, the media, and the .docx
In a 1-2 page paper, discuss how the government, the media, and the .docxIn a 1-2 page paper, discuss how the government, the media, and the .docx
In a 1-2 page paper, discuss how the government, the media, and the .docx
 
In 2010, plans were announced for the construction of an Islamic cul.docx
In 2010, plans were announced for the construction of an Islamic cul.docxIn 2010, plans were announced for the construction of an Islamic cul.docx
In 2010, plans were announced for the construction of an Islamic cul.docx
 
In 2011, John Jones, a middle school social science teacher began .docx
In 2011, John Jones, a middle school social science teacher began .docxIn 2011, John Jones, a middle school social science teacher began .docx
In 2011, John Jones, a middle school social science teacher began .docx
 
In 5-7 pages (double-spaced,) provide a narrative explaining the org.docx
In 5-7 pages (double-spaced,) provide a narrative explaining the org.docxIn 5-7 pages (double-spaced,) provide a narrative explaining the org.docx
In 5-7 pages (double-spaced,) provide a narrative explaining the org.docx
 
In 2004 the Bush Administration enacted changes to the FLSA and the .docx
In 2004 the Bush Administration enacted changes to the FLSA and the .docxIn 2004 the Bush Administration enacted changes to the FLSA and the .docx
In 2004 the Bush Administration enacted changes to the FLSA and the .docx
 
In 200-250 wordsGiven the rate of technological chang.docx
In 200-250 wordsGiven the rate of technological chang.docxIn 200-250 wordsGiven the rate of technological chang.docx
In 200-250 wordsGiven the rate of technological chang.docx
 
in 200 words or more..1  do you use twitter if so , how often do.docx
in 200 words or more..1  do you use twitter if so , how often do.docxin 200 words or more..1  do you use twitter if so , how often do.docx
in 200 words or more..1  do you use twitter if so , how often do.docx
 
In 200 words or more, answer the following questionsAfter reading .docx
In 200 words or more, answer the following questionsAfter reading .docxIn 200 words or more, answer the following questionsAfter reading .docx
In 200 words or more, answer the following questionsAfter reading .docx
 
In 2005, serial killer Dennis Rader, also known as BTK, was arrested.docx
In 2005, serial killer Dennis Rader, also known as BTK, was arrested.docxIn 2005, serial killer Dennis Rader, also known as BTK, was arrested.docx
In 2005, serial killer Dennis Rader, also known as BTK, was arrested.docx
 
In 2003, China sent a person into space. China became just the third.docx
In 2003, China sent a person into space. China became just the third.docxIn 2003, China sent a person into space. China became just the third.docx
In 2003, China sent a person into space. China became just the third.docx
 
In 250 words briefly describe the adverse effects caused by exposure.docx
In 250 words briefly describe the adverse effects caused by exposure.docxIn 250 words briefly describe the adverse effects caused by exposure.docx
In 250 words briefly describe the adverse effects caused by exposure.docx
 
In 2.5 pages, compare and contrast health care reform in two differe.docx
In 2.5 pages, compare and contrast health care reform in two differe.docxIn 2.5 pages, compare and contrast health care reform in two differe.docx
In 2.5 pages, compare and contrast health care reform in two differe.docx
 
In 2014 Virginia scientist Eric Betzig won a Nobel Prize for his res.docx
In 2014 Virginia scientist Eric Betzig won a Nobel Prize for his res.docxIn 2014 Virginia scientist Eric Betzig won a Nobel Prize for his res.docx
In 2014 Virginia scientist Eric Betzig won a Nobel Prize for his res.docx
 
In 200-300 words  - How is predation different from parasitism What.docx
In 200-300 words  - How is predation different from parasitism What.docxIn 200-300 words  - How is predation different from parasitism What.docx
In 200-300 words  - How is predation different from parasitism What.docx
 
In 3 and half pages, including a title page and a reference page, di.docx
In 3 and half pages, including a title page and a reference page, di.docxIn 3 and half pages, including a title page and a reference page, di.docx
In 3 and half pages, including a title page and a reference page, di.docx
 

Recently uploaded

URLs and Routing in the Odoo 17 Website App
URLs and Routing in the Odoo 17 Website AppURLs and Routing in the Odoo 17 Website App
URLs and Routing in the Odoo 17 Website AppCeline George
 
Class 11 Legal Studies Ch-1 Concept of State .pdf
Class 11 Legal Studies Ch-1 Concept of State .pdfClass 11 Legal Studies Ch-1 Concept of State .pdf
Class 11 Legal Studies Ch-1 Concept of State .pdfakmcokerachita
 
CARE OF CHILD IN INCUBATOR..........pptx
CARE OF CHILD IN INCUBATOR..........pptxCARE OF CHILD IN INCUBATOR..........pptx
CARE OF CHILD IN INCUBATOR..........pptxGaneshChakor2
 
SOCIAL AND HISTORICAL CONTEXT - LFTVD.pptx
SOCIAL AND HISTORICAL CONTEXT - LFTVD.pptxSOCIAL AND HISTORICAL CONTEXT - LFTVD.pptx
SOCIAL AND HISTORICAL CONTEXT - LFTVD.pptxiammrhaywood
 
Alper Gobel In Media Res Media Component
Alper Gobel In Media Res Media ComponentAlper Gobel In Media Res Media Component
Alper Gobel In Media Res Media ComponentInMediaRes1
 
_Math 4-Q4 Week 5.pptx Steps in Collecting Data
_Math 4-Q4 Week 5.pptx Steps in Collecting Data_Math 4-Q4 Week 5.pptx Steps in Collecting Data
_Math 4-Q4 Week 5.pptx Steps in Collecting DataJhengPantaleon
 
A Critique of the Proposed National Education Policy Reform
A Critique of the Proposed National Education Policy ReformA Critique of the Proposed National Education Policy Reform
A Critique of the Proposed National Education Policy ReformChameera Dedduwage
 
The Most Excellent Way | 1 Corinthians 13
The Most Excellent Way | 1 Corinthians 13The Most Excellent Way | 1 Corinthians 13
The Most Excellent Way | 1 Corinthians 13Steve Thomason
 
Presiding Officer Training module 2024 lok sabha elections
Presiding Officer Training module 2024 lok sabha electionsPresiding Officer Training module 2024 lok sabha elections
Presiding Officer Training module 2024 lok sabha electionsanshu789521
 
Hybridoma Technology ( Production , Purification , and Application )
Hybridoma Technology  ( Production , Purification , and Application  ) Hybridoma Technology  ( Production , Purification , and Application  )
Hybridoma Technology ( Production , Purification , and Application ) Sakshi Ghasle
 
Enzyme, Pharmaceutical Aids, Miscellaneous Last Part of Chapter no 5th.pdf
Enzyme, Pharmaceutical Aids, Miscellaneous Last Part of Chapter no 5th.pdfEnzyme, Pharmaceutical Aids, Miscellaneous Last Part of Chapter no 5th.pdf
Enzyme, Pharmaceutical Aids, Miscellaneous Last Part of Chapter no 5th.pdfSumit Tiwari
 
The basics of sentences session 2pptx copy.pptx
The basics of sentences session 2pptx copy.pptxThe basics of sentences session 2pptx copy.pptx
The basics of sentences session 2pptx copy.pptxheathfieldcps1
 
mini mental status format.docx
mini    mental       status     format.docxmini    mental       status     format.docx
mini mental status format.docxPoojaSen20
 
Concept of Vouching. B.Com(Hons) /B.Compdf
Concept of Vouching. B.Com(Hons) /B.CompdfConcept of Vouching. B.Com(Hons) /B.Compdf
Concept of Vouching. B.Com(Hons) /B.CompdfUmakantAnnand
 
MENTAL STATUS EXAMINATION format.docx
MENTAL     STATUS EXAMINATION format.docxMENTAL     STATUS EXAMINATION format.docx
MENTAL STATUS EXAMINATION format.docxPoojaSen20
 
Introduction to ArtificiaI Intelligence in Higher Education
Introduction to ArtificiaI Intelligence in Higher EducationIntroduction to ArtificiaI Intelligence in Higher Education
Introduction to ArtificiaI Intelligence in Higher Educationpboyjonauth
 
KSHARA STURA .pptx---KSHARA KARMA THERAPY (CAUSTIC THERAPY)————IMP.OF KSHARA ...
KSHARA STURA .pptx---KSHARA KARMA THERAPY (CAUSTIC THERAPY)————IMP.OF KSHARA ...KSHARA STURA .pptx---KSHARA KARMA THERAPY (CAUSTIC THERAPY)————IMP.OF KSHARA ...
KSHARA STURA .pptx---KSHARA KARMA THERAPY (CAUSTIC THERAPY)————IMP.OF KSHARA ...M56BOOKSTORE PRODUCT/SERVICE
 
Solving Puzzles Benefits Everyone (English).pptx
Solving Puzzles Benefits Everyone (English).pptxSolving Puzzles Benefits Everyone (English).pptx
Solving Puzzles Benefits Everyone (English).pptxOH TEIK BIN
 
Accessible design: Minimum effort, maximum impact
Accessible design: Minimum effort, maximum impactAccessible design: Minimum effort, maximum impact
Accessible design: Minimum effort, maximum impactdawncurless
 

Recently uploaded (20)

URLs and Routing in the Odoo 17 Website App
URLs and Routing in the Odoo 17 Website AppURLs and Routing in the Odoo 17 Website App
URLs and Routing in the Odoo 17 Website App
 
Class 11 Legal Studies Ch-1 Concept of State .pdf
Class 11 Legal Studies Ch-1 Concept of State .pdfClass 11 Legal Studies Ch-1 Concept of State .pdf
Class 11 Legal Studies Ch-1 Concept of State .pdf
 
CARE OF CHILD IN INCUBATOR..........pptx
CARE OF CHILD IN INCUBATOR..........pptxCARE OF CHILD IN INCUBATOR..........pptx
CARE OF CHILD IN INCUBATOR..........pptx
 
SOCIAL AND HISTORICAL CONTEXT - LFTVD.pptx
SOCIAL AND HISTORICAL CONTEXT - LFTVD.pptxSOCIAL AND HISTORICAL CONTEXT - LFTVD.pptx
SOCIAL AND HISTORICAL CONTEXT - LFTVD.pptx
 
Alper Gobel In Media Res Media Component
Alper Gobel In Media Res Media ComponentAlper Gobel In Media Res Media Component
Alper Gobel In Media Res Media Component
 
_Math 4-Q4 Week 5.pptx Steps in Collecting Data
_Math 4-Q4 Week 5.pptx Steps in Collecting Data_Math 4-Q4 Week 5.pptx Steps in Collecting Data
_Math 4-Q4 Week 5.pptx Steps in Collecting Data
 
TataKelola dan KamSiber Kecerdasan Buatan v022.pdf
TataKelola dan KamSiber Kecerdasan Buatan v022.pdfTataKelola dan KamSiber Kecerdasan Buatan v022.pdf
TataKelola dan KamSiber Kecerdasan Buatan v022.pdf
 
A Critique of the Proposed National Education Policy Reform
A Critique of the Proposed National Education Policy ReformA Critique of the Proposed National Education Policy Reform
A Critique of the Proposed National Education Policy Reform
 
The Most Excellent Way | 1 Corinthians 13
The Most Excellent Way | 1 Corinthians 13The Most Excellent Way | 1 Corinthians 13
The Most Excellent Way | 1 Corinthians 13
 
Presiding Officer Training module 2024 lok sabha elections
Presiding Officer Training module 2024 lok sabha electionsPresiding Officer Training module 2024 lok sabha elections
Presiding Officer Training module 2024 lok sabha elections
 
Hybridoma Technology ( Production , Purification , and Application )
Hybridoma Technology  ( Production , Purification , and Application  ) Hybridoma Technology  ( Production , Purification , and Application  )
Hybridoma Technology ( Production , Purification , and Application )
 
Enzyme, Pharmaceutical Aids, Miscellaneous Last Part of Chapter no 5th.pdf
Enzyme, Pharmaceutical Aids, Miscellaneous Last Part of Chapter no 5th.pdfEnzyme, Pharmaceutical Aids, Miscellaneous Last Part of Chapter no 5th.pdf
Enzyme, Pharmaceutical Aids, Miscellaneous Last Part of Chapter no 5th.pdf
 
The basics of sentences session 2pptx copy.pptx
The basics of sentences session 2pptx copy.pptxThe basics of sentences session 2pptx copy.pptx
The basics of sentences session 2pptx copy.pptx
 
mini mental status format.docx
mini    mental       status     format.docxmini    mental       status     format.docx
mini mental status format.docx
 
Concept of Vouching. B.Com(Hons) /B.Compdf
Concept of Vouching. B.Com(Hons) /B.CompdfConcept of Vouching. B.Com(Hons) /B.Compdf
Concept of Vouching. B.Com(Hons) /B.Compdf
 
MENTAL STATUS EXAMINATION format.docx
MENTAL     STATUS EXAMINATION format.docxMENTAL     STATUS EXAMINATION format.docx
MENTAL STATUS EXAMINATION format.docx
 
Introduction to ArtificiaI Intelligence in Higher Education
Introduction to ArtificiaI Intelligence in Higher EducationIntroduction to ArtificiaI Intelligence in Higher Education
Introduction to ArtificiaI Intelligence in Higher Education
 
KSHARA STURA .pptx---KSHARA KARMA THERAPY (CAUSTIC THERAPY)————IMP.OF KSHARA ...
KSHARA STURA .pptx---KSHARA KARMA THERAPY (CAUSTIC THERAPY)————IMP.OF KSHARA ...KSHARA STURA .pptx---KSHARA KARMA THERAPY (CAUSTIC THERAPY)————IMP.OF KSHARA ...
KSHARA STURA .pptx---KSHARA KARMA THERAPY (CAUSTIC THERAPY)————IMP.OF KSHARA ...
 
Solving Puzzles Benefits Everyone (English).pptx
Solving Puzzles Benefits Everyone (English).pptxSolving Puzzles Benefits Everyone (English).pptx
Solving Puzzles Benefits Everyone (English).pptx
 
Accessible design: Minimum effort, maximum impact
Accessible design: Minimum effort, maximum impactAccessible design: Minimum effort, maximum impact
Accessible design: Minimum effort, maximum impact
 

Global Stressors on Water Quality and Qu.docx

  • 1. Global Stressors on Water Quality and Quantity Growing population and wealth will impact sustain- ability, technology selection, and governance strategies related to water issues. J U L I E BE T H Z I M M E R M A N YA L E U N I V E R SI T Y JA M E S R . M I H E L C IC M IC H IG A N T EC H NOLO GIC A L U N I V E R SI T Y JA M E S SM I T H U N I V E R SI T Y OF V I RGI N I A This inequality is especially critical for Asia, which has 60% of the world’s population but only 36% of the world’s water. Water quality in terms of pollutant loading also is not distributed equally and is related to the type of use and a country’s level of develop- ment (Figure 2). Developing countries often have less capacity to improve water quality and depend on lower-quality water for a variety of uses, includ- ing drinking water.
  • 2. To capture an overall picture of a nation’s water use, researchers calculate the national water foot- print; this represents the total volume of freshwater used to produce the goods and services consumed by a population and the impact of globalization by F or more than a decade, the scientific com- munity as well as nongovernmental orga- nizations have sought to raise an alarm concerning the unsustainable use of the planet’s available water resources (1). Rising world populations and consumption are inexorably increasing human demand for domestic, industrial, and agricultural water. Population and wealth along with other global stressors will have a direct and significant impact on the sustainability goals, tech- nology selection, and governance strategies that are related to water quality and quantity. On a global basis, ~70% of freshwater is currently used for crop irrigation, ~20% for industrial purpos- es, and ~10% for domestic purposes (2). However, wa- ter use varies dramatically from one part of the world to another. Egypt, for example, uses 98% of its water for irrigation, leaving only ~27 L/capita-day for do- mestic use. In contrast, the U.S. uses 40% of its water for irrigation, and domestic water use exceeds 410 L/ capita-day. In refugee camps in Africa and Asia, resi- dents may receive only 15 L/capita-day for both con- sumption and hygiene. For comparison, the World Health Organization defines reasonable access as the availability of at least 20 L/capita-day from a source within 1 km of the user’s dwelling (3).
  • 3. Although the quantity of water used varies by region, water is not distributed equally (Figure 1). © 20 08 American Chemical Society is t o c k p h o t o June 15, 20 0 8 / env ironmentA l SCienC e & t eChnology ■ 4247 accounting for water across the life cycle of imports and exports (5). Water use is measured in terms of water volumes consumed (evaporated) or pollut- ed per unit of time. In this way, it is similar to the concept of “virtual” water, because it accounts for water use associated with consuming agricultural and industrial imports. For the period of 1997–2001, the global water footprint was 1243 m3/capita-year, 16% of which was the external water footprint (as- sociated with importing goods and services for
  • 4. consumption; 5). However, some countries have ex- ternal footprints that account for 50–80% of their to- tal footprint, whereas other countries—for example, some countries in Africa—have external footprints near zero (Figure 3). Given the current state of global water interde- pendence, water will become even more critical and difficult to manage under highly variable future sce- narios that involve numerous interconnected global stressors. In this article, we examine the individu- al and integrated effects of several important stres- sors on the global water resource: population and consumption, demographic and land-use changes, urbanization, and of course climate change, all of which can contribute to changes in quality, quan- tity, and availability of water (7). We then explore the relationships between these stressors and the design, development, and implementation of tech- nology and governance strategies for sustainable water systems in a dynamic world. Water stressors Increased stresses on the world’s water are affect- ing quality, quantity, and availability. Many studies have predicted that climate change will affect water supply and use (8–10). Water scarcity felt by 20% of the 1 billion people who are estimated to experi- ence shortages by 2025 is projected to be the direct effect of climate change (11). The Intergovernmental Panel on Climate Change has summarized impacts on water resources that are expected by the mid to late 21st century (Table 1; 12). According to the best estimates associated with
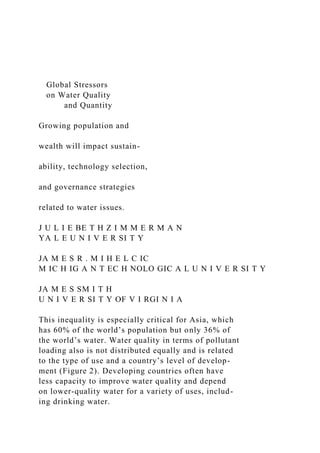
  • 5. climate change, 75% of the earth’s land area will ex- perience increases in runoff compared with 1995 F I G U R E 1 Water for people Global overview of water availability vs population (data from Ref. 4). F I G U R E 2 Water quality Annual biochemical oxygen demand (BoD) loading in global water- ways by sector as an indicator for water quality for 1995 and esti- mated for 2010 and 2020. the data are compared for organisation for Economic co-operation and Development (oEcD) countries and non- oEcD countries (4). BOD loading to waterways by sector 1995 2010 2020 Megatons 0 50 100 150 200 Industry Household Agriculture Industry
  • 6. Household Agriculture N on -O EC D O EC D 4248 ■ environmentAl SCienCe & teChnology / June 15, 2008 15% North and Central America South America Africa Percentage of the world’s water Percentage of the world’s population 8%
  • 7. 5% Australia and Oceania <1% 26% 6% Europe 8% 13% 11% 13% Asia 36% 60% levels, and 25% will experience decreases (8). Higher variability in precipitation and runoff impacts ero- sion and sedimentation. This particular impact of climate will be exacerbated by changes in land use that result in sedimentation as- sociated with loss of forested riparian cover along streams, filling of wetlands, and agri- cultural practices. The coast- al–urban interface is especially vulnerable to the impact of these integrated stressors because the average population density in these fragile areas is twice the global average. These exam- ples demonstrate the complex
  • 8. and unresolved links between individual stressors. Although the environmental and human response to integrated stressors is still largely unknown, the best strategy to achieve sustainable water systems is likely one that considers the stressors as a sys- tem with positive and negative feedback loops, synergies, and interferences. Figure 4 depicts trends from 1750 to 2000 of some major stressors on water quality and quantity. We note the common shape to all these stressors and resulting impacts—it mirrors the shape of a hockey stick. Stressors are depicted in Fig- ures 4a–4f. Two resulting changes that are occur- ring globally are also illustrated: the use of water (Figure 4g) and the deterioration of water quality as indicated by nitrogen loading (Figure 4h). Fig- F I G U R E 3 Water for trade National virtual-water balances related to the international trade of products for 1997–2001. Net exporters are shown in green, and net importers are shown in red (6). –100 to –50 –50 to –25 –25 to –10
  • 9. –10 to – 5 –5 to 0 0 to 5 5 to 25 25 to 50 50 to 100 No data Net virtual-water import (Gm3/yr) T A B L E 1 Possible impacts of climate change on water resources project- ed for the mid to late 21st century1 Phenomena and direction of trends Likelihood of future trends2 Major impact(s) over most land areas, warmer and fewer cold days and nights as well as warmer and more frequent hot days and nights Virtually certain Effects on water resources that rely on snowmelt; effects on some water supplies Warm spells/heat waves; frequen- cy increases over most land areas
  • 10. Very likely increased water demand; water-quality problems (e.g., algal blooms) heavy precipitation events; fre- quency increases over most areas Very likely Adverse effects on quality of surface water and groundwater; contamination of water supply; water scarcity may be relieved Area affected by drought increases Likely More widespread water stress intense tropical cyclone activity increases Likely power outages causing disrup- tion of public water supply increased incidence of extreme high sea level (excludes tsunamis) Likely Decreased freshwater availabili- ty due to saltwater intrusion 1table spM.1 in Ref. 12. 2these projections are for the 21st centur y and are based on the special Repor t on Emissions scenarios. June 15, 20 0 8 / env ironmentA l SCienC e & t eChnology ■ 4249
  • 11. ure 4 shows that changes are occurring on a global scale and, more importantly, that the rate of change is increasing. Furthermore, as shown in Figure 5, the spatial scale that will be affected by water-quality and -quantity challenges is also increasing. That is, the impacts of the stressors are increasing, and both the number of locations and the number of people that will be af- fected by these stressors in terms of water quality and quantity are increasing. One challenge to both the sci- entific community and govern- ments is that the impacts of global stressors are not independent (Ta- ble 2). The link between energy generation from fossil fuels and climate change is a clear exam- ple. Previously, we discussed the impacts that climate change, land use, and population have on wa- ter quality in terms of sedimen- tation. Another example would be that as the stress of globaliza- tion progresses, the external wa- ter footprints of many countries (the part of the footprint that is served by other countries) will become even more significant because of greater importation of goods and services. Similarly,
  • 12. as societies develop, they tend to increase water and energy con- sumption (13). The stressors and impacts of the “hockey-stick world” to come suggest that we need to expand our design consider- ations in infrastructure systems for water and sanitation, which typically have useful lifetimes meant to last for decades (and often function beyond their de- signed lifetime). We also need to acknowledge that the conditions in which the design will function over its life cycle will take place in a world of rapid and increasing change. Recognition of this inter- connectedness has led the Afri- can Development Bank and other development organizations (14) to agree that integrating adaptation responses into development plan- ning, which includes improve- ments in water and sanitation, is an important way to address climate change impacts on the poor. For example, is a sanitary sewer an appropriate technology in a city that will become water- scarce by 2025? Sewers require on average up to 75 L/capita-day, whereas other sanitation technol- ogies are available that require no water (15). Sew-
  • 13. ers can also distribute nutrients over a wide spatial scale, whereas other sanitation technologies can consolidate nutrients at the community level. And if a sewer project is deemed appropriate today, what should the community do to prepare for future ef- F I G U R E 4 Global water stressors Global trends over time of stressors (a–f) and the corresponding trends in water quanti- ty and quality (g–h). (a–e, g, and h adapted with permission from Ref. 16; f adapted with permission from Ref. 13.) Pe op le (b ill io n) 17 50 18 00 18 50 19
  • 14. 00 19 50 20 00 Population (a) (b) (c) (d) (e) (f) (g) (h) Year 7 6 5 4 3 2 1 0 Pe rc en ta ge o
  • 19. B TU 17 50 18 00 18 50 19 00 19 50 20 00 Loss of tropical rain forest and woodland Year 35 30 25 20 15 10 5 0
  • 21. 20 00 Nitrogen flux to coastal zone Year 10 8 6 4 2 0 17 50 18 50 18 00 19 00 19 50
  • 24. 4250 ■ environmentAl SCienCe & teChnology / June 15, 2008 fects of climate change? These questions raise the issue of how to best meet basic human needs for water and sanitation, including technology selec- tion and governance strategies, under increasingly variable and more water-scarce circumstances. They also raise broader questions of why we continue to design solutions that have an extended lifetime with- out considering the dynamic global conditions and the increasing rate of change. Selecting technology in a dynamic world Science must play a key role in solving present and future global water problems (20). Although signif- icant advances have helped address water-quality and -quantity issues, many challenges still exist for technology research, development, and implemen- tation. As these next-generation technologies are considered, the selection of those for further de- velopment and implementation ought to consider a broadened definition of performance to include improved water quality and quantity as well as en- ergy and materials consumption, ecosystem func- tion at the source and sink, life-cycle impacts, and human-health outcomes. T A B L E 2 Current status of several global stressors on water resources and examples of the relation- ships between individual stressors Stressor Current situation (13) Link to other stressors
  • 25. Energy and climate More than 82% of global ener- gy demand was met by fossil fuels in 2004. co2 levels have risen to 380 ppm from preindustrial levels of 280 ppm. the global impacts on the water cycle from human development stressors of changes in land cover, urbanization, and water-resources development may surpass impacts from recent or anticipated climate change (17). the stressor will result in greater variability in precipitation, and runoff will af- fect erosion and sedimentation, which is already impacted by land use. population current population is 6.7 billion with average annual grow th rate of 1.4%. of the world’s 33 megacities, 21 are located in coastal areas. During the next century, most of the 3 billion people added will live in urban areas. Large segments of the population are still impacted by water- related
  • 26. pathogens; this results in 64.4 million disability-adjusted life years (also known as DALYs). Just achieving the Millennium Development Goal for reducing hunger will re- quire a doubling in agricultural water use by 2050. climate- induced variability in precipitation and runoff will impact farmers dependent on rain-fed agricul- ture to a greater extent. climate change affects the burden of disease due to malnutrition, diarrhea, and vector-borne diseases significantly more than it affects the risk associat- ed with flooding or thermal extremes (18). Land use Approximately 50% of precip- itation recharges to ground- water in a natural system, whereas only 15% recharg- es in a highly urbanized envi- ronment. human changes in land cover increase runoff and sediment loading. current methods of urbanization result in loss of forested riparian cover along streams and increased flooding, sedimentation, dredging and filling of wet- lands, and eutrophication. Urbanization only half of the increase of the
  • 27. 100 largest urban areas in the U.s. from 1970 to 1990 was be- cause of population grow th. Average population density in coastal areas is twice the global average, and the biodiversity of aquatic ecosystems continues to decline. Nitrogen loading is directly related to the loss of wetlands within an urban wa- tershed. Urbanization leads to heat islands that influence energy use and climate. Economic grow th By 2025, water withdrawals are predicted to increase from current levels by 50% in de- veloping countries and 18% in developed countries. impact includes water used for energy production and increased use in both the nonconsumptive domestic sector and the consumptive industrial sector. one-half of the jobs worldwide are associated with water- dependent resourc- es, such as fisheries, forests, and agriculture (19). June 15, 20 0 8 / env ironmentA l SCienC e & t eChnology ■ 4251
  • 28. Table 3 provides a review of several technological opportunities and challenges associated with ad- dressing the impacts of the global water stressors presented in Figure 4. Design methodologies and assessments that will adapt to fast rates of change in stressors and will integrate current and emerging global stressors need to be developed. Developing governance strategies for a dynamic world As with technolog y designs and selections, gover- nance strategies should account for the dynamic global condition. These strategies, which will inf lu- ence human behavior regarding water consump- tion and use, need to be able to support sustainable water systems under the scenario of multiple stres- sors and rapid rates of change. Governance strat- egies can have a significant inf luence over which technologies are pursued and on the amount of water consumed, recycled, and discharged and by whom. For example, water-allocation systems are chal- lenged by droughts, which can adversely affect hu- man and natural systems. To address this problem, drought-management mechanisms have been insti- tuted in jurisdictions around the world. Historically, these mechanisms have involved a crisis-manage- ment or reactive approach. An important trend dur- ing the past decade in places such as the U.S. has been a shift to a more proactive approach, empha- sizing drought preparedness and local involvement (26–28). Water managers traditionally have main- tained that consumers do not respond to price sig-
  • 29. nals, so demand management has occurred most frequently through restrictions on specific water uses (i.e., banning car washing and lawn irrigation) and requirements for the adoption of specific tech- nologies. In theory, raising prices to bring about wa- ter conservation is less costly than implementing a command-and-control approach, even if the prices in question are inefficient (29). This example demonstrates the potential for ex- panded opportunities for governance options to encourage desired behavior in terms of water use; however, it also raises issues about setting the ap- propriate pricing scheme, because adjustments in cost may mean that certain segments of society or in- dustry are “priced out” of the market, affecting local economic development. It also raises issues of fair- ness, because much of the global population is not currently served by adequate water sanitation and will need access to clean water to improve hygiene. Again, it is imperative to include considerations of sustainability outcomes and dynamic conditions when establishing long-term policies, that is, water allocation strategies, that can significantly influence water quality and quantity. A review of several governance opportunities and challenges that can inf luence behavior and, subsequently, the human-dominated water stres- sors (Figure 4) is provided in Table 4. Like techno- logical solutions, governance strategies established to address human behavior and water quality and quantity must also consider how the incentivized actions will relate to desired behavior under future conditions.
  • 30. Conclusions One challenge to solving global water problems is the large number and integrated impact of global stressors such as population and consumption, de- mographic and land-use changes, urbanization, and climate change. Another challenge is the rapid rate of change projected for all of these stressors and their resulting impacts, which are expected to accelerate even further over the next century. The large num- ber of stressors, their unknown interrelations, and the observed rapid change must all be considered when selecting and adapting new technology and governance structures for sustainable water and sanitation systems. Julie Beth Zimmerman is an assistant professor of green engineering jointly appointed to the environmental en- gineering program and the School of Forestry and Envi- 4252 ■ environmentAl SCienCe & teChnology / June 15, 2008 F I G U R E 5 Freshwater concerns Freshwater stress by country (top map) in 1995 and (bot tom map) projected for 2025 (13). People suffering from water stress and scarcity Water withdrawal as percentage of total available Population projections 1995
  • 31. Stress Scarcity 7 6 5 4 3 2 1 0 2050 Low Medium High>40 20–40 10–20 <10 People (billion) T A B L E 3 Opportunities in technology and engineering and associated challenges Opportunity Current status Challenge(s)
  • 32. Desalination More than 15,000 desalination plants operate in >125 countries, with a total daily capacity of 32.4 million m3 of water (21). significant energy demands are required (e.g., a reverse-osmosis plant needs 1.5 –2.5 kWh of electricity to produce 1 m3 of water). Emissions from brine effluent Large global population located in water-stressed areas cannot afford the technology. Long-distance water transfer Water needs of southern california re- quire 770 mi of pipes and canals, 34 reservoirs, 20 pumping plants, 3 pump- generating plants, and 5 hydroelectric power plants. Embodied energy and materials associated with transferring wa- ter and wastewater long distances are large over the life cycle. Water transfer can impact hydrology of local ecosystems at both the source and sink. Design of distributed wastewater treatment systems that con- serve water resources, nutrients, and biogas potential within the watershed (22) Water reclamation and reuse
  • 33. Water-reuse capacity is expected to increase globally from 19.4 to 54.5 mil- lion m3/day by 2015 (23). Matching demand and supply as they relate to quality of treated water for a particular use and geographical location Water efficiency/ substitution in en- gineering design industrial and agricultural sectors rep- resent >80% of global water consump- tion (24). Large water footprints in agriculture are caused by inappropriate water pricing, subsidies, inefficient technology, and the lack of water-saving measures (5). Decreasing embodied (virtual) water associated with process or product through disruptive or “leapfrog” innovations Appropriate water technologies point-of-use treatment technologies provide a barrier to pathogen exposure and are a possible solution when cen- tralized systems are ineffective or in- appropriate (25). health improvement studies have largely ignored nondiarrhea water-borne diseases (e.g., typhoid, hepatitis A) and water- washed diseases (e.g., trachoma).
  • 34. Does not provide as many nonhealth benefits compared with source improvements, and noneconomic factors (e.g., compatibil- ity, complexity) need to be integrated with adoption. June 15, 20 0 8 / env ironmentA l SCienC e & t eChnology ■ 4253 ronmental Studies at Yale University, and she serves as the associate director for research at the Center for Green Chemistry and Green Engineering at Yale. James R. Mi- helcic is a professor of civil and environmental engineer- ing at Michigan Technological University and serves as the director of the master’s international program in en- gineering. James Smith is a professor of environmental and water resources engineering in the department of civil and environmental engineering at the University of Virginia. Address correspondence about this article to Zimmerman at [email protected] References (1) Gleick, P. H.; et al. The World’s Water 2006–2007: The Bien- nial Report on Freshwater Resources; Island Press: Wash- ington, DC, 2006. (2) UN Human Settlements Programme. Water and Sanita- tion in the World’s Cities: Local Action for Global Goals; Earthscan Publications: London, 2003. (3) World Health Organization. Global Water Supply and Sanitation Assessment 2000 Report; WHO and UN Chil- dren’s Fund: New York, 2000. (4) UN Educational, Scientific, and Cultural Organization
  • 35. World Water Assessment Programme. Water for People, Water for Life; UN World Water Development Report 1; UNESCO/Berghahn Books: New York, 2003. (5) Hoekstra, A. Y.; Chapagain, A. K. Water Footprints of Na- tions: Water Use by People as a Function of Their Con- sumption Pattern. Water Resour. Manage. 2006, DOI 10.1007/s11269-006-9039-x. (6) Hoekstra, A. Y.; Hung, P. Q. Virtual Water Trade: A Quan- tification of Virtual Water Flows between Nations in Re- lation to International Crop Trade; Value of Water Report Series 11; UN Educational, Scientific, and Cultural Orga- nization–Institute of Hydraulic Engineering: Delft, The Netherlands, 2002. (7) Gleick, P. H. Water in Crisis: Paths to Sustainable Water Use. Ecol. Appl. 1998, 8, 571–579. (8) Alcamo, J.; et al. Global Change and Global Scenarios of Water Use and Availability: An Application of Water- GAP1.0; Center for Environmental Systems Research, University of Kassel: Kassel, Germany, 1997. (9) Arnell, N. W. Climate Change and Global Water Resourc- es. Global Environ. Change 1999, 9, S31–S49. (10) Meigh, J. R.; McKenzie, A. A.; Sene, K. J. A Grid-Based Ap- proach to Water Scarcity Estimates for Eastern and South- ern Africa. Water Resour. Manage. 1999, 13, 85–115. (11) Vorosmarty, C.; et al. Global Water Resources: Vulnera- bility from Climate Change and Population Growth. Sci- ence 2000, 289, 284–288.
  • 36. (12) Adger, N.; et al. Summary for Policy Makers. In Climate Change 2007: Impacts, Adaptation, and Vulnerability; Parry, M. L., et al., Eds.; Contribution of Working Group II to the Fourth Assessment Report of the Intergovern- mental Panel on Climate Change; Cambridge Universi- ty Press: Cambridge, U.K., 2007. (13) UN Environment Programme. Global Environmental Out- look: Environment for Development; Report GEO-4; Prog- ress Press: Valletta, Malta, 2007. (14) African Development Bank; et al. Poverty and Climate Change: Reducing the Vulnerability of the Poor through Adaptation; 2003; w w w.unpei.org/PDF/Povert y-and- Climate-Change.pdf. (15) Fry, L. M.; Mihelcic, J. R.; Watkins, D. W. Water and Non- Water-Related Challenges of Achieving Global Sanitation Coverage. Environ. Sci. Technol. 2008, 42, 4298–4304. (16) Crutzen, P. J. The Anthropocene: The Current Human- Dominated Geological Era—Human Impacts on Climate and the Environment. In Climate Change and Its Effect on Sustainable Development, Proceedings of the Global Environmental Action International Conference, Tokyo, Oct 14–16, 2005; GEA: Tokyo, 2005. (17) Meybeck, M.; Vörösmarty, C. The Integrity of River and Drainage Basin Systems: Challenges from Environmen- tal Changes. In Vegetation, Water, Humans and the Cli- mate: A New Perspective on an Interactive System; Kabat, P., et al., Eds.; International Geosphere–Biosphere Pro-
  • 37. gramme Global Change Series; IGBP/Springer-Verlag: Berlin, 2004. (18) McMichael, A. J.; et al. Global Climate Change. In Com- parative Quantification of Health Risks: Global and Re- gional Burden of Disease Attributable to Selected Major Risk Factors; Ezzati, M., et al., Eds.; World Health Organi- zation: Geneva, 2004; Vol. 2, Chapter 20, pp 1543–1650. (19) UN Food and Agriculture Organization. The State of Food and Agriculture 2003–2004: Agricultural Biotechnology— Meeting the Needs of the Poor?; FAO Agriculture Series No. 35; FAO: Rome, 2004; www.fao.org/docrep/006/Y5160E/ Y5160E00.htm. (20) Jury, W. A.; Vaux, H., Jr. The Role of Science in Solving the World’s Emerging Water Problems. Proc. Natl. Acad. Sci. U.S.A. 2005, 102 (44), 15,715–15,720. (21) Service, R. F. Desalination Freshens Up. Science 2006, 313 (5790), 1088–1090. (22) Pinkman, R. Valuing Decentralized Wastewater Technolo- gies: A Catalog of Benefits, Costs, and Economic Analysis Tech- niques; Rocky Mountain Institute: Snowmass, CO, 2004. (23) Global Water Intelligence. Water Reuse Markets 2005– 2015: A Global Assessment and Forecast; Media Analytics: Ox- ford, U.K., 2005. (24) Oki, T.; Kanae, S. Global Hydrological Cycles and World Water Resources. Science 2006, 313 (5790), 1068–1072.
  • 38. (25) Montgomery, M. A.; Elimelech, M. Water and Sanitation in Developing Countries: Including Health in the Equa- tion. Environ. Sci. Technol. 2007, 41 (1), 17–24. (26) Pirie, R. L.; de Loe, R.C.; Kreutzwiser, R. Drought Planning and Water Allocation: An Assessment of Local Capacity in Minnesota. J. Environ. Manage. 2004, 73 (1), 25–38. (27) Ramaswami, R.; Zimmerman, J. B.; Mihelcic, J. R. Inte- grating Developed and Developing World Knowledge into Global Discussions and Strategies for Sustainabili- ty. Part 2: Economics and Governance. Environ. Sci. Tech- nol. 2007, 41 (10), 3422–3430. (28) Clasen, T., et al. Cost-Effectiveness of Water Quality In- Cost-Effectiveness of Water Quality In- terventions for Preventing Diarrhoeal Disease in Devel- oping Countries. J. Water Health 2007, 5 (4), 599–608. (29) Olmstead, S. M.; Hanemann, W. M.; Stavins, R. N. Water Demand under Alternative Price Structures. J. Environ. Econ. Manage. 2007, 54 (2), 181–198. (30) Rogers, P.; Silva, R. D.; Bhatia, R. Water Is an Economic Good: How To Use Prices To Promote Equity, Efficiency, and Sustainability. Water Policy 2002, 4, 1–17. T A B L E 4 Examples of governance and economic issues associated with managing water Governance strategy Opportunities and challenges
  • 39. technology incentives interventions by governments through funding, purchase commitments, regulatory driv- ers, and voluntary programs can influence the success or failure of a given technology. Decisions to support certain technologies should consider performance under current and future conditions that integrate multiple stressors and acknowledge the rapid changes in stressors. Water valuation population and other stressors will increase demand for water, which is currently underval- ued relative to other scarce natural resources. increases in population and wealth will shif t demand among agricultural, industrial, and domestic sectors in many parts of the world; this will affect land use, energy demand, and climate change and, in turn, will impact water quantity, quality, and availability. of ten much of the value of water is unaccounted for in the price (30). Full-cost water assessments require that the value be related to economic, environmental, and social (including health) benefits. By using the full cost of water to influence prices, the market can potentially contribute to sustainable water systems through innovations in effi- ciency, water substitution, and conservation to avoid higher costs. this will reduce the im- pacts of individual and combined stressors, thereby reducing demand.
  • 40. Gray water regulations Establishing dual water-quality standards (drinking water vs service water) can significant- ly enhance the adoption rate of water-recovery and -reuse systems. Because of the grow- ing drivers for conservation, an opportunity exists to quantify the risks and benefits of water-reuse systems, define the appropriate scale, and develop regulations to support im- plementation. Management of gray water provides an opportunity to bet ter manage nu- trients primarily found in black water and to integrate the gray water resource with local agricultural activities. this can mitigate several stressors, including those related to pro- viding food for a growing population through agriculture and land-use changes, by reduc- ing the demand for freshwater and the energy related to water treatment through recycling and reuse. 4254 ■ environmentAl SCienCe & teChnology / June 15, 2008 CENE 599 – Rural Water / Wastewater Spring 2016 Study Guide Stressors on Global Water Quality and Quantity
  • 41. Zimmerman, et al., 2008 1) What is a national water footprint? 2) Water use is often measured in units of volumes consumed per time, what is another way to measure water use that is mentioned in the paper? Name an example of an indicator for this alternative measure. 3) Which continent has the most water availability per capita? Which has the least? 4) What is virtual water? 5) Name some continents and/or regions in which most nations are generally strong importers of virtual water. 6) Name some nations that do not reflect the greater regional trend surrounding them concerning the importation/exportation of virtual water. 7) Are water withdrawals in 2025 projected to increase more within the developed or developing world? 8) As a whole, is the greatest portion of BOD loading to waterways from industrial, residential, or
  • 42. agricultural sectors? Are the same trends relating the three true for OECD vs Non-OECD countries as a whole? 9) What are the main stressors discussed in the paper, and is it best to think of these stressors as integrated with each other or not? 10) What are the most likely major impacts of climate change on water availability described in Table 1? 11) Why is the coastal-urban interface especially sensitive to the integrated stressors mentioned in the paper, and in general what has been the characteristic shape of all global water stressors? 12) According to the “low” projection in Figure 5; how many people will be affected by water scarcity and stress in 2050? How many face water scarcity and stress as of 1995? 13) Name a potential benefit accompanying a likely climate change impact mentioned in Table 1.