2. Motivations for CEOR
2
⚫Low primary recovery with little reservoir support
⚫Low waterflood recovery
Mobility ratio is unfavorable, (M>~50)
Reservoir heterogeneity leads to premature water
breakthrough
Viscous fingering
0.10
0.00
0.20
0.30
0.50
0.40
0.60
0.70
0.80
0.90
1.00
0.00 0.10 0.20 0.30 0.70 0.80 0.90 1.00
0.40 0.50 0.60
Water Saturation, Sw
Fractional
Flow
of
Water,
f
w
Water:
Mo
= 54
Polymer:
Mo
= 0.3
Surfactant:
Mo
= 2
3. Chemical Methods of EOR
3
⚫ Surfactants:
Lower the IFT between the oil and water
Change the wettability of the rock
Generate foams or emulsions
⚫ Polymers:
Water soluble polymers to increase the
Method Reduce
Mobility
ratio
Reduce Sor Modify Pore
Structure
P ++ +
S+P or M+ P + ++ +
A +
viscosity of the water Papay, 200
Polymer gels for blocking or diverting flow
⚫ Alkaline agents:
React with crude oil to generate soap and
increase pH
⚫ Combinations of chemicals and
variants
ASP (Alkali-Surfactant-Polymer) flooding
MP (Micellar-Polymer) flooding
Brightwater flooding
Low Salinity water flooding
3. P=Polymer, S=Surfactant, M=Micellar, A=Alkaline
4. 1. Polymer Flooding
krd
d
D SD
Sd
M
4
Polymer-augmented waterflooding asamobilitycontrolagent is to provide better displacement
andvolumetric sweepefficiencies during awaterflood
Mobility of displacing fluid
krD
Mobility of displaced fluid
𝑆𝑑
𝑆𝐷
5. Polymer Flooding: Introduction
5
⚫ Mature method with 40+ years of commercial applications
⚫ Polymer injection is more popular than other CEOR at a lower risk and a wider range of reservoir conditions.
⚫ The range of recovery with polymer is 5-30% of OOIP (Courtenay, France), and efficiency is in the range of 0.7-
1.75 lb/bbl of incremental oil production
⚫ Loss to rock by adsorption, entrapment, salt reactions
⚫ Loss of injectivity
⚫ High velocity shear (near wellbore), ageing, cross-linking, formation plugging
mixing zone
Polymer Flood
drive
water
polymer slug water
oil
residual oil
6. Polyacrylamide Polymer
6
• Hydrolyzed polyacrylamide (HPAM) is probably the only commonly used EOR polymer, and can be used up to about 185
F depending on the brine hardness.
• Molecular weights up to 30 million now available at the same cost as 8 million 30 years ago--about $1.50/lb
• Quality has improved
• Modified polyarcrylamides such as HPAM- AMPS co-polymers cost a little more ($1.75/lb) but have better calcium
tolerance
Synthetic polymer
Linear, flexible macromolecule
Molecular weight ~ 5 to 30 million Partially-Hydrolyzed Polyacrylamide
Supplied as a powder, gel or emulsion –– CH2 – C H – CH2 – C H – CH2 – C H –––
Cost-effective among available polymers C = O C = O C = O
n
Polymer flooding may be limited by reservoir conditions NH2 O-Na+ NH2
Sensitive to salinity and divalent ions
Shear stability/ Mechanical degradation
9. Xanthan Polymer
9
Xanthan gum
Bacterial fermentation product
Semi-flexible macromolecule
Molecular weight ~ 2 to 8 million
Supplied as a powder or a crude fermentation
broth
Sensitive to biodegradation
Broader polymer flooding applications than PAM
High-salinity and shear tolerant
More expensive than PAM
13. Polymer Rheological Properties
13
⚫ The mechanical degradation is generated directly at the injection point
⚫ The chemical degradation happens a few hours after injection and polymer solution is then stable
Viscosity
cps
Mechanical
degradation
Chemical
degradation
Stable fluid
Time
14. Effect of Salinity on HPAM
14
• When salt is added to a polymer solution, the repulsive forces
are screened by a double layer of electrolytes and extension is
reduced.
• As the electrolyte concentration increases, the extension of
polymer chain decreases and the solution viscosity declines
• The effect of divalent-ion concentration on relative
viscosity is more pronounced than sodium-ion
concentration because the divalent ions locate
themselves in such a way as to screen the negative
charges on the backbone more effectively
15. Polymer Retention
15
The amount of polymer retained must be determined
by experimental measurement.
Polyacrylamides used in mobility control processes
must be partially hydrolyzed to reduce adsorption to
acceptable levels
16. Methods to Determine Polymer Retention
16
Continuous injection
slug injection
Willhite and Green
17. Polymer Retention
17
Low permeability leads to
high polymer retention
• excessive mechanical
entrapment
• higher clay content
19. •
•
•
•
Inaccessible pore volume
19
Polymer molecules > some pores
The fraction of pore space not contacted by the solution
is called the inaccessible PV
Reduction in porosity due to inaccessible pores to large
size polymer molecules
Faster polymer velocity than water
• About 24% of the pore space was not accessible to the polymer
20. Permeability reduction
20
Polymer solutions reduces water mobility
Polymer solutions reduce the effective
permeability
Resistance factor is a measure of combined effect
of increased viscosity and reduced permeability
Effect of permeability reduction is assumed to be
irreversible
21. Flow Regimes of Polymer Solution
21
p
p
unC
L
kp p
p
L
22. Field Cases for Successful Polymer Flooding
22
⚫ Christopher et al. SPE 17395 (1988)
Good example of quality control process
⚫ Koninget al. SPE 18092 (1988)
High viscosity oil
⚫ MaitinSPE 24118 (1992)
Incremental recovery of 8 to 22% OOIP reported
Good example of individual well responses
⚫ Takagi et al. SPE 24931 (1992)
History match of polymer flood pilot
⚫ Putzet al. SPE 28601 (1994)
Very good performance in high perm sand
Example of good data on produced polymer
⚫ Wang et al. SPE 77872 (2002)
⚫ Chang et al. SPE 89175 (2006)
World's largest polymer flood at Daqing-235 MMBbls(2004) with incremental recovery of 12% OOIP
23. Daqing Polymer Injection
⚫ Project description
2000+ wells now injecting polymer at Daqing
Typical slug size is 0.6 PV
Most well patterns are 5-spot
About 30-50% of injected polymer is produced.
Maximum produced polymer onc. Is approx. 2/3 of
injected
23
Lessons Learned:
• Higher initial water cut results in lower incremental
gains in recovery (see figure to left)
• The total cost of polymer flooding ($6.60/bbl inc. oil)
is actually less than for waterflooding ($7.85/bbl inc.
oil) due to decreased water production and increased
oil production.
• More heterogeneous reservoir:
– larger increase in sweep efficiency
– shorter response time to polymer flooding
–strongest influence on recovery is connectivity of pay
zones
• To obtain higher recovery with polymer flooding:
– lower producer WHP
– stimulate producers
– increase polymer concentration
– increase polymer molecular weight
24. Favorable Characteristics for Polymer
Flooding
24
⚫ Good geological continuity
⚫ High remaining oil saturation (>Sor)
⚫ High permeability and porosity
⚫ Sufficient vertical permeability to allow polymer to induce crossflowin
reservoir and good geological continuity
⚫ High polymer concentration and slug size
⚫ High injectivity due to favorable combination of high permeability,
wells, or injection of parting pressure
⚫ Fresh water and/or soft water
⚫ Reservoir temperatures less than 220 F
26. Capillary Desaturation Curve
26
⚫ Purpose is to reduce the IFT;
⚫ Limitations mainly come from high viscosity of
emulsions on microemulsions and high retention
as a result of adsorption on rock surface.
⚫ Variations
Surfactant-Polymer Flood (SP)
Low Tension Polymer Flood (LTPF)
⚫ Slug dissipation due to dispersion
⚫ Slug dilution by water
⚫ Formation of emulsions
Treatment and disposal problems
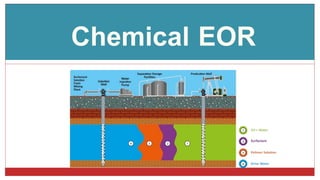
27. Surfactant Flooding
27
Inject Produce
Chas
e
Water
Taper
Polymer
electrolyte
Mobilit
y
Buffer
Polymer
Electrolyte
Chemic
al Slug
Surfact
ant
cosolvent
polymer
Preflush
Electrolyt
e Na+, C+
a+
Sacrifice
chemical
s
Initia
l
res.
Oil
and
water
electrolyte
Requires small well spacing
Requires large initial investment
Large amount of chemicals
Oil production is delayed therefore
low rate of return
0.1 - 0.5 PV Surf. Slug
0.1 to 4 wt% surfactant
250 to 2000 ppm Polymer
Polymer drive (250-2000 ppm polymer)
Water postflush
28. Surfactants
28
• A surfactant, or surface active agent, is any substance that lowers the energy barrier between two immiscible phases
• A surfactant molecule consists of two parts.
o Hydrophilic part (water-soluble)
o Hydrophobic part (oil-soluble)
Air Oil
Interface
Water Water
• Hydrophobic portion can stick out of the • Surfactant molecules will be drawn into the oil-
water (air is more hydrophobic than water interface
water) • Hydrophobic portion exists in oil and Hydrophilic
portion exists in water
30. Micelles and Microemulsion
30
Description of Microemulsions
⚫Thermodynamically stable and swollen micellar solutions should not be
confused with macroemulsions
⚫Forming stable microemulsions rapidly is cornerstone of application of
surfactants for enhanced oil recovery
31. Surfactant Adsorption Isotherm
31
1. Region I was a region of low adsorption densities.
• Monomers adsorption primarily from electrostatic
forces between surfactant ions and the charged solid
surface.
2. Region II, the adsorption was due to the electrostatic
attraction between the ions and the charged solid surface
and hemimicelles association of hydrocarbon chains.
• This transition from region II to region III was
marked by a decrease in the slope of the isotherm.
3. In region III the surfactant ions were probably due to the
association between the hydrocarbon chains.
4. Region IV was called the plateau adsorption region.
• The transition from region III to region IV usually
occurs above the CMC of the surfactant.
32. No energy input
Sheth et al., 2020, Natural Reviews Materials, 5, 214-228
32
Need energy input
Kinetically stable
and nonreversible
Reversible
33. 33
e.g 500 nm
e.g 5 nm
Hydrophobe
(Oil-soluble)
Hydrophile
(Water-soluble)
Soap
Non-ionic Ethoxylates
H2 H2
H3C C mC
H2 H2
O C C O n H
Hydrophobe
(Oil-soluble)
Hydrophile
(Water-soluble)
Hydrophobe
(Oil-soluble)
Hydrophile
(Water-soluble)
Linear Alkylbenzene Sulfonate
34. Surfactant Phase Behavior
34
⚫Winsor Type I Behavior
Oil-in-water microemulsion
Surfactant stays in the aqueous phase
Difficult to achieve ultra-low IFT.
⚫Winsor Type II Behavior
Water-in-Oil Microemulsion
Surfactant lost to the oil and observed as
surfactant retention
Should be avoid in EOR
oil Water
micelles
Reverse micelles
35. Matching the Surfactant to the Oil
35
Winsor type III:
• Surfactants with an equal attraction to the oil and water are optimum
• Separate microemulsion phase
• Bicontinuous layers of water, dissolved hydrocarbons
• Ultra-low IFT~0.001 dynes/cm
• Desirable for EOR
36. Phase Transition for Type I-III-II
36
Transition from Type I-III-II
• Increase electrolyte
• Alcohol concentration
• Temperature
• Surfactant tail length
• EACAN
• Pressure
37. Surfactant Types
37
⚫Anionic surfactants preferred
Low adsorption at neutral to high pH on both sandstones and carbonates
Can be tailored to a wide range of conditions
Widely available at low cost in special cases
Sulfates for low temperature applications
Sulfonates for high temperature applications
Cationics can be used as co-surfactants
⚫Non-ionic surfactants have not performed as well for EOR as
anionic surfactants
38. Surfactant Ionic Type Classification
38
Soaps
Anionic surfactants preferred: Low adsorption at
Sulfates
Anionics Sulfonates neutral to high pH on both sandstones &
Phosphates carbonates; low cost in special cases.
Sulfosuccinates
Ethoxylated alcohol
Nonionics Ethoxylated sorbitan fatty ester
Sulfoxides
Surfactants
Amine oxides Cationics: Can be used
Cationics Amine salts as co-surfactants
Quaternary ammonium
Imidazoline
Betaines
Amphoterics Sulfobetaines
Amino acid
Lecithins
39. Surfactant Selection Criteria
39
⚫ High solubilization ratio at optimum (ultra low IFT)
⚫ Commercially available at low cost
⚫ Feasible to tailor to specific crude oil, temperature and salinity
⚫ Highly branched hydrophobe needed for low viscosity micelles and microemulsions
⚫ Low adsorption/retention on reservoir rock
⚫ Insensitive to surfactant concentration above CMC and low CMC
⚫ Minimal propensity to form liquid crystals, gels, macroemulsions
– Microemulsion viscosity < 10 cp
⚫ Rapid coalescence to microemulsion
– Undesirable if greater than a few days and preferably less than one day
–Slow coalescence indicates problems with gels, liquid crystals or
macroemulsions
40. Phase Behavior Experiments
40
⚫Phase behavior experiments
Inexpensive technique to screen surfactants
Measure solubilization parameters/IFT’s
Measure coalescence/equilibration time
Determine microemulsion viscosities
⚫ Specific surfactants can be tailored for specific oils
⚫Coalescence time: defined as the time to reach phase equilibrium;
should be less than 40 hours.
42. Microemulsion Phase Behavior
42
Solubilization Parameters (SP): mL of oil solubilized per gram of surfactant, increase SP for more efficient
surfactant
43. Solubilization Parameters
43
Healy et al. expressed the amount of oil and water solubilized by a unit of
surfactant in terms of solubilization parameters as follows:
P
Vo
V. of Oil in ME
o
V V. of Surfactant in ME
s
P
Vw
V. of Water in ME
w
V V. of Surfactant in ME
s
Vs is the volume of surfactant and does not include co-surfactant
44. Salinity Impact on IFT
44
• 𝜎𝑚𝑜 decreases as salinity increase
• Increasing solubilization of oil from the excess phase into the
microemulsion, yielding a low-density ME.
• Both 𝜎𝑚𝑜 and 𝜎𝑚𝑚𝑚are defined in the middle-phase environment.
• 𝜎𝑚𝑜 = 𝜎𝑚𝑚𝑚: optimal salinity, very close to optimal salinity for
phase behavior.
4.80
• Nelson model: logmo,mw 5.4
1 0.21V /V '
o,w s
• Huh’s model: 𝐶ℎ𝑢ℎ 𝜎 =
𝐶ℎ𝑢ℎ
𝜎𝑜𝑚 =
𝑉 2 𝑚
𝑚
𝑚
𝑉 2
𝑜 𝑚
𝑚
Where 𝑉𝑠
𝑉𝑠
Chuh : Huh’s constant
Lowest possible IFT, the highest possible SP
50. Variables Affecting Phase Behavior and IFT
50
• Effect of oil type
• Cosurfactant type
• Temperature/Pressure
• Divalent ions
• Surfactant structure
51. Adsorption
0
1
2
3
4
5
6
7
0 5 25 30
Adsorbed
Surfactant
Concentration,
mol/g
10 15 20
Surfactant Concentration in Microemulsion, mmol/L
UTCHEM model
Measured data of Shiau et al., 1994
3 3 3
3
3
C Ĉ
~
1 b
a3
C
~
3 Ĉ3
~
min C ,
Ĉ
a3 a31 a32CSE
Where
Ĉ3 = adsorbed surfactant concentration
3
C
~ = overall surfactant concentration
51
Surfactant Adsorption (Langmuir Isotherm)
52. Favorable Characteristics for Surfactant Flooding
52
• High permeability and porosity
• High remaining oil saturation (>25%)
• Light oil less than 50 cp--but recent trend is to apply to viscous oils up to 200 cp or
even higher viscosity
• Short project life due to favorable combination of small well spacing and/or high
injectivity
• Onshore
• Good geological continuity
• Good source of high quality water
• Reservoir temperatures less than 300 F for surfactant and less than 220 F if
polymer is used for mobility control
53. Alkaline Flooding
53
⚫ Process depends on mixing of alkali and oil
Oil must have acid components (petroleum acids), usually low API gravity oil
⚫ Emulsification of oil, drop entrainment and entrapment occur
Effect on displacement and sweep efficiencies?
⚫ Polymer slugs used in some cases
– Polymer alkali reactions must be accounted for
⚫ Complex process to design
mixing
zones
low
drive caustic IFT water
water slug zone
oil
residual oil
Alkaline Flood
De Zabala et al., 1982
54. High pH and/or ASP Flooding
54
⚫ Surfactant adsorption is reduced on both sandstones and carbonates at high pH
⚫ Alkali is inexpensive, so the potential for cost reduction is large
⚫ Carbonate formations are usually positively charged at neutral pH, which favors adsorption of
anionic surfactants. However, when Na2CO3is present, carbonate surfaces (calcite, dolomite)
become negatively charged and adsorption decreases several fold
⚫ Alkali reacts with acid in oil to form soap, but not all crude oils are reactive with alkaline
chemicals
⚫ High pH also improves microemulsion phase behavior
⚫ Mobility control is critical. According to Malcolm Pitts, 99% of floods will fail without mobility
control
⚫ Floods can start at any time in the life of the field
⚫ Good engineering design is vital to success
⚫ Laboratory tests must be done with crude and reservoir rock under reservoir conditions and are
essential for each reservoir condition
55. ASP: Alkali-Surfactant-Polymer Flooding
55
⚫ Several variations:
ASP
SAP
PAS
Sloppy Slug
FieldtestshavebeenencouragingSuccessful inbankingand
producingresidual oil
Mechanismsnot fullyunderstood
Injected as premixed slugs or in sequence
ASP Flood
oil bank
Surf
alkali
drive
water polymer
oil
water
Core length, 27.79 cm
Porosity, 0.19
Permeability: 448 mD
Oil viscosity: 3 cp
The core was originally saturated with 3 wt% NaCl brine
0.1 PV Surfactant slug-3% surfactant (IOS C20-24), 2500 ppm polymer (AN125),1.0% Na2CO3+1.9% NaCl
Polymer drive-2500 ppm polymer, 1.0% Na2CO3 +1.0% NaCl
56. Micellar Flooding
56
⚫ Utilizes microemulsion and polymer buffer slugs
⚫ Miscible-type displacement
⚫ Successful in banking and producing residual oil
⚫ Process limitations:
Chemical slugs are costly
Small well spacing required
High salinity, temperature and clay
Considerable delay in response
Emulsion production
mixing
zone
drive
water
micellar slug
polymer
water
oil
bank
mixing zone
Micellar Flood
57. Alkali/ASP flooding
57
• Alkali reacts with acids in crude oil to form soap and thus reduces the need for synthetic surfactant
• Improves microemulsion phase behavior
• Alkali increases pH and reduces surfactant adsorption
• Stabilizes alkoxy sulfate surfactants at high temperature
• Can be used to control salinity gradient
• Sodium carbonate protects HPAM polymer
• Makes it easier to satisfy aqueous stability since a hydrophilic surfactant can be used to balance soap
• Can be used with co-solvent in ACP process
Alkali is inexpensive and reduces overall chemical cost
58. Alkali/ASP flooding
58
Partitioning of acid component between H A KDHA
o w
oil and aqueous phase HAw
K D
H A
o
Dissociation of acid component in the presence of
alkali to produce soluble anionic surfactant (A-)
HAo : Concentration of acid in oil
HAw : Concentration of acid in water
KD : Partition coefficient of HAo
HA
Ka
H A
w
H A
Ka
HAw
59. Alkali Effect on Surfactant Adsorption
Surfactant adsorption is reduced on
both sandstones and carbonates at
high pH
Alkali is inexpensive, so the potential
for cost reduction is large
Carbonate formations are usually
positively charged at neutral pH,
o Favors adsorption of anionic
surfactants at neutral pH
o When Na2CO3 is present, carbonate
surfaces (calcite, dolomite) become
negatively charged and adsorption
decreases several fold
0.0
0.5
1.0
1.5
2.0
2.5
3.0
3.5
59
4.0
0.0 0.5 1.0 1.5 2.0
Residual Surfactant Concentration (mmol/L)
Adsorption
Density,
10
-3
mmol/m
2
3% NaCl
5% NaCl
5% NaCl
without alkali
3% NaCl
with ~1% Na CO
2 3
From Hirasaki
60. CEOR-General Limitations & Failure Reasons
60
⚫ Cost of chemicals
Excessive chemical loss: adsorption, reactions with clay and brines, dilution
⚫ Gravity segregation
Lack of control in large well spacing
⚫ Geology is unforgiving!
Great variation in the process mechanism, both areal and cross-sectional
Insufficient description of reservoir geology
o Permeability heterogeneities
o Excessive clay content
o High water saturation
o Bottom water or gas cap
o Fractures
Inadequate understanding of process mechanisms
Unavailability of chemicals in large quantities
Heavy reliance on unscaled lab experiments
61. Upscaling Experimental Results
61
⚫ Require:
Knowledge of process variables or complete mathematical description
Derivation of scaling groups
Model experiments
Scale-up of model results to field
⚫ Greater confidence to extend lab results to field