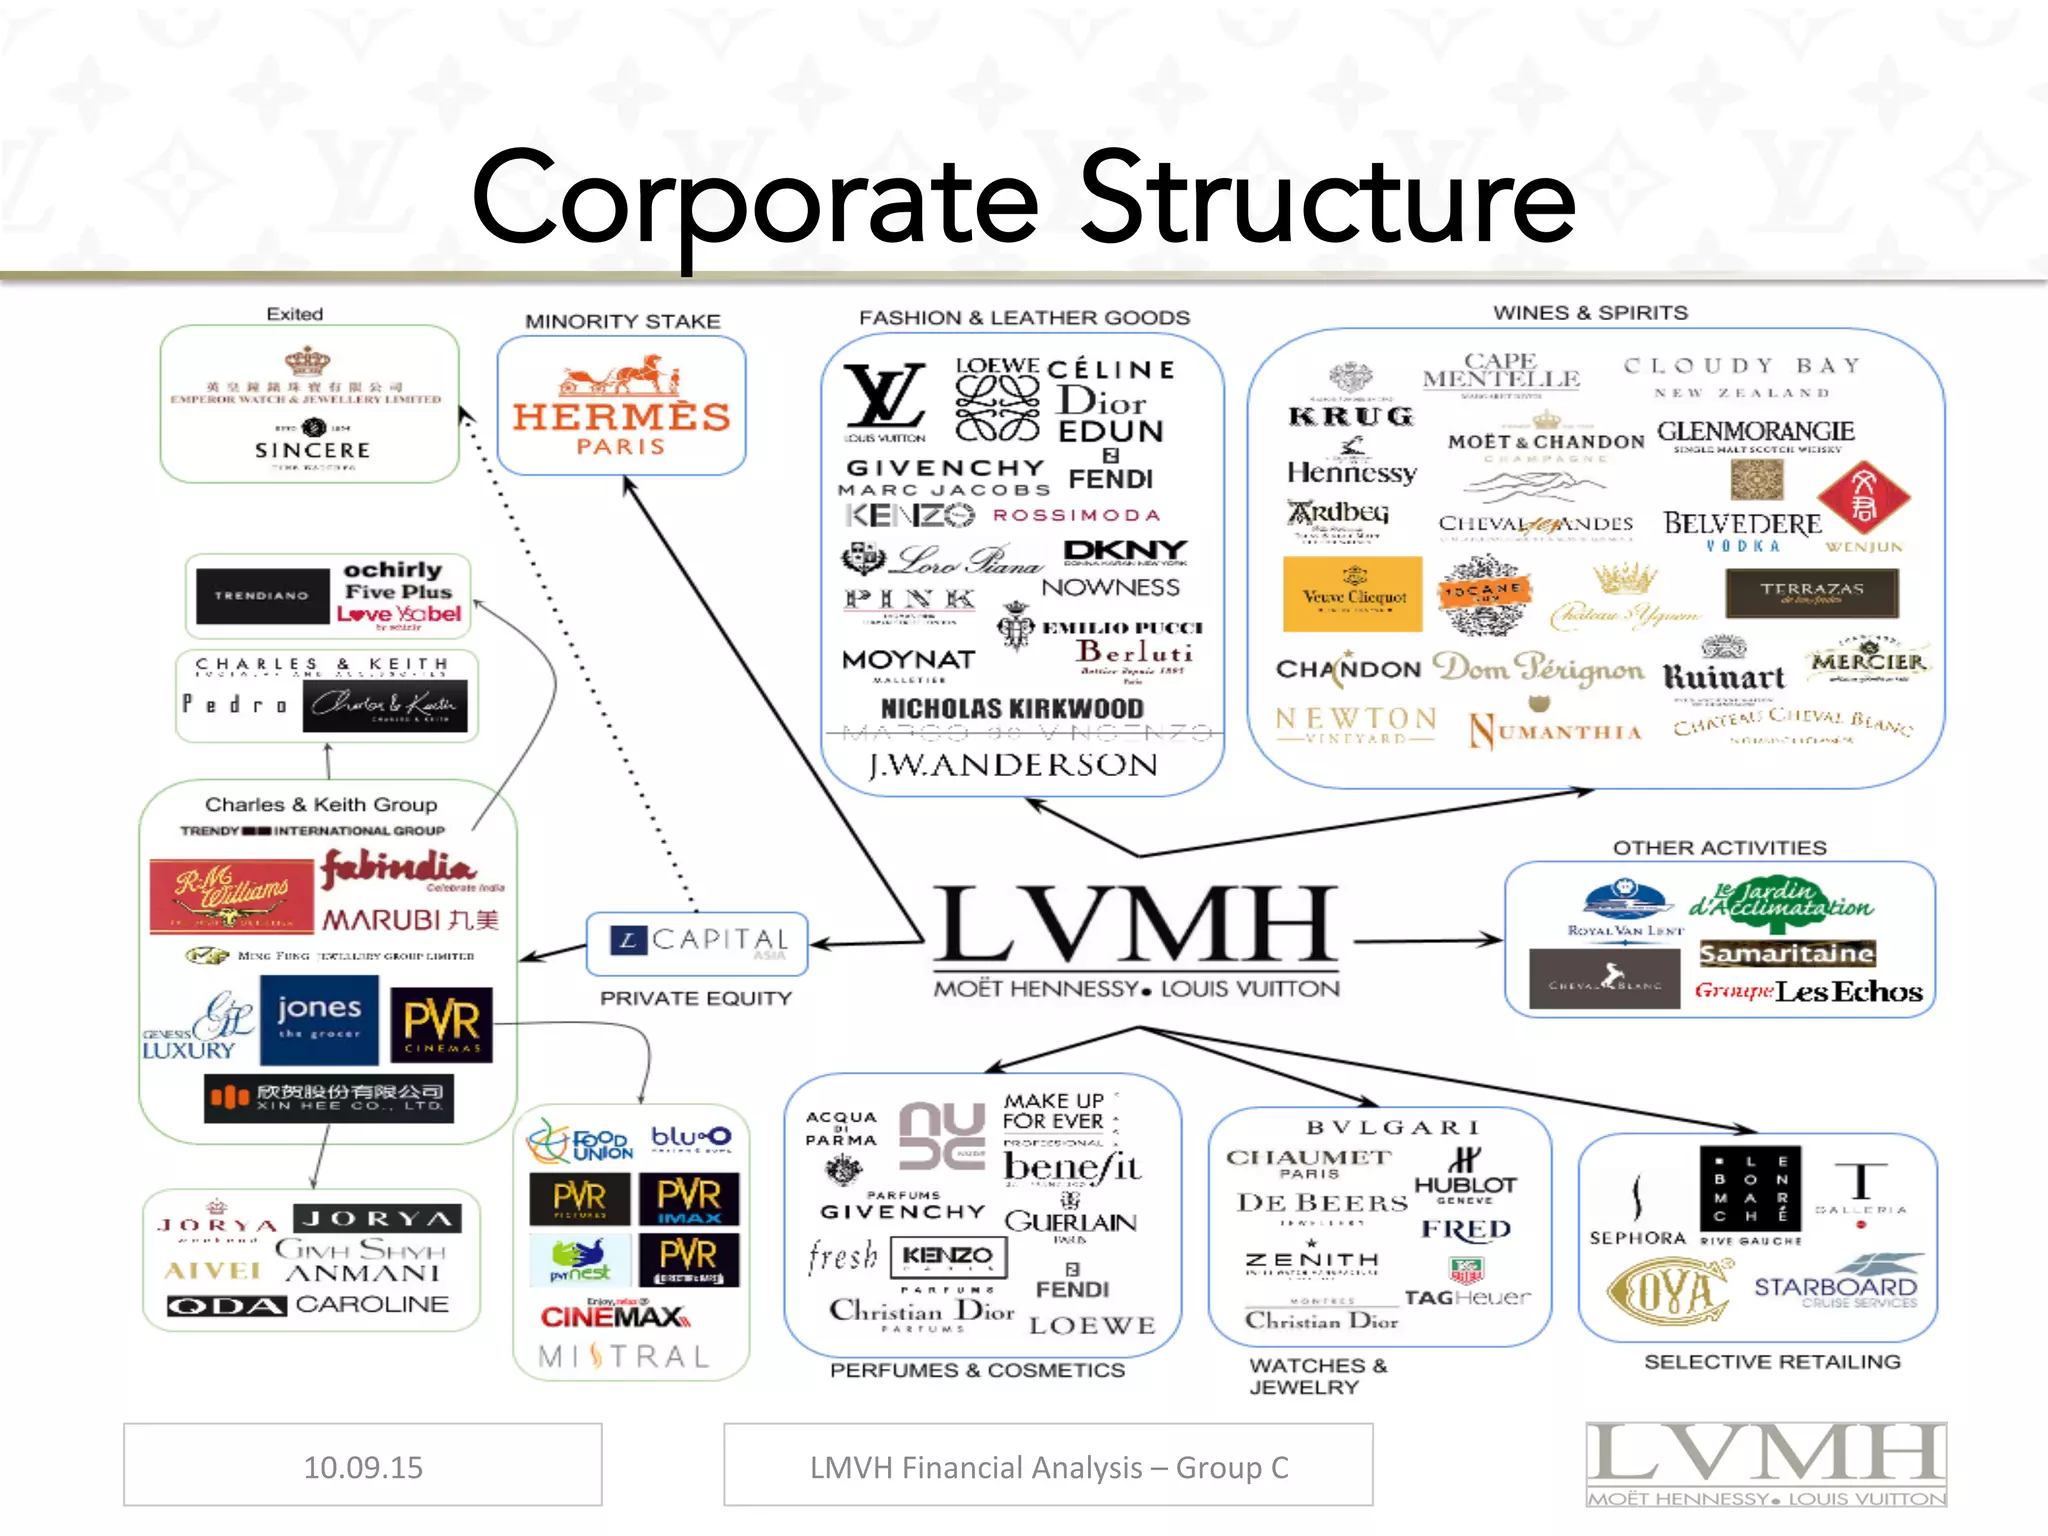
LVMH
MOËT HENNESY LOUIS VUITTON
FINANCIAL ANALYSIS
by
GROUP C – Master in Management 2015
Company Profile
•  French luxury
conglomerate
•  Founded in Paris in 1987
•  Merger between Moët
Hennessy & Louis Vuitton
•  3708 stores worldwide
10.09.15	
   LMVH	
  Financial	
  Analysis	
  –	
  Group	
  C	
  
•  Highly dependent on consumer preferences & short-living fashion
trends
•  Difficulty to establish long-term brand loyalty
•  Relatively unaffected by macroeconomic trends
•  Group of „portfolio companies“ dominating the market:
	
  
Industry Overview
10.09.15	
   LMVH	
  Financial	
  Analysis	
  –	
  Group	
  C	
  
Corporate Strategy
•  Conglomerate of luxury companies
•  Diverse brand portfolio through M&A activity
•  Mother company set values for different companies but
leave autonomy to fashion designers
•  Owning stores (prime CRE) & land (Champagne)
10.09.15	
   LMVH	
  Financial	
  Analysis	
  –	
  Group	
  C	
  
•  1984 acquired and became CEO
of Christian Dior
•  1987 helped mediate a conflict at
LVMH
•  1988 gained control at LVMH as a
large stakeholder preventing
dismantlement
•  90‘s - present: Made LVMH what it
is today through long list of
acquisitions
	
   10.09.15	
   LMVH	
  Financial	
  Analysis	
  –	
  Group	
  C	
  
Le Chef – Bernard Arnault
10.09.15	
   LMVH	
  Financial	
  Analysis	
  –	
  Group	
  C	
  
Corporate Structure
Complex Holding Structure
10.09.15	
   LMVH	
  Financial	
  Analysis	
  –	
  Group	
  C	
  
Geographical Presence
10.09.15	
   LMVH	
  Financial	
  Analysis	
  –	
  Group	
  C	
  
Wines & Spirits
10.09.15	
   LMVH	
  Financial	
  Analysis	
  –	
  Group	
  C	
  
Revenues and Investments of LVMH in 2014
Fashion & Leather Goods
10.09.15	
   LMVH	
  Financial	
  Analysis	
  –	
  Group	
  C	
  
Revenues and Investments of LVMH in 2014
Perfumes & Cosmetics
10.09.15	
   LMVH	
  Financial	
  Analysis	
  –	
  Group	
  C	
  
Revenues and Investments of LVMH in 2014
Watches & Jewelry
10.09.15	
   LMVH	
  Financial	
  Analysis	
  –	
  Group	
  C	
  
Revenues and Investments of LVMH in 2014
Selective Retailing & Other Activities
10.09.15	
   LMVH	
  Financial	
  Analysis	
  –	
  Group	
  C	
  
Revenues and Investments of LVMH in 2014
Assets
Consolidated	
  Balance	
  Sheet	


(EUR	
  millions,	
  except	
  for	
  earnings	
  per	
  share)	


ASSETS	
   2012	
  	
   %	
  of	
  TA	
  2013	
  	
   %	
  of	
  TA	
  2014	
  	
   %	
  of	
  TA	
  
(EUR	
  millions)	


Brands	
  and	
  other	
  intangible	
  fixed	
  assets	
   11.322	
  	
   23%	
   12.596	
  	
   22%	
   13.031	
  	
   24%	
  
Goodwill	
   7.709	
  	
   15%	
   9.058	
  	
   16%	
   8.810	
  	
   17%	
  
Property,	
  plant	
  and	
  equipment	
   8.694	
  	
   17%	
   9.621	
  	
   17%	
   10.387	
  	
   19%	
  
Investments	
  in	
  joint	
  ventures	
  and	
  associates	
   483	
  	
   1%	
   480	
  	
   1%	
   519	
  	
   1%	
  
Non-­‐current	
  available	
  for	
  sale	
  financial	
  assets	
   6.004	
  	
   12%	
   7.080	
  	
   13%	
   580	
  	
   1%	
  
Other	
  non-­‐current	
  assets	
   519	
  	
   1%	
   457	
  	
   1%	
   489	
  	
   1%	
  
Deferred	
  tax	
   952	
  	
   2%	
   913	
  	
   2%	
   1.436	
  	
   3%	
  
Non-­‐current	
  assets	
   35.683	
  	
   72%	
   40.205	
  	
   72%	
   35.252	
  	
   66%	


Inventories	
  andwork	
  in	
  progress	
   7.994	
  	
   16%	
   8.492	
  	
   15%	
   9.475	
  	
   18%	
  
Trade	
  accounts	
  receivable	
   1.972	
  	
   4%	
   2.174	
  	
   4%	
   2.274	
  	
   4%	
  
Income	
  taxes	
   201	
  	
   0%	
   223	
  	
   0%	
   354	
  	
   1%	
  
Other	
  current	
  assets	
   1.813	
  	
   4%	
   1.856	
  	
   3%	
   1.916	
  	
   4%	
  
Cash	
  and	
  cash	
  equivalents	
   2.187	
  	
   4%	
   3.226	
  	
   6%	
   4.091	
  	
   8%	
  
Current	
  assets	
   14.167	
  	
   28%	
   15.971	
  	
   28%	
   18.110	
  	
   34%	


Total	
  assets	
   49.850	


   56.176	


   53.362	


10.09.15	
   LMVH	
  Financial	
  Analysis	
  –	
  Group	
  C	
  
Liabilities
LIABILITIES	
  AND	
  EQUITY	
   2012	
  	
   %	
  of	
  TA	
  2013	
  	
   %	
  of	
  TA	
  2014	
  	
   %	
  of	
  TA	
  
(EUR	
  millions)	


Share	
  capital	
   	
  152	


   0%	
   	
  152	


   0%	
   	
  152	


   0%	
  
Share	
  premium	
  account	
   	
  3.848	


   5%	
   	
  3.849	


   7%	
   	
  2.655	


   8%	
  
Treasury	
  shares	
  and	
  LVMH-­‐share	
  se[led	
  derivaves	
   -­‐414	


   -­‐1%	
   -­‐451	


   -­‐1%	
   -­‐374	


   -­‐1%	
  
Cumulave	
  translaon	
  adjustment	
   	
  342	


   1%	
   -­‐8	


   0%	
   	
  492	


   1%	
  
Revaluaon	
  reserves	
   	
  2.731	


   2%	
   	
  3.900	


   7%	
   	
  1.019	


   5%	
  
Other	
  reserves	
   	
  14.340	


   23%	
   	
  16.001	


   28%	
   	
  12.171	


   29%	
  
Net	
  profit,	
  Group	
  share	
   	
  3.425	


   11%	
   	
  3.436	


   6%	
   	
  5.648	


   7%	
  
Equity,	
  Group	
  share	
   	
  24.424	


   41%	
   	
  26.879	


   48%	
   	
  21.763	


   49%	
  
Minority	
  interests	
   	
  1.084	


   2%	
   	
  1.028	


   2%	
   	
  1.240	


   2%	
  
Total	
  equity	
   	
  25.508	


   43%	
   	
  27.907	


   50%	
   	
  23.003	


   51%	


Long-­‐term	
  borrowings	
   	
  3.825	


   9%	
   	
  4.149	


   7%	
   	
  5.054	


   8%	
  
Non-­‐current	
  provisions	
   	
  1.772	


   4%	
   	
  1.797	


   3%	
   	
  2.291	


   4%	
  
Deferred	
  tax	
   	
  3.884	


   8%	
   	
  4.280	


   8%	
   	
  4.392	


   8%	
  
Other	
  non-­‐current	
  liabilies	
   	
  5.456	


   12%	
   	
  6.404	


   11%	
   	
  6.447	


   11%	
  
Non-­‐current	
  liabiliVes	
   	
  14.937	


   34%	
   	
  16.630	


   30%	
   	
  18.184	


   30%	


Short-­‐term	
  borrowings	
   	
  2.950	


   8%	
   	
  4.674	


   8%	
   	
  4.189	


   6%	
  
Trade	
  accounts	
  payable	
   	
  3.118	


   7%	
   	
  3.297	


   6%	
   	
  3.606	


   6%	
  
Income	
  taxes	
   	
  442	


   1%	
   	
  357	


   1%	
   	
  549	


   1%	
  
Current	
  provisions	
   	
  335	


   1%	
   	
  324	


   1%	
   	
  332	


   1%	
  
Other	
  current	
  liabilies	
   	
  2.560	


   7%	
   	
  2.987	


   5%	
   	
  3.499	


   5%	
  
Current	
  liabiliVes	
   	
  9.405	


   23%	
   	
  11.639	


   21%	
   	
  12.175	


   19%	


Total	
  liabiliVes	
  and	
  equity	
   	
  49.850	


  56.176	


  53.362	


10.09.15	
   LMVH	
  Financial	
  Analysis	
  –	
  Group	
  C	
  
Income Statement
Consolidated	
  Income	
  Statement	


(EUR	
  millions,	
  except	
  for	
  earnings	
  per	
  share)	
   2012	


   2013	


   2014	


   CAGR	
  in	
  %	


Revenue	
   	
  27.970	


  100%	
   	
  29.016	


  100%	
   	
  30.638	


  100%	
   3%	
  
Cost	
  of	
  sales	
   	
  9.863	


   35%	
   	
  9.997	


   34%	
   	
  10.801	


   35%	
   3%	
  
Gross	
  margin	
   	
  18.107	


   65%	
   	
  19.019	


   66%	
   	
  19.837	


   65%	
   3%	


Markeng	
  and	
  selling	
  expenses	
   	
  10.013	


   36%	
   	
  10.767	


   37%	
   	
  11.744	


   38%	
   5%	
  
General	
  and	
  administrave	
  expenses	
   	
  2.151	


   8%	
   	
  2.212	


   8%	
   	
  2.373	


   8%	
   3%	
  
Income	
  (loss)	
  from	
  joint	
  ventures	
  and	
  associates	
   -­‐19	


   0%	
   -­‐23	


   0%	
   -­‐5	


   0%	
   -­‐36%	
  
Profit	
  from	
  recurring	
  operaVons	
   	
  5.924	


   21%	
   	
  6.017	


   21%	
   	
  5.715	


   19%	
   -­‐1%	


Other	
  operang	
  income	
  and	
  expenses	
   	
  182	


   1%	
   	
  119	


   0%	
   	
  284	


   1%	
   16%	
  
OperaVng	
  profit	
   	
  5.742	


   21%	
   	
  5.898	


   20%	
   	
  5.431	


   18%	
   -­‐2%	


Cost	
  of	
  net	
  financial	
  debt	
   	
  138	


   0%	
   	
  101	


   0%	
   	
  115	


   0%	
   -­‐6%	
  
Other	
  financial	
  income	
  and	
  expenses	
   	
  126	


   0%	
   -­‐97	


   0%	
   	
  3.062	


   10%	
   190%	
  
Net	
  financial	
  income	
  (expense)	
   -­‐12	


   0%	
   -­‐198	


   -­‐1%	
   	
  2.947	


   10%	
   -­‐726%	


Income	
  taxes	
   	
  1.821	


   7%	
   	
  1.753	


   6%	
   	
  2.273	


   7%	
   8%	
  
Net	
  profit	
  before	
  minority	
  interests	
   	
  3.909	


   14%	
   	
  3.947	


   14%	
   	
  6.105	


   20%	
   16%	


Minority	
  interests	
   	
  484	


   2%	
   	
  511	


   2%	
   	
  457	


   1%	
   -­‐2%	
  
Net	
  profit,	
  Group	
  share	
   	
  3.425	


   12%	
   	
  3.436	


   12%	
   	
  5.648	


   18%	
   18%	
  
10.09.15	
   LMVH	
  Financial	
  Analysis	
  –	
  Group	
  C	
  
Cash Flow Statement l
Consolidated	
  Cash	
  Flow	
  Statement	


in	
  m€	


   2012	


   2013	


   2014	
  	
  
OPERATING	
  ACTIVITIES	
  AND	
  OPERATING	
  INVESTMENTS	


Operang	
  profit	
   	
  5.742	


  5.898	


  5.431	


Income/(loss)	
  and	
  dividends	
  from	
  joint	
  ventures	
  and	
  associates	
   	
  37	


  49	


  26	


Net	
  increase	
  in	
  depreciaon,	
  amorzaon	
  and	
  provisions	
   	
  1.289	


  1.435	


  1.895	


Other	
  computed	
  expenses	
   -­‐59	


   -­‐29	


   -­‐188	


Other	
  adjustments	
   -­‐52	


   -­‐76	


   -­‐84	


Cashfrom	
  operaVons	
  before	
  changes	
  in	
  working	
  capital	
   	
  6.957	


  7.277	


  7.080	


Cost	
  of	
  net	
  financial	
  debt:	
  interest	
  paid	
   -­‐152	


   -­‐111	


   -­‐116	


Income	
  taxes	
  paid	
   -­‐1.880	


   -­‐1.832	


   -­‐1.639	


Net	
  cash	
  from	
  operaVng	
  acVviVes	
  before	
  changes	
  in	
  working	
  
capital	
  
	
  4.925	


  5.334	


  5.325	


Change	
  in	
  working	
  capital	
   -­‐810	


   -­‐620	


   -­‐718	


Net	
  cash	
  from	
  operaVng	
  acVviVes	
   	
  4.115	


  4.714	


  4.607	


Operang	
  investments	
   -­‐1.694	


   -­‐1.657	


   -­‐1.775	


Net	
  cash	
  from	
  operaVng	
  acVviVes	
  and	
  operaVng	
  
investments(free	
  cash	
  flow)	
  
	
  2.421	


  3.057	


  2.832	


10.09.15	
   LMVH	
  Financial	
  Analysis	
  –	
  Group	
  C	
  
Cash Flow Statement ll
FINANCIAL	
  INVESTMENTS	
   	
  2012	


  2013	


  2014	
  
Purchase	
  of	
  non-­‐current	
  available	
  for	
  sale	
  financial	
  assets	
   -­‐131	


   -­‐197	


   -­‐57	


Proceeds	
  from	
  sale	
  of	
  non-­‐current	
  available	
  for	
  sale	
  financial	
  
assets	
  
	
  36	


  38	


  160	


Dividends	
  received	
   	
  179	


  71	


  69	


Income	
  tax	
  related	
  to	
  financial	
  investments	
   -­‐21	


   -­‐11	


   -­‐237	


Impact	
  of	
  purchase	
  and	
  sale	
  of	
  consolidated	
  investments	
   -­‐59	


   -­‐2.161	


   -­‐167	


Net	
  cash	
  from	
  (used	
  in)	
  financial	
  investments	
   	
  4	


   -­‐2.260	


   -­‐232	


TRANSACTIONS	
  RELARING	
  TO	
  EQUITY	


Capital	
  increases	
  of	
  LVMH	
  SE	
   	
  95	


  66	


  59	


Capital	
  increases	
  of	
  subsidiaries	
  subscribed	
  by	
  minority	
  
interests	
  
	
  8	


  7	


  3	


Acquision	
  and	
  disposals	
  of	
  treasury	
  shares	
  and	
  LVMH-­‐share	
  
se[led	
  derivaves	
  
	
  5	


   -­‐113	


  1	


Interim	
  and	
  final	
  dividends	
  paid	
  by	
  LVMH	
  SE	
   -­‐1.447	


   -­‐1.501	


   -­‐1.619	


Income	
  taxes	
  paid	
  related	
  to	
  interim	
  and	
  final	
  dividends	
  paid	
   -­‐73	


   -­‐137	


   -­‐79	


Interim	
  and	
  final	
  dividends	
  paid	
  to	
  minority	
  interests	
  in	
  
consolidated	
  subsidiaries	
  
-­‐314	


   -­‐220	


   -­‐336	


Purchase	
  and	
  proceeds	
  from	
  sale	
  of	
  minority	
  interests	
   -­‐206	


   -­‐150	


  10	


Net	
  cash	
  from	
  (used	
  in)	
  transacVons	
  relaVng	
  to	
  equity	
   -­‐1.932	


   -­‐2.048	


   -­‐1.961	


Change	
  in	
  cash	
  before	
  financing	
  acVviVes	
   	
  493	


   -­‐1.251	


  639	


10.09.15	
   LMVH	
  Financial	
  Analysis	
  –	
  Group	
  C	
  
Cash Flow Statement lll
FINANCING	
  ACTIVITIES	


2012	
   2013	
   2014	
  
Proceeds	
  from	
  borrowings	
   	
  1.028	


  3.095	


  2.407	


Repayment	
  of	
  borrowings	
   -­‐1.494	


   -­‐1.057	


   -­‐2.100	


Purchase	
  and	
  proceeds	
  from	
  sale	
  of	
  current	
  available	
  for	
  sale	
  
financial	
  assets	
  
-­‐67	


  101	


   -­‐106	


Net	
  cash	
  from	
  (used	
  in)	
  financing	
  acVviVes	
   -­‐533	


  2.139	


  201	


EFFECT	
  OF	
  EXCHANGE	
  RATE	
  CHANGES	
   -­‐43	


  47	


  27	


NET	
  INCREASE(DECREASE)	
  INCASH	
  AND	
  CASH	
  EQUIVALENTS	
  
(I+II+III+IV+V)	
  
-­‐83	


  935	


  867	


CASH	
  AND	
  CASH	
  EQUIVALENTS	
  AT	
  BEGINNINGOF	
  PERIOD	
   	
  2.064	


  1.981	


  2.916	


CASH	
  AND	
  CASH	
  EQUIVALENTS	
  AT	
  END	
  OF	
  PERIOD	
   	
  1.981	


  2.916	


  3.783	


TOTAL	
  INCOME	
  TAXES	
  PAID	
   -­‐1.974	


   -­‐1.980	


   -­‐1.955	


10.09.15	
   LMVH	
  Financial	
  Analysis	
  –	
  Group	
  C	
  
Liquidity
	
  	
   2013	
   2014	
   	
  	
   2013	
   2014	
   	
  	
   2013	
   2014	
  
Test	
  of	
  liquidity	


Current	
  rao	
   1,37	
   1,49	
  	
  	
   2,07	
   1,70	
  	
  	
   1,08	
   0,91	
  
Receivables	
  turnover	
  rao	
   14,0	
   13,8	
  	
  	
   11,6	
   10,9	
  	
  	
   10,2	
   10,1	
  
Inventory	
  turnover	
  rao	
   3,5	
   3,4	
  	
  	
   8,0	
   6,4	
  	
  	
   5,3	
   5,0	
  
•  Robust liquidity figures from LVMH
•  Especially efficient receivables turnover ratio
•  Biased by Wine & Spirits division
10.09.15	
   LMVH	
  Financial	
  Analysis	
  –	
  Group	
  C	
  
Solvency
•  Robust solvency figures from LVMH
•  Operating cash flow covers interest expense better than
competitors
•  Debt-to-equity higher than competitors (due to high M&A activity)
	
  	
   2013	
   2014	
   	
  	
   2013	
   2014	
   	
  	
   2013	
   2014	
  
Test	
  of	
  Solvency	


Times	
  interest	
  earned	
   13,2	
   24,4	
   	
  	
   12,7	
   5,3	
   	
  	
   8,9	
   7,5	
  
Cash	
  coverage	
  rao	
   20,5	
   15,2	
   	
  	
   8,4	
   3,6	
   	
  	
   8,5	
   5,8	
  
Debt-­‐to-­‐equity	
  rao	
   1,01	
   1,32	
  	
  	
   0,44	
   0,57	
  	
  	
   0,96	
   1,06	
  
10.09.15	
   LMVH	
  Financial	
  Analysis	
  –	
  Group	
  C	
  
Fixed Asset Analysis
•  Efficient use of fixed asset by LVMH
•  Good Depreciation/CAPEX ratio compared to Prada
•  Average remaining life of fixed assets is similar
	
  	
   2013	
   2014	
   	
  	
   2013	
   2014	
   	
  	
   2013	
   2014	
  
Fixed	
  asset	
  analysis:	


Fixed	
  asset	
  turnover	
   3,2	
   3,1	
  	
  	
   2,9	
   2,6	
  	
  	
   5,8	
   5,6	
  
Depreciaon	
  /	
  Capex	
   54,9%	
   60,9%	
  	
  	
   281,7%	
   213,0%	
  	
  	
   25,0%	
   38,7%	
  
Years	
  to	
  depreciate	
  exisng	
  net	
  fixed	
  
assets	
  
8,6	
  years	
   7,8	
  years	
  	
  	
   6,4	
  years	
  6,1	
  years	
  	
  	
   8,7	
  years	
   7,8	
  years	
  
10.09.15	
   LMVH	
  Financial	
  Analysis	
  –	
  Group	
  C	
  
Operating Ratios
•  Slight decrease due to higher marketing expense
•  Similar EBIT margin with competitors
	
  	
   2013	
   2014	
   	
  	
   2013	
   2014	
   	
  	
   2013	
   2014	
  
OperaVng	
  raVos:	


EBITDA	
  margin	
   20,7%	
   18,7%	
  	
  	
   26,2%	
   19,8%	
  	
  	
   13,6%	
   15,5%	
  
EBIT	
  margin	
   16,5%	
   13,4%	
  	
  	
   20,8%	
   13,0%	
  	
  	
   11,6%	
   13,1%	
  
10.09.15	
   LMVH	
  Financial	
  Analysis	
  –	
  Group	
  C	
  
ROA Analysis
•  ROA analysis is complicated for LVMH due to bias from Hermès
share distribution
•  ROA seems to be constant over time leaving out Hermès effect
•  Bias by high value of CRE & brands in assets
•  Prada seems to have the most effective ROA (possible divestment)
	
  	
   2013	
   2014	
   	
  	
   2013	
   2014	
   	
  	
   2013	
   2014	
  
ROA	
  analysis	
  (EBI/Total	
  Assets)	


  EBI	
  margin	
   12,3%	
   18,9%	
  	
  	
   19,7%	
   17,0%	
  	
  	
   14,7%	
   14,0%	


  Turnover	
  rao	
  (over	
  total	
  assets)	
   0,55	
   0,56	
  	
  	
   0,92	
   0,82	
  	
  	
   0,42	
   0,44	
  
ROA	
  (%)	
   6,7%	
   10,6%	
  	
  	
   18,2%	
   14,0%	
  	
  	
   6,2%	
   6,1%	
  
10.09.15	
   LMVH	
  Financial	
  Analysis	
  –	
  Group	
  C	
  
ROE Analysis
•  ROE analysis is complicated for LVMH due to bias from Hermès
share distribution
•  ROE seems to be constant over time leaving out Hermès effect
•  Higher financial leverage due to high M&A activity financed by LT
borrowing (low interest environment)
	
  	
   2013	
   2014	
   	
  	
   2013	
   2014	
   	
  	
   2013	
   2014	
  
Decomposing	
  ROE	


  EBI	
  margin	
   12,3%	
   18,9%	
  	
  	
   19,7%	
   17,0%	
  	
  	
   14,7%	
   14,0%	


  Turnover	
  rao	
  (over	
  total	
  assets)	
   0,55	
   0,56	
  	
  	
   0,92	
   0,82	
  	
  	
   0,42	
   0,44	


  Financial	
  Leverage	
   2,98	
   3,23	
  	
  	
   1,45	
   1,52	
  	
  	
   2,04	
   2,05	
  
ROE	
  (%)	
   20,1%	
   34,1%	
  	
  	
   26,3%	
   21,2%	
  	
  	
   12,7%	
   12,6%	
  
10.09.15	
   LMVH	
  Financial	
  Analysis	
  –	
  Group	
  C	
  
Market Tests
•  Growth in dividend yield
•  Cheap P/E ratio compared to competition (Hermès
distribution bias)


   2013	
   2014	
   	
  	
   2013	
   2014	
   	
  	
   2013	
   2014	
  
Market	
  tests	


Price	
  /earnings	
  rao	
   19,7	
   12,0	
   	
  	
   28,9	
   55,0	
   	
  	
   17,0	
   16,6	
  
Dividend	
  yield	
  rao	
   2,5%	
   2,9%	
   	
  	
   1,3%	
   1,1%	
   	
  	
   2,2%	
   2,4%	
  
10.09.15	
   LMVH	
  Financial	
  Analysis	
  –	
  Group	
  C	
  
Conclusion
•  Strong liquidity & solvency
•  Clear effect on FS of M&A activity
•  Highly profitable business
•  Impressive numbers for a steadily growing luxury
conglomerate of that size
10.09.15	
   LMVH	
  Financial	
  Analysis	
  –	
  Group	
  C	
  

Financial Analysis LVMH 2013 & 2014

  • 1.
    LVMH MOËT HENNESY LOUISVUITTON FINANCIAL ANALYSIS by GROUP C – Master in Management 2015
  • 2.
    Company Profile •  Frenchluxury conglomerate •  Founded in Paris in 1987 •  Merger between Moët Hennessy & Louis Vuitton •  3708 stores worldwide 10.09.15   LMVH  Financial  Analysis  –  Group  C  
  • 3.
    •  Highly dependenton consumer preferences & short-living fashion trends •  Difficulty to establish long-term brand loyalty •  Relatively unaffected by macroeconomic trends •  Group of „portfolio companies“ dominating the market:   Industry Overview 10.09.15   LMVH  Financial  Analysis  –  Group  C  
  • 4.
    Corporate Strategy •  Conglomerateof luxury companies •  Diverse brand portfolio through M&A activity •  Mother company set values for different companies but leave autonomy to fashion designers •  Owning stores (prime CRE) & land (Champagne) 10.09.15   LMVH  Financial  Analysis  –  Group  C  
  • 5.
    •  1984 acquiredand became CEO of Christian Dior •  1987 helped mediate a conflict at LVMH •  1988 gained control at LVMH as a large stakeholder preventing dismantlement •  90‘s - present: Made LVMH what it is today through long list of acquisitions   10.09.15   LMVH  Financial  Analysis  –  Group  C   Le Chef – Bernard Arnault
  • 6.
    10.09.15   LMVH  Financial  Analysis  –  Group  C   Corporate Structure
  • 7.
    Complex Holding Structure 10.09.15   LMVH  Financial  Analysis  –  Group  C  
  • 8.
    Geographical Presence 10.09.15  LMVH  Financial  Analysis  –  Group  C  
  • 9.
    Wines & Spirits 10.09.15   LMVH  Financial  Analysis  –  Group  C   Revenues and Investments of LVMH in 2014
  • 10.
    Fashion & LeatherGoods 10.09.15   LMVH  Financial  Analysis  –  Group  C   Revenues and Investments of LVMH in 2014
  • 11.
    Perfumes & Cosmetics 10.09.15   LMVH  Financial  Analysis  –  Group  C   Revenues and Investments of LVMH in 2014
  • 12.
    Watches & Jewelry 10.09.15   LMVH  Financial  Analysis  –  Group  C   Revenues and Investments of LVMH in 2014
  • 13.
    Selective Retailing &Other Activities 10.09.15   LMVH  Financial  Analysis  –  Group  C   Revenues and Investments of LVMH in 2014
  • 14.
    Assets Consolidated  Balance  Sheet                           (EUR  millions,  except  for  earnings  per  share)                                                       ASSETS   2012     %  of  TA  2013     %  of  TA  2014     %  of  TA   (EUR  millions)                           Brands  and  other  intangible  fixed  assets   11.322     23%   12.596     22%   13.031     24%   Goodwill   7.709     15%   9.058     16%   8.810     17%   Property,  plant  and  equipment   8.694     17%   9.621     17%   10.387     19%   Investments  in  joint  ventures  and  associates   483     1%   480     1%   519     1%   Non-­‐current  available  for  sale  financial  assets   6.004     12%   7.080     13%   580     1%   Other  non-­‐current  assets   519     1%   457     1%   489     1%   Deferred  tax   952     2%   913     2%   1.436     3%   Non-­‐current  assets   35.683     72%   40.205     72%   35.252     66%                               Inventories  andwork  in  progress   7.994     16%   8.492     15%   9.475     18%   Trade  accounts  receivable   1.972     4%   2.174     4%   2.274     4%   Income  taxes   201     0%   223     0%   354     1%   Other  current  assets   1.813     4%   1.856     3%   1.916     4%   Cash  and  cash  equivalents   2.187     4%   3.226     6%   4.091     8%   Current  assets   14.167     28%   15.971     28%   18.110     34%                               Total  assets   49.850         56.176         53.362         10.09.15   LMVH  Financial  Analysis  –  Group  C  
  • 15.
    Liabilities LIABILITIES  AND  EQUITY   2012     %  of  TA  2013     %  of  TA  2014     %  of  TA   (EUR  millions)                           Share  capital    152         0%    152         0%    152         0%   Share  premium  account    3.848         5%    3.849         7%    2.655         8%   Treasury  shares  and  LVMH-­‐share  se[led  derivaves   -­‐414         -­‐1%   -­‐451         -­‐1%   -­‐374         -­‐1%   Cumulave  translaon  adjustment    342         1%   -­‐8         0%    492         1%   Revaluaon  reserves    2.731         2%    3.900         7%    1.019         5%   Other  reserves    14.340         23%    16.001         28%    12.171         29%   Net  profit,  Group  share    3.425         11%    3.436         6%    5.648         7%   Equity,  Group  share    24.424         41%    26.879         48%    21.763         49%   Minority  interests    1.084         2%    1.028         2%    1.240         2%   Total  equity    25.508         43%    27.907         50%    23.003         51%                               Long-­‐term  borrowings    3.825         9%    4.149         7%    5.054         8%   Non-­‐current  provisions    1.772         4%    1.797         3%    2.291         4%   Deferred  tax    3.884         8%    4.280         8%    4.392         8%   Other  non-­‐current  liabilies    5.456         12%    6.404         11%    6.447         11%   Non-­‐current  liabiliVes    14.937         34%    16.630         30%    18.184         30%                               Short-­‐term  borrowings    2.950         8%    4.674         8%    4.189         6%   Trade  accounts  payable    3.118         7%    3.297         6%    3.606         6%   Income  taxes    442         1%    357         1%    549         1%   Current  provisions    335         1%    324         1%    332         1%   Other  current  liabilies    2.560         7%    2.987         5%    3.499         5%   Current  liabiliVes    9.405         23%    11.639         21%    12.175         19%                               Total  liabiliVes  and  equity    49.850              56.176              53.362             10.09.15   LMVH  Financial  Analysis  –  Group  C  
  • 16.
    Income Statement Consolidated  Income  Statement                               (EUR  millions,  except  for  earnings  per  share)   2012         2013         2014         CAGR  in  %                                   Revenue    27.970        100%    29.016        100%    30.638        100%   3%   Cost  of  sales    9.863         35%    9.997         34%    10.801         35%   3%   Gross  margin    18.107         65%    19.019         66%    19.837         65%   3%                                   Markeng  and  selling  expenses    10.013         36%    10.767         37%    11.744         38%   5%   General  and  administrave  expenses    2.151         8%    2.212         8%    2.373         8%   3%   Income  (loss)  from  joint  ventures  and  associates   -­‐19         0%   -­‐23         0%   -­‐5         0%   -­‐36%   Profit  from  recurring  operaVons    5.924         21%    6.017         21%    5.715         19%   -­‐1%                                   Other  operang  income  and  expenses    182         1%    119         0%    284         1%   16%   OperaVng  profit    5.742         21%    5.898         20%    5.431         18%   -­‐2%                                   Cost  of  net  financial  debt    138         0%    101         0%    115         0%   -­‐6%   Other  financial  income  and  expenses    126         0%   -­‐97         0%    3.062         10%   190%   Net  financial  income  (expense)   -­‐12         0%   -­‐198         -­‐1%    2.947         10%   -­‐726%                                   Income  taxes    1.821         7%    1.753         6%    2.273         7%   8%   Net  profit  before  minority  interests    3.909         14%    3.947         14%    6.105         20%   16%                                   Minority  interests    484         2%    511         2%    457         1%   -­‐2%   Net  profit,  Group  share    3.425         12%    3.436         12%    5.648         18%   18%   10.09.15   LMVH  Financial  Analysis  –  Group  C  
  • 17.
    Cash Flow Statementl Consolidated  Cash  Flow  Statement                       in  m€                           2012         2013         2014     OPERATING  ACTIVITIES  AND  OPERATING  INVESTMENTS                       Operang  profit    5.742              5.898              5.431         Income/(loss)  and  dividends  from  joint  ventures  and  associates    37              49              26         Net  increase  in  depreciaon,  amorzaon  and  provisions    1.289              1.435              1.895         Other  computed  expenses   -­‐59             -­‐29             -­‐188         Other  adjustments   -­‐52             -­‐76             -­‐84         Cashfrom  operaVons  before  changes  in  working  capital    6.957              7.277              7.080         Cost  of  net  financial  debt:  interest  paid   -­‐152             -­‐111             -­‐116         Income  taxes  paid   -­‐1.880             -­‐1.832             -­‐1.639         Net  cash  from  operaVng  acVviVes  before  changes  in  working   capital    4.925              5.334              5.325         Change  in  working  capital   -­‐810             -­‐620             -­‐718         Net  cash  from  operaVng  acVviVes    4.115              4.714              4.607         Operang  investments   -­‐1.694             -­‐1.657             -­‐1.775         Net  cash  from  operaVng  acVviVes  and  operaVng   investments(free  cash  flow)    2.421              3.057              2.832                                 10.09.15   LMVH  Financial  Analysis  –  Group  C  
  • 18.
    Cash Flow Statementll FINANCIAL  INVESTMENTS    2012        2013        2014   Purchase  of  non-­‐current  available  for  sale  financial  assets   -­‐131             -­‐197             -­‐57         Proceeds  from  sale  of  non-­‐current  available  for  sale  financial   assets    36              38              160         Dividends  received    179              71              69         Income  tax  related  to  financial  investments   -­‐21             -­‐11             -­‐237         Impact  of  purchase  and  sale  of  consolidated  investments   -­‐59             -­‐2.161             -­‐167         Net  cash  from  (used  in)  financial  investments    4             -­‐2.260             -­‐232                                 TRANSACTIONS  RELARING  TO  EQUITY                       Capital  increases  of  LVMH  SE    95              66              59         Capital  increases  of  subsidiaries  subscribed  by  minority   interests    8              7              3         Acquision  and  disposals  of  treasury  shares  and  LVMH-­‐share   se[led  derivaves    5             -­‐113              1         Interim  and  final  dividends  paid  by  LVMH  SE   -­‐1.447             -­‐1.501             -­‐1.619         Income  taxes  paid  related  to  interim  and  final  dividends  paid   -­‐73             -­‐137             -­‐79         Interim  and  final  dividends  paid  to  minority  interests  in   consolidated  subsidiaries   -­‐314             -­‐220             -­‐336         Purchase  and  proceeds  from  sale  of  minority  interests   -­‐206             -­‐150              10         Net  cash  from  (used  in)  transacVons  relaVng  to  equity   -­‐1.932             -­‐2.048             -­‐1.961                                 Change  in  cash  before  financing  acVviVes    493             -­‐1.251              639         10.09.15   LMVH  Financial  Analysis  –  Group  C  
  • 19.
    Cash Flow Statementlll FINANCING  ACTIVITIES                       2012   2013   2014   Proceeds  from  borrowings    1.028              3.095              2.407         Repayment  of  borrowings   -­‐1.494             -­‐1.057             -­‐2.100         Purchase  and  proceeds  from  sale  of  current  available  for  sale   financial  assets   -­‐67              101             -­‐106         Net  cash  from  (used  in)  financing  acVviVes   -­‐533              2.139              201                                 EFFECT  OF  EXCHANGE  RATE  CHANGES   -­‐43              47              27                                 NET  INCREASE(DECREASE)  INCASH  AND  CASH  EQUIVALENTS   (I+II+III+IV+V)   -­‐83              935              867         CASH  AND  CASH  EQUIVALENTS  AT  BEGINNINGOF  PERIOD    2.064              1.981              2.916         CASH  AND  CASH  EQUIVALENTS  AT  END  OF  PERIOD    1.981              2.916              3.783         TOTAL  INCOME  TAXES  PAID   -­‐1.974             -­‐1.980             -­‐1.955         10.09.15   LMVH  Financial  Analysis  –  Group  C  
  • 20.
    Liquidity    2013   2014       2013   2014       2013   2014   Test  of  liquidity                                                                       Current  rao   1,37   1,49       2,07   1,70       1,08   0,91   Receivables  turnover  rao   14,0   13,8       11,6   10,9       10,2   10,1   Inventory  turnover  rao   3,5   3,4       8,0   6,4       5,3   5,0   •  Robust liquidity figures from LVMH •  Especially efficient receivables turnover ratio •  Biased by Wine & Spirits division 10.09.15   LMVH  Financial  Analysis  –  Group  C  
  • 21.
    Solvency •  Robust solvencyfigures from LVMH •  Operating cash flow covers interest expense better than competitors •  Debt-to-equity higher than competitors (due to high M&A activity)     2013   2014       2013   2014       2013   2014   Test  of  Solvency                                                                       Times  interest  earned   13,2   24,4       12,7   5,3       8,9   7,5   Cash  coverage  rao   20,5   15,2       8,4   3,6       8,5   5,8   Debt-­‐to-­‐equity  rao   1,01   1,32       0,44   0,57       0,96   1,06   10.09.15   LMVH  Financial  Analysis  –  Group  C  
  • 22.
    Fixed Asset Analysis • Efficient use of fixed asset by LVMH •  Good Depreciation/CAPEX ratio compared to Prada •  Average remaining life of fixed assets is similar     2013   2014       2013   2014       2013   2014   Fixed  asset  analysis:                                                                       Fixed  asset  turnover   3,2   3,1       2,9   2,6       5,8   5,6   Depreciaon  /  Capex   54,9%   60,9%       281,7%   213,0%       25,0%   38,7%   Years  to  depreciate  exisng  net  fixed   assets   8,6  years   7,8  years       6,4  years  6,1  years       8,7  years   7,8  years   10.09.15   LMVH  Financial  Analysis  –  Group  C  
  • 23.
    Operating Ratios •  Slightdecrease due to higher marketing expense •  Similar EBIT margin with competitors     2013   2014       2013   2014       2013   2014   OperaVng  raVos:                                   EBITDA  margin   20,7%   18,7%       26,2%   19,8%       13,6%   15,5%   EBIT  margin   16,5%   13,4%       20,8%   13,0%       11,6%   13,1%   10.09.15   LMVH  Financial  Analysis  –  Group  C  
  • 24.
    ROA Analysis •  ROAanalysis is complicated for LVMH due to bias from Hermès share distribution •  ROA seems to be constant over time leaving out Hermès effect •  Bias by high value of CRE & brands in assets •  Prada seems to have the most effective ROA (possible divestment)     2013   2014       2013   2014       2013   2014   ROA  analysis  (EBI/Total  Assets)                                                  EBI  margin   12,3%   18,9%       19,7%   17,0%       14,7%   14,0%                  Turnover  rao  (over  total  assets)   0,55   0,56       0,92   0,82       0,42   0,44   ROA  (%)   6,7%   10,6%       18,2%   14,0%       6,2%   6,1%   10.09.15   LMVH  Financial  Analysis  –  Group  C  
  • 25.
    ROE Analysis •  ROEanalysis is complicated for LVMH due to bias from Hermès share distribution •  ROE seems to be constant over time leaving out Hermès effect •  Higher financial leverage due to high M&A activity financed by LT borrowing (low interest environment)     2013   2014       2013   2014       2013   2014   Decomposing  ROE                                                  EBI  margin   12,3%   18,9%       19,7%   17,0%       14,7%   14,0%                  Turnover  rao  (over  total  assets)   0,55   0,56       0,92   0,82       0,42   0,44                    Financial  Leverage   2,98   3,23       1,45   1,52       2,04   2,05   ROE  (%)   20,1%   34,1%       26,3%   21,2%       12,7%   12,6%   10.09.15   LMVH  Financial  Analysis  –  Group  C  
  • 26.
    Market Tests •  Growthin dividend yield •  Cheap P/E ratio compared to competition (Hermès distribution bias)       2013   2014       2013   2014       2013   2014   Market  tests                                                                       Price  /earnings  rao   19,7   12,0       28,9   55,0       17,0   16,6   Dividend  yield  rao   2,5%   2,9%       1,3%   1,1%       2,2%   2,4%   10.09.15   LMVH  Financial  Analysis  –  Group  C  
  • 27.
    Conclusion •  Strong liquidity& solvency •  Clear effect on FS of M&A activity •  Highly profitable business •  Impressive numbers for a steadily growing luxury conglomerate of that size 10.09.15   LMVH  Financial  Analysis  –  Group  C