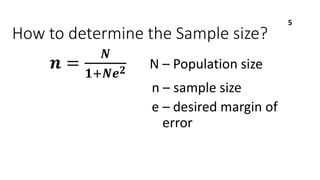
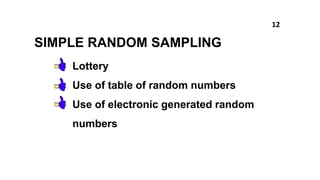
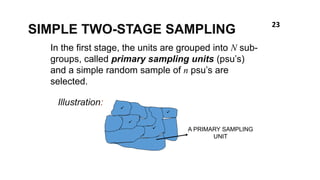
4. WHY DO WE USE SAMPLES?
1. Reduced Cost
2. Greater Speed or Timeliness
3. Greater Efficiency and Accuracy
4. Greater Scope
5. Convenience
6. Necessity
7. Ethical Considerations
4
5. How to determine the Sample size?
𝒏 =
𝑵
𝟏+𝑵𝒆𝟐 N – Population size
n – sample size
e – desired margin of
error
5
6. Computation of the Sample size
Given: Given:
N – 1000 N - 1000
e – 5% or 0.05 e – 1% or 0.01
n =
𝑁
1+𝑁𝑒2 =
1000
1+1000(0.05)2 n =
𝑁
1+𝑁𝑒2 =
1000
1+1000(0.01)2
n = 285.71 n = 909.09
n = 286 n = 910
6
7. TWO TYPES OF SAMPLES
1.Probability sample
2. Non-probability sample
7
8. Samples are obtained using some
objective chance mechanism, thus
involving randomization.
They require the use of a complete
listing of the elements of the
universe called the sampling
frame.
PROBABILITY SAMPLES
8
9. The probabilities of selection are
known.
They are generally referred to as
random samples.
They allow drawing of valid
generalizations about the
universe/population.
PROBABILITY SAMPLES
9
10. BASIC SAMPLING TECHNIQUES
Simple Random Sampling
Systematic Random Sampling
Stratified Random Sampling
Cluster Sampling
Multistage Sampling
10
11. SIMPLE RANDOM SAMPLING
Most basic method of drawing a
probability sample
Assigns equal probabilities of
selection to each possible sample
Results to a simple random sample
11
13. Simple Random Sampling
List of Respondents
1 Ann
2 Bea
3 Mark
4 Peter
5 James
6 Queen
7 John
8 David
9 Kaye
… …
1000 Arthur
Population size (N) = 1000
Margin of error (e) = 5%
n = 286
: Select only 286 from the list
of 1000 respondents.
: The selection process is done
by picking at random or lottery
13
14. STRATIFIED RANDOM SAMPLING
The universe is divided into L
mutually exclusive sub-universes
called strata.
Independent simple random
samples are obtained from each
stratum.
14
16. Stratified Random Sampling- Example
Strata Population Size Computations Computed sample size Sample size
A 200 (200/1000) x 286 57.2 58
B 300 (300/1000) x 286 85.8 86
C 400 (400/1000) x 286 114.4 115
D 100 (100/1000) x 286 28.6 29
Total population 1000 Total sample size 288
16
17. Advantages of Stratification
1. It gives a better cross-section of the population.
2. It simplifies the administration of the survey/data
gathering.
3. The nature of the population dictates some inherent
stratification.
4. It allows one to draw inferences for various subdivisions
of the population.
5. Generally, it increases the precision of the estimates.
17
18. SYSTEMATIC SAMPLING
Adopts a skipping pattern in the selection
of sample units
Gives a better cross-section if the listing is
linear in trend but has high risk of bias if
there is periodicity in the listing of units in
the sampling frame
Allows the simultaneous listing and
selection of samples in one operation
18
20. Systematic Sampling - Example
Computation of k
k =
𝑵
𝒏
=
𝟏𝟎𝟎𝟎
𝟐𝟖𝟔
= 3.49 or 3
• The first number will be picked at
random
• The next number will follow a computed
systematic pattern ( k )
Example
• First number is 756
• The next number is 756 + 3= 759
• The next number is 759 + 3 = 762
List of respondents for the Sample
1-756, 2-759,3-762,4- 765, … ,286-
20
21. CLUSTER SAMPLING
It considers a universe divided into N
mutually exclusive sub-groups called
clusters.
A random sample of n clusters is selected
and their elements are completely
enumerated.
It has simpler frame requirements.
It is administratively convenient to
implement.
21
23. SIMPLE TWO-STAGE SAMPLING
In the first stage, the units are grouped into N sub-
groups, called primary sampling units (psu’s)
and a simple random sample of n psu’s are
selected.
Illustration:
A PRIMARY SAMPLING
UNIT
23
24. SIMPLE TWO-STAGE SAMPLING
In the second stage, from each of the n psu’s
selected with Mi elements, simple random sample
of mi units, called secondary sampling units
ssu’s, will be obtained.
Illustration:
A SECONDARY
SAMPLING UNIT
SAMPLE
24
25. Samples are obtained
haphazardly, selected purposively
or are taken as volunteers.
The probabilities of selection are
unknown.
NON-PROBABILITY SAMPLES
25
26. Non-Random / Non-Probability Sampling
•Purposive Sampling:
Example: Mr. Chan wants to know the reaction of students regarding their school uniform.
Instead of interviewing majority of the students he just interviewed the students
in the dean’s list.
•Quota Sampling:
Example: Suppose in determining taxpayer’s attitude towards increased monthly pension for
retired persons, an interviewer might be told to interview (10- male/ self-employed/
homeowner/ 35 years of age), ( 15-female/ wage earners in the 45-50 age bracket who
lived in rented house), (5-public school teacher), and so on.
•Convenience Sampling:
Example: Internet Polls, Telephone survey
26
27. They should not be used for
statistical inference.
They result from the use of
judgment sampling, accidental
sampling, purposively sampling,
and the like.
NON-PROBABILITY SAMPLES
27
28. Methods of Collecting Data
Observation Method
Interview Method
Use of Existing Records
28
Questionnaire Method
Experimental Method