FOOD AID INSTRUMENTS: WFP PROCUREMENTS
•
1 like•808 views

Presentation about WFP procurements and fight with hunger for the"Right to Food" class, LL.M. in Agricultural and Food Law.

Recommended
More Related Content
What's hot
What's hot (20)
Viewers also liked
Viewers also liked (15)
Similar to FOOD AID INSTRUMENTS: WFP PROCUREMENTS
Similar to FOOD AID INSTRUMENTS: WFP PROCUREMENTS (20)
More from Mark Opanasiuk
More from Mark Opanasiuk (9)
Recently uploaded
Recently uploaded (20)
FOOD AID INSTRUMENTS: WFP PROCUREMENTS
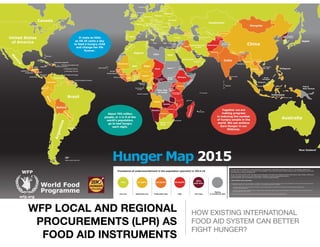
- 1. WFP LOCAL AND REGIONAL PROCUREMENTS (LPR) AS FOOD AID INSTRUMENTS HOW EXISTING INTERNATIONAL FOOD AID SYSTEM CAN BETTER FIGHT HUNGER? South Sudan Libya It costs as little as US 25 cents a day to feed a hungry child and change her life forever. About 795 million people, or 1 in 9 of the world’s population, go to bed hungry each night. Together we are making progress in reducing the number of hungry people in the world. We can achieve Zero Hunger in our lifetimes. *** Prevalence of undernourishment in the population (percent) in 2014-16 Very low <5% Moderately low 5-14,9% Moderately high 15-24,9% High 25-34,9% Very high 35% and over Missing or insufficient data *** State of Palestine The map shows the prevalence of undernourishment in the population of developing countries as of 2014-16. The indicator measures the probability that a randomly selected individual in the population is consuming an amount of dietary energy, which is insufficient to cover her/his requirements for an active and healthy life. Source: FAO, IFAD and WFP. 2015. The State of Food Insecurity in the World 2015. Meeting the 2015 international hunger targets: taking stock of uneven progress. Rome, FAO. Further information is available at www.fao.org/publications/sofi/en/ Undernourishment data: FAO Statistics Division (ESS) - www.fao.org/economic/ess © 2015 World Food Programme The designations employed and the presentation of material in this map does not imply the expression of any opinion whatsoever on the part of WFP concerning the legal or constitutional status of any country, territory or sea area, or concerning the delimitation of frontiers. * A dispute exists between the Governments of Argentina and the United Kingdom of Great Britain and Northern Ireland concerning sovereignty over the Falkland Islands (Malvinas). ** Dotted line represents approximately the Line of Control in Jammu and Kashmir agreed upon by India and Pakistan. The final status of Jammu and Kashmir has not yet been agreed upon by the parties. *** Final boundary between the Republic of South Sudan and the Republic of Sudan has not yet been determined. Brunei Darussalam Comoros Seychelles Hunger Map 2015
- 2. FAO: 2015 Global Food Supply is enough to provide: 2800 calories and 76g proteins per day for every person BUT there are still 795 millions hungry people in the world 98% of hungry people are in developing countries Global Food Aid: 2015 it is a voluntarily commitment of states distributed annually around 5-5.5m metric tons of food annually reaches around 200 millions people in more than 80 countries 50 kg per reached person per year OR only 12 kg per year for all hungry people
- 3. MAJOR TYPES OF FOOD AID Program Food Aid Project Food Aid Emergency Food Aid Distribution ways: 1) directly between states under bilateral and multinational agreements (FAC) 2) through special NGOs and the UN Agencies Forms of Food Aid: 1) in-kind-food aid 2) cash based food aid (direct cash transfers, local and regional procurement, food vouchers) Food Aid Deliveries by Categories 0% 20% 40% 60% 80% 100% 1991 2002 2012 68% 57% 17% 28% 25%25% 4% 19% 58% Program Food Aid Project Food Aid Emergency Food Aid *Food Aid Flows Report. WFP 2012
- 4. Provided Food Aid is slightly more 5.0m metric tons WFP is responsible for 58% of all food aid (WFP 2013: $4,38b = 3,1m tons) Food Aid by Category (millions tons) 3.4 1.4 0.2 Program aid Project aid Emergency aid Food Aid by Channel (millions tons) 1.5 0.5 3.0 Multilateral Bilateral NGOs
- 5. SIGNIFICANT GROWTH OF CASH CONTRIBUTIONS 1) the UN, including WFP and humanitarian partners, appealed for $18.04 billion but received only $10.78 billion in 2014. 2014: WFP Contributions ($5.6 billions) 4.1 1.5 in-kind cash *the highest record, but only 66% from requested 2) WFP budget is 10x larger than IFAD and FAO budgets 3) Total assistance for agriculture and rural development has been cut by half in the past two decades: $5.14b — $2.2b (FAO, 2005)
- 6. WFP top donors Chart represents in-kind food and cash contributions received under different programs
- 7. *Food Aid Flows Report. WFP 2012 The total amount of food aid deliveries significantly decreased in past decades (from 18m tons in 1980th to 5m tons todays). But, on the other hand, annual number of food emergencies have doubled - from 15 per year in 1980th to 30 per year nowadays (in Africa the numbers even tripled). *FAO, 2004a
- 8. International Food Aid is the important instrument in progressive realization of right to food and fight with global hunger (FAO: Voluntarily Guidelines) Food Aid: Should be provided in ways which do not adversely affect local producers and local markets Should be organized in ways that facilitate the return to food self- reliance of the beneficiaries Should be based on assessed needs of the intended beneficiaries Should be safe and culturally acceptable to recipients *General Comment No.12 Food aid can support food security in emergencies and in cases of chronic hunger if it is properly managed
- 9. POSSIBLE MISUSES OF FOOD AID Food aid can be used to dispose surpluses (now it is rare because there is enough demand on food markets; hidden export = violation of WTO rules) Food aid may create dependency on food aid / food import, and it may be used to capture new markets (sometimes it is directly stated in donors’ laws) In-kind food aid can destroy or damage local markets that poor farmers depend on and undermines recovery (instead of support local producers food aid compete with them) It may be cost ineffective and be late (delivery delays could be more than few months and too much is spent on shipping from donors country) To summarize: Food Aid may cause harm if it arrives or is purchased at the wrong time; if it is not well targeted; if the local markets are poorly integrated with broader markets.
- 10. INDONESIA, 2001 “I harvest my rice usually two times per year. Last year I sold my rice at Rp 2,600–Rp 2,700 [approx. $0.25] per kg. This year, its price was only Rp 1,500–1,700 [$0.15] per kg due to the flooding of rice from the social safety net program to the local market.... Some people said that rice came from the US…” Wagino, 42, farmer and father of four children, Boyolali Regency, Central Java Province, Indonesia, 2001 “Meaningful and immediate increases in food aid now could mean the difference between survival and financial disaster for rice mills in this region…” Thomas Ferrara of Greenville, Mississippi, USA, Chairman of the Rice Millers’ Association, 2001
- 11. MALAWI, 2002-2003 Food donors overreacted to projected 600k tons food deficit in Malawi, causing severe decline of food prices and hurting local producers (maize prices dropped from $250 to $100 per tonne, local production on cereals fell significantly, estimated loses to economy $15m) Guyanese rice export to Jamaica was displaced by US food aid, which doubled after a bumper crop in the USA. Guyana is developing country and lost source of foreign currency income. GUYANA and JAMAICA, 2000th
- 12. SOMALI, 2011 3,2m Somalis - half of population needed food after drought and war, food aid flooded the capital with little or no control. Up to half of all food aid was stolen and sold by some businessmen. After tsunami 2m of people were in emergency, despise the availability of local food on the markets the donors - developed countries send in-kind-food aid to these countries. $92m from total $210m relief budget was spent on shipping and storage of food. Delay deliveries resulted in competition of food aid with local food on markets. INDONESIA and SRI LANKA, 2004
- 13. The USA provides around 50% of all food aid with $2,5b annual budget spendings
- 14. Targeted reforms to U.S. food aid programs could reach up to 17.1m additional hungry people at no additional cost to taxpayers. The 2014 Farm Bill established LRP program with authorized funding levels of only $80m annually for FY2014 through FY2018 (around 3% of all spendings). Many other donors still prefer direct transfers: Brazil and China used them for 100% of their deliveries and the USA — for 94%.
- 15. Donors should avoid falling into “relief trap”, when many resources are devoted to emergencies and longer-term needs are neglected Emergency food aid is essential to fight hunger, but it cannot overcome the underlying social and economic causes of poverty and hunger LOCAL AND REGIONAL FOOD PROCUREMENTS FROM SMALL FARMERS IN DEVELOPING COUNTRIES TOGETHER WITH LOCAL FOOD RESILIENCE PROJECTS ARE EFFECTIVE INSTRUMENTS IN FIGHTING HUNGER
- 16. The mission of WFP is to end global hunger WFP strategic goals: Save lives and protect livelihoods in emergencies; Support or restore food security and nutrition and establish or rebuild livelihoods in fragile settings and following emergencies; Reduce risk and enable people, communities and countries to meet their own food and nutrition needs; Reduce undernutrition and break the intergenerational cycle of hunger. * WFP Strategic plan (2014-2017)
- 17. SHIFTS IN GLOBAL FOOD AID 1) LRP is cheaper (33% cheaper for region; and 46% - if buy locally)* 2) LRP, vouchers and direct cash transfers reduces aid delivery time (from 4-6 months to 1-2 months) 3) LRP and other cash aid bolsters local markets and support local agribusiness 4) LRP develops local infrastructure, improve food production in the region 5) LRP promote growing of food crops instead in developing countries in food insecure regions **http://publications.wf.org/en/apr/2013/ *Clay, E., B. Riley, I. Urey (2004) ‘The Development Effectiveness of Food Aid and the Effects of its Tying Status’, OECD Development Assistance Committee WFP cash aid programs growth — from $139m in 2010 to $1.37b in 2014. In 2013, WFP procured 2.1m tons of food valued at US$1.16b in 91 countries, 50% purchased by LRP (86% in developing countries). WFP increased number of projects on resilience building activities (land&infrastructure improvements, education etc.)**
- 18. WFP procurements the UN procurement system - Global Market (https://www.ungm.org/) Large companies dominate export trade in developing countries (Cargill and ADM controls 75% of world grain market). And small farmers in the poorest (most hungry) countries may not benefit from increased LRP because of bad infrastructure and UNGM contract and financial terms*. direct local procurements from small farmers P4P pilot program in 2008-2014 in 20 countries = generated $150m for farmers and WFP (400k tons of food in 5 years). Additionally farmers’ trainings and infrastructural improvements (local food resilience projects) were conducted. *Small-scale farmers in Mozambique also produced a surplus in 2005. Yet, they are unlikely to supply food to WFP because of higher costs due to the country’s poor road and infrastructure.
- 19. HOW FOOD AID CAN BE IMPROVED? Advocate to untie food aid from domestic procurement and shipping requirements and increase cash aid Food aid should not be linked to donor’s commercial transactions Food aid should be provided in cash for increased LRP and supporting projects In-kind food aid from donors - only in acute local/regional food shortage and/or non-functioning local food markets Monetization of food aid should be limited and replaced with cash donations, to avoid displacement of local production or imports All food aid transactions must be notified to the FAO and WTO *The State of Food and Agriculture. FAO 2005
- 20. – FAO. The State Of Food And Agriculture. Rome 2006 “In many cases, food aid is used because it is the only available resource, not because it is the best solution to the problem at hand. Increased and more flexible resources are needed to address food insecurity.” ” “Better to teach hungry persons how to fish, than give them fish every day.” ” – Very old folk saying