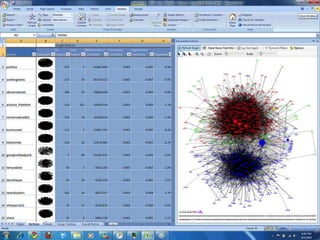
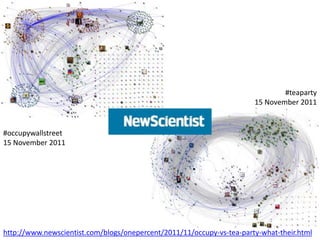
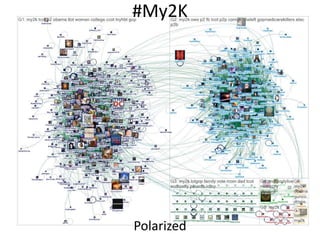
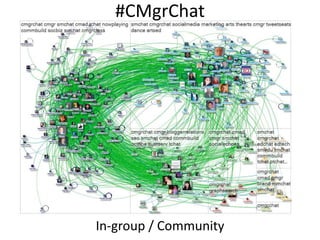
Downloaded 104 times


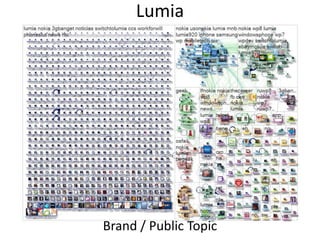
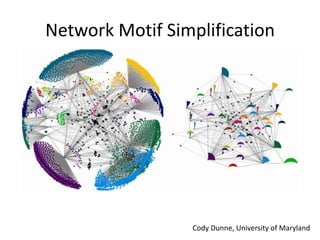
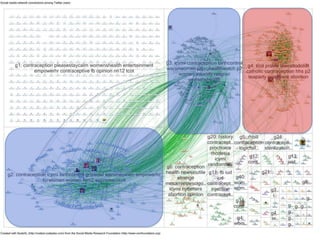
![[Divided]
Polarized Crowds
[Unified]
Tight Crowd
[Fragmented]
Brand Clusters
[Clustered]
Community Clusters
[In-Hub & Spoke]
Broadcast Network
[Out-Hub & Spoke]
Support Network
6 kinds of Twitter social media networks](https://image.slidesharecdn.com/2014-pawcon-smrf-nodexl-sna-social-20media-20networks-140325131620-phpapp02/85/Think-Link-Network-Insights-with-No-Programming-Skills-56-320.jpg)
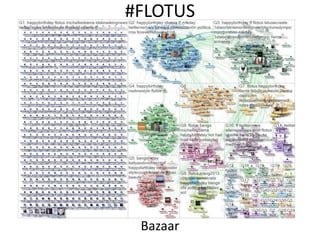
![[Divided]
Polarized Crowds
[Unified]
Tight Crowd
[Fragmented]
Brand Clusters
[Clustered]
Community Clusters
[In-Hub & Spoke]
Broadcast Network
[Out-Hub & Spoke]
Support Network
6 kinds of Twitter social media networks](https://image.slidesharecdn.com/2014-pawcon-smrf-nodexl-sna-social-20media-20networks-140325131620-phpapp02/85/Think-Link-Network-Insights-with-No-Programming-Skills-57-320.jpg)
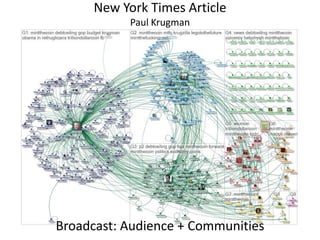
![[Divided]
Polarized Crowds
[Unified]
Tight Crowd
[Fragmented]
Brand Clusters
[Clustered]
Community Clusters
[In-Hub & Spoke]
Broadcast Network
[Out-Hub & Spoke]
Support Network
6 kinds of Twitter social media networks](https://image.slidesharecdn.com/2014-pawcon-smrf-nodexl-sna-social-20media-20networks-140325131620-phpapp02/85/Think-Link-Network-Insights-with-No-Programming-Skills-69-320.jpg)
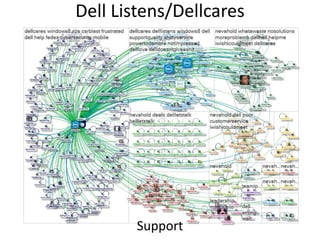
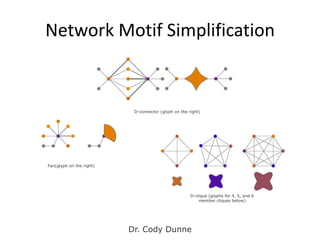
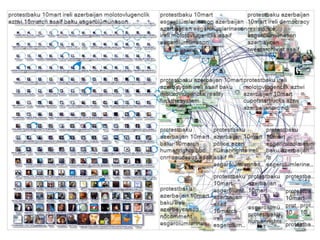
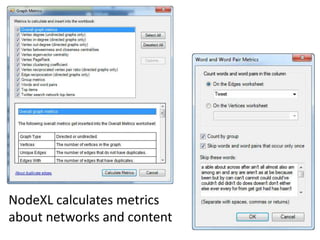
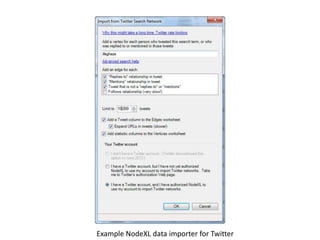
![[Divided]Polarize
d Crowds
[Unified]Tig
ht Crowd
[Fragmented]
Brand Clusters
[Clustered]
Communities
[In-Hub &
Spoke]Broadcast
Network
[Out-Hub &
Spoke]Support
Network
[Low probability]
Find bridge users.
Encourage shared
material.
[Low probability]
Get message out to
disconnected
communities.
[Possible transition]
Draw in new
participants.
[Possible transition]
Regularly create
content.
[Possible transition]
Reply to multiple
users.
[Undesirable
transition]
Remove bridges,
highlight divisions.
[Low probability]
Get message out to
disconnected
communities.
[High probability]
Draw in new
participants.
[Possible transition]
Regularly create
content.
[Possible transition]
Reply to multiple
users.
[Undesirable
transition]
Increase density of
connections in two
groups.
[Low probability]
Dramatically increase
density of
connections.
[High probability]
Increase
retention, build
connections.
[Possible transition]
Regularly create
content.
[Possible transition]
Reply to multiple
users.
[Undesirable
transition]
Increase density of
connections in two
groups.
[Low probability]
Dramatically increase
density of
connections.
[Undesirable
transition]
Increase population,
reduce connections.
[Possible transition]
Regularly create
content.
[Possible transition]
Reply to multiple
users.
[Undesirable
transition]
Increase density of
connections in two
groups.
[Low probability]
Dramatically increase
density of
connections.
[Low probability]
Get message out to
disconnected
communities.
[Possible transition]
Increase retention,
build connections.
[High probability]
Increase reply
rate, reply to multiple
users.
[Undesirable
transition]
Increase density of
connections in two
groups.
[Low probability]
Dramatically increase
density of
connections.
[Possible transition]
Get message out to
disconnected
communities.
[High probability]
Increase retention,
build connections.
[High probability]
Increase publication
of new content and
regularly create
content.](https://image.slidesharecdn.com/2014-pawcon-smrf-nodexl-sna-social-20media-20networks-140325131620-phpapp02/85/Think-Link-Network-Insights-with-No-Programming-Skills-71-320.jpg)
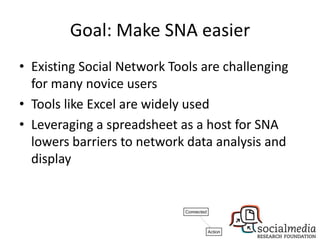
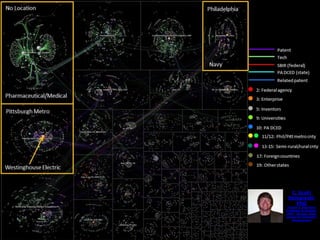
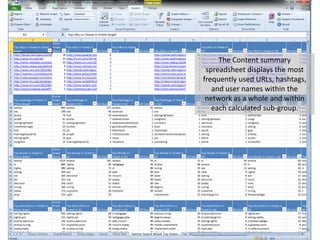

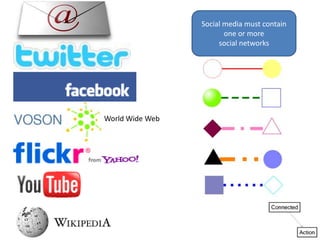
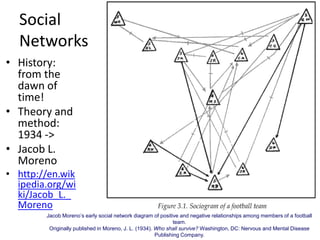
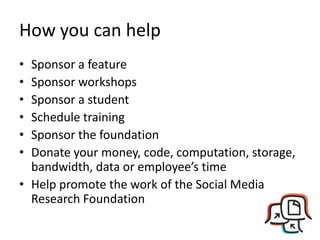
![What we want to do:
(Build the tools to) map the social web
• Move NodeXL to the web: (Node[NOT]XL)
– Node for Google Doc Spreadsheets?
– WebGL Canvas? D3.JS? Sigma.JS
• Connect to more data sources of interest:
– RDF, MediaWikis, Gmail, NYT, Citation Networks
• Solve hard network manipulation UI problems:
– Modal transform, Time series, Automated layouts
• Grow and maintain archives of social media network data sets for
research use.
• Improve network science education:
– Workshops on social media network analysis
– Live lectures and presentations
– Videos and training materials](https://image.slidesharecdn.com/2014-pawcon-smrf-nodexl-sna-social-20media-20networks-140325131620-phpapp02/85/Think-Link-Network-Insights-with-No-Programming-Skills-98-320.jpg)


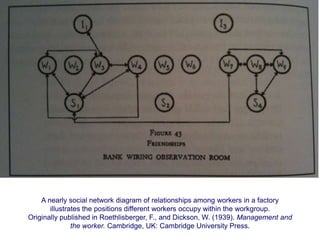
The document outlines a project by the Social Media Research Foundation led by Marc A. Smith, focusing on open tools and data for social media network analysis using NodeXL. It highlights past achievements such as the development of data collection tools, user-generated repositories, and academic publications while emphasizing the importance of social connections and network theory. The document also discusses the goals for further development and community engagement to enhance the understanding and visualization of social media relationships.


