SlideShare a Scribd company logo
1 of 25
MISO System-wide DA and RT LMPs
40.06
44.49
39.22
33.27
33.37
32.39
33.37
35.34
30.17
28.48
31.73
28.42
25.20
41.13
44.16
36.95
32.15
32.12
33.09
32.44
34.34
29.38
28.19
30.46
29.04
24.64
0
5
10
15
20
25
30
35
40
45
50
55
60
65
70
75
80
Apr-14May-14Jun-14 Jul-14 Aug-14Sep-14 Oct-14 Nov-14Dec-14Jan-15 Feb-15Mar-15 Apr-15
$/MWh
Day-Ahead and Real-Time Average Monthly System-Wide MISO
Prices
MISO DA MISO RT
Note: MISO System-Wide price is based on the monthly hourly average of the active hubs.
1
30.7%
30.1%
22.8%
14.0%
10.3%
12.3%
12.8%
14.0%
10.4%
11.1%
19.0%
17.9%
13.6%
0.0%
10.0%
20.0%
30.0%
40.0%
50.0%
60.0%
70.0%
Apr-14 May-14 Jun-14 Jul-14 Aug-14 Sep-14 Oct-14 Nov-14 Dec-14 Jan-15 Feb-15 Mar-15 Apr-15
PercentPriceDivergence*
DA/RT Price Deviation
Price Convergence: DA and RT LMP
12.30
13.41
8.94
4.65
3.44 4.00 4.27 4.93
3.13 3.17
6.03 5.08
3.42
-1.08
0.33 0.23 1.12 1.25
-0.70
0.93 1.00 0.78 0.29 1.27
-0.63
0.56
Apr-14 May-14 Jun-14 Jul-14 Aug-14 Sep-14 Oct-14 Nov-14 Dec-14 Jan-15 Feb-15 Mar-15 Apr-15
$/MWh
Average Absolute (DA-RT) difference Average (DA-RT) difference
* Monthly deviation, expressed as a percent of average DA LMP, is calculated as the average of hourly absolute (DA-RT) price differences divided by the average of hourly
DA LMPs for the month.
Note: MISO System-Wide price is based on the monthly hourly average of the active trading hubs.
2
29.68
30.77
30.01
24.18
25.88
32.79
26.22
28.50
28.64
29.93
29.20
24.01
25.07
36.81
25.95
28.52
22.20
24.64
23.36
16.70
20.98
23.85
22.48
22.03
19.99
24.78
23.12
16.15
19.99
21.35
21.13
20.93
ILL IND MICH MINN ARK LOU TEX MISO
$/MWh
Peak/Off-Peak: March 2015
DA Peak RT Peak DA OffPeak RT OffPeak
MISO DA and RT Hub LMPs
3
ILL IND MICH MINN ARK LOU TEX MISO
DA Peak 1.55 1.54 0.31 -2.45 -1.55 3.70 -2.10 0.14
RT Peak 0.45 0.64 -0.36 -2.95 -2.18 8.03 -2.09 0.22
DA OffPeak 0.84 2.30 0.91 -3.35 0.03 1.75 0.56 0.43
RT OffPeak -0.79 3.07 1.42 -3.37 -0.16 0.14 0.06 0.05
Congestion Component
of LMP ($/MWh)
0
100
200
300
400
500
600
0
20
40
60
80
100
120
140
160
180
200
220
240
260
280
300
320
340
360
$/MWh
Number of Hours
Price Duration Curve – Peak Hours
Note: MISO System-Wide price is based on the hourly average of the active hubs.
4
Apr-2015 MISO Real-Time Price 196.48 2(0.57%) 2(0.57%) 344(97.73%) 0(0.00%)
Apr-2015 MISO Day-Ahead Price 39.44 0(0.00%) 0(0.00%) 352(100.00%) 0(0.00%)
Mar-2015 MISO Real-Time Price 476.20 2(0.57%) 3(0.85%) 328(93.18%) 0(0.00%)
Mar-2015 MISO Day-Ahead Price 78.11 0(0.00%) 0(0.00%) 340(96.59%) 0(0.00%)
Hours w ith
LMP< $0/MWh
Hours w ith
LMP> $150/MWh
Hours w ith
LMP> $100/MWh
Hours w ith
LMP< $50/MWh
Peak Hourly
LMP
Price Duration Curve – Off-Peak Hours
Source MISO Information Delivery and Market Analysis Department
Note: MISO System-Wide price is based on the hourly average of the active hubs.
5
0
10
20
30
40
50
60
70
80
90
100
0
20
40
60
80
100
120
140
160
180
200
220
240
260
280
300
320
340
360
380
400
420
$/MWh
Number of Hours
Apr-2015 MISO Real-Time Price 55.80 0(0.00%) 0(0.00%) 367(99.73%) 0(0.00%)
Apr-2015 MISO Day-Ahead Price 38.69 0(0.00%) 0(0.00%) 368(100.00%) 0(0.00%)
Mar-2015 MISO Real-Time Price 86.65 0(0.00%) 0(0.00%) 386(98.47%) 0(0.00%)
Mar-2015 MISO Day-Ahead Price 56.99 0(0.00%) 0(0.00%) 390(99.49%) 0(0.00%)
Peak Hourly
LMP
Hours w ith
LMP< $0/MWh
Hours w ith
LMP> $150/MWh
Hours w ith
LMP> $100/MWh
Hours w ith
LMP< $50/MWh
92.24
131.77
108.02
52.54 49.01
85.99 79.25 65.59
50.36 55.40
94.71
74.04
49.21
Apr-14 May-14 Jun-14 Jul-14 Aug-14 Sep-14 Oct-14 Nov-14 Dec-14 Jan-15 Feb-15 Mar-15 Apr-15
DA Congestion Collections
Normalized* Day-Ahead Market Congestion Collections
$/MWh
1.72
2.27
1.64
0.77 0.69
1.42 1.39
1.13
0.84 0.84
1.53
1.27
0.94
Apr-14 May-14 Jun-14 Jul-14 Aug-14 Sep-14 Oct-14 Nov-14 Dec-14 Jan-15 Feb-15 Mar-15 Apr-15
Day-Ahead Market Congestion Collections
$ in millions
Source: MISO Information Delivery and Market Analysis Department
* Normalized using Day-Ahead load
Date of Extraction: May 05, 2015.
6
4.74
4.61
4.66
4.15
3.92
3.96
3.87
4.49
3.65
3.09
4.48
4.62
4.60
4.59
4.08
3.86
3.94
3.80
4.02
3.43
2.99
2.88
2.87
2.58
3.01
2.58
Apr-14 May-14 Jun-14 Jul-14 Aug-14 Sep-14 Oct-14 Nov-14 Dec-14 Jan-15 Feb-15 Mar-15 Apr-15
Chicago Citygate Hub Henry Hub
1.98 1.95 1.94 1.88 1.86 1.85 1.89 1.90 1.90 1.92
1.78 1.71 1.72
0.74 0.74 0.73 0.71 0.67 0.65 0.66 0.66 0.66 0.66 0.66 0.66 0.66
Apr-14 May-14 Jun-14 Jul-14 Aug-14 Sep-14 Oct-14 Nov-14 Dec-14 Jan-15 Feb-15 Mar-15 Apr-15
Illinois Basin Powder River Basin
Nominal Fuel Prices
Gas ($/mmbtu)
Coal ($/mmbtu)
Chicago Citygate
Trading Hub and
Henry Trading Hub
Oil* ($/mmbtu)
Illinois Basin Heat
Content =
11,800 btu/lb,
Powder River Basin
Heat Content =
8,800 btu/lb
Distillate Fuel Oil
Heat Content =
5.825 mmbtu/bbl
Source: Publicly Available/Government Sources-EIA and ICE
22.82 22.69 22.73 22.36 21.95 21.32 20.09 19.68
16.59
14.58 15.92 14.50 14.83
Apr-14 May-14 Jun-14 Jul-14 Aug-14 Sep-14 Oct-14 Nov-14 Dec-14 Jan-15 Feb-15 Mar-15 Apr-15
https://www.theice.com/marketdata/reports/76
http://www.eia.doe.gov/cneaf/coal/page/coalnews/coalmar.html#spot; “SNL Energy”
http://www.eia.gov/emeu/steo/pub/cf_tables/steotables.cfm?tableNumber=8
* Monthly oil prices are estimates and subject to change upon finalization.
7
193.61
255.95
175.34
89.85
79.28
134.66
140.66
125.26
95.91
101.27
167.54
139.74
92.80
125.34
7.48
2.83
2.65
21.74
6.49
0.32
12.19
2.55
1.95
4.97
0.00
1.62
1.23
15.63
0
50
100
150
200
250
300
Apr
2014
May Jun Jul Aug Sep Oct Nov Dec Jan
2015
Feb Mar Apr YTD
Avg
$inMillions
Hourly and Monthly Funding for Credits Net FTR Shortfall
Source: MISO Market ECF Report
Date of Extraction: May 5, 2015. Values may change due to resettlement.
FTR Rolling 12-month percentage calculations can be found in the April 2015 FTRWG meeting materials.
FTR Monthly and Rolling 12-Month Funding
C
8
Apr-14 May-14 Jun-14 Jul-14 Aug-14 Sep-14 Oct-14 Nov-14 Dec-14 Jan-15 Feb-15 Mar-15 Apr-15
Monthly FTR Allocation% 89.9% 97.5% 99.8% 96.9% 96.8% 94.7% 90.0% 91.1% 97.4% 98.8% 99.0% 100.0% 94.9%
Rolling 12-month Allocation% 97.7% 98.2% 98.6% 98.4% 98.3% 97.9% 97.6% 97.5% 97.4% 96.1% 96.1% 96.1% 96.8%
Offered Capacity and RT Peak Load Obligation
Offered Capacity (Hourly Average per category)
MW
Source: MISO Information Delivery and Market Analysis Department
*Gas excludes CC and CT units.
**Other includes DRR as well as oil ,pet coke and waste units.
1Real-Time ICCP Load plus Real-Time Regulation Requirement plus Real-Time Spinning Requirement at the daily Peak hour
Average Net Scheduled
Interchange over all hours
Hydro
Nuclear
Gas*
CC
CT
Other**
1Real-Time peak
load obligation
Coal
Wind
9
0
10,000
20,000
30,000
40,000
50,000
60,000
70,000
80,000
90,000
100,000
110,000
120,000
130,000
140,000
150,000
160,000
4/1
4/2
4/3
4/4
4/5
4/6
4/7
4/8
4/9
4/10
4/11
4/12
4/13
4/14
4/15
4/16
4/17
4/18
4/19
4/20
4/21
4/22
4/23
4/24
4/25
4/26
4/27
4/28
4/29
4/30
Marginal Fuel – April 2015
Percentage of Time a Fuel is Marginal in the Real-Time Market
% of Time
Source: MISO Information Delivery and Market Analysis Department
42
85
30
0 0 0
66
46
82
48
0 2 1
55
44
83
39
0 1 0
61
0
20
40
60
80
100
120
CC Coal Gas^^ Nuclear Oil Hydro *Wind
Off-Peak On-Peak Total
Note: Binding transmission constraints can produce instances where more than one unit is marginal in the system. Consequently, more than one
fuel may be on the margin; and since each marginal unit is included in the analysis, the percentage may sum to more than 100%.
^^Gas excludes Combined Cycle units
10
Generation Outages and Derates
Source: MISO CROW Outage Scheduler
* Forced Outages include Emergency, Forced, and Urgent
* Planned Outages include Planned
*De-rates are based on limits observed in Real-Time and may reflect normal seasonal de-rates in addition to de-rates for maintenance
or other operating conditions.
Outages extracted on May 01, 2015
0
5,000
10,000
15,000
20,000
25,000
30,000
35,000
40,000
Apr-14 May-14 Jun-14 Jul-14 Aug-14 Sep-14 Oct-14 Nov-14 Dec-14 Jan-15 Feb-15 Mar-15 Apr-15
MW
Daily Average Generation Outages and Derates - Reliability Footprint
Forced* Planned* Derates*
Data includes both MISO market and reliability footprints. Outage data is “point in time” and
can change. The chart reflects the data as it resided in the system on the date of extraction.
11
0 0 0 0 0 0 0 0 0 0 0 0 00 0 0 0 0 0 0 0 0 0 0 0 00 0 0 0 0 0 0 0 0 0 0 0 0
Apr-14 May-14 Jun-14 Jul-14 Aug-14 Sep-14 Oct-14 Nov-14 Dec-14 Jan-15 Feb-15 Mar-15 Apr-15
Count
Alerts* Warnings* Events*
Minimum and Maximum Generation Notifications
0 0 0
1
0 0 0 0 0 0 0 0 00 0 0 0 0 0 0 0 0 0 0 0 00 0 0 0 0 0 0 0 0 0 0 0 0
Apr-14 May-14 Jun-14 Jul-14 Aug-14 Sep-14 Oct-14 Nov-14 Dec-14 Jan-15 Feb-15 Mar-15 Apr-15
Count
Alerts* Warnings* Events*
Minimum Generation Actions
Supply surplus situations during light load periods when on-line resources need to operate at Emergency Minimum levels or be decommitted as to not over
burden the interconnected system.
Maximum Generation Actions
System-wide or transmission contingency related capacity shortages that may jeopardize the reliable operation of all or part of the MISO system.
Source: MISO Real-Time Operations Department
* Alerts – forecasting specific emergency situations in a future time-frame
* Warnings – experiencing initial stages of an emergency situation and taking action
* Events – experiencing an emergency situation and taking action
12
100 96 98.33 98.9
Apr-15 Mar-15 2015 YTD Avg 2014 Avg
-4.2
251.5 256.6 286.2
-11.6
-3.5
-20.6
254.4
Apr-15 Mar-15 2015 YTD Avg 2014 Avg
Mean STD
45 49
36
29
Apr-15 Mar-15 2015 YTD Avg 2014 Avg
6
0
0
0
0
0
Level 3 & 4
Level 5
Level 6
Apr-15 Mar-15
2.5
4.0
1.0
0.0
1.0
2.0
Apr-15 Mar-15 2015 YTD Avg 2014 Avg
MISO External
Reliability — Other Metrics
Transmission Loading Relief (TLR) Events Area Control Error (ACE)
MW
Levels:
3 – curtailing non-firm
4 – curtailing non-firm and reconfiguring
5 – curtailing firm
6 – emergency
Manual Redispatches (Count)
23,518 MWh Non-Firm MWh Curtailed
0 MWh Firm MWh Curtailed
Source: MISO Real-Time Operations Department
April 2015 Unit Commitment Efficiency
Percentage of days with online generation held to target and sufficient to meet
demand and constraints
N
Contingency Reserve Sharing
# of ARS events
O
13
Generation Interconnect Queue – Overall
0
50
100
150
200
250
300
350
400
450
Apr
2013
May Jun Jul Aug Sep Oct Nov Dec Jan
2014
Feb Mar Apr May Jun Jul Aug Sep Oct Nov Dec Jan
2015
Feb Mar Apr
#ofRequests
0
5,000
10,000
15,000
20,000
25,000
30,000
SizeofQueue(MW)
Size of Queue (MW) Number of Requests
Generation Interconnect Queue – Overall Status
Source: MISO Transmission Planning Department
84
2
81
Requests
Wind Coal Other
14
Generator Suspension/Retirement – Overall
0
5
10
15
20
Apr
2013
May Jun Jul Aug Sep Oct Nov Dec Jan
2014
Feb Mar Apr May Jun Jul Aug Sep Oct Nov Dec Jan
2015
Feb Mar Apr
#ofRequests
0
500
1,000
1,500
2,000
2,500
3,000
3,500
SizeofQueue(MW)
Size of Queue (MW) Number of Requests
Generator Suspension/Retirement Requests – Overall
Source: MISO Transmission Planning Department
2
1
0
Requests in Study -
Current Month
Coal Gas Other
15
Regional DA and RT Average Hub LMP
Source: MISO Information Delivery and Market Analysis Department
16
29.68
30.77
30.01
24.18
25.88
32.79
26.22
28.64
29.93
29.20
24.01
25.07
36.81
25.95
22.20
24.64
23.36
16.70
20.98
23.85
22.48
19.99
24.78
23.12
16.15
19.99
21.35
21.13
ILL IND MICH MINN ARK LOU TEX
Central Region North Region South Region
Day-Ahead and Real-Time Average Monthly LMP for Hubs
Peak/Off-Peak : April 2015
DA_Peak RT_Peak DA_offPeak RT_offPeak
Source: MISO Information Delivery and Market Analysis Department
Regional & System-wide DA & RT LMP – MISO, PJM, SPP
Note: SPP price is the hourly average of LMPs at SPP’s Settlement Locations. Hourly LMP data provided by SPP.
21.70
25.20
30.35
22.00
24.64
29.81
SPP MISO PJM
$/MWh
Day-Ahead and Real-Time Average Monthly LMP for MISO, PJM and SPP:
April 2015
Day-Ahead Real-Time
26.12
23.38
27.64
24.77
27.12
22.47
27.30
24.75
SPP South Hub MISO Arkansas Hub MISO Indiana Hub PJM Chicago Hub
$/MWh
17
6.92
6.83
6.83
6.83
6.83
6.83
7.45
6.83
7.46
6.64
6.64
6.64
6.64
6.64
12.37
6.64
1.75
1.66
1.66
1.66
1.66
1.66
2.27
1.66
2.02
1.20
1.20
1.20
1.20
1.20
6.93
1.20
0.65
0.54
0.54
0.54
0.54
0.54
1.29
0.54
1.28
0.44
0.44
0.44
0.44
0.44
6.32
0.44
MISO Zone 1 Zone 2 Zone 3 Zone 4 Zone 5 Zone 6 Zone 7
Non-Zone Indiana Michigan Wisconsin Minnesota Louisiana Texas
$/MWh
Day-Ahead and Real-Time Monthly Average of Hourly
MCPs by Zones: April 2015
REG_DA_MCP REG_RT_MCP SPIN_DA_MCP SPIN_RT_MCP SUPP_DA_MCP SUPP_RT_MCP
Source: MISO Information Delivery and Market Analysis Department
Note: No reserve MCP separation across zones if no reserve zone constraints bind. The definition of the Reserve Zones is updated on a
quarterly basis, in conjunction with the update of the Network Model. See Zonal Regulation Map
Zonal DA and RT MCP
18
Average Load by Region
Central Region
(GW)
South Region
(GW)
North Region
(GW)
Source: MISO Information Delivery and Market Analysis Department
* Monthly data based on hourly ICCP load data.
36.57 37.93
43.12 42.36 44.35
39.51 37.18
40.40 41.28
43.61 45.07
39.37
35.83
Apr-14 May-14 Jun-14 Jul-14 Aug-14 Sep-14 Oct-14 Nov-14 Dec-14 Jan-15 Feb-15 Mar-15 Apr-15
15.27 15.05 16.68 17.20 17.70
15.70 15.43
17.22 17.47 17.91 18.39
16.04 14.84
Apr-14 May-14 Jun-14 Jul-14 Aug-14 Sep-14 Oct-14 Nov-14 Dec-14 Jan-15 Feb-15 Mar-15 Apr-15
16.81 18.15
21.48 21.88 22.75
20.96
17.69 17.86 17.88
19.51 19.48
16.88 16.68
Apr-14 May-14 Jun-14 Jul-14 Aug-14 Sep-14 Oct-14 Nov-14 Dec-14 Jan-15 Feb-15 Mar-15 Apr-15
Hourly Integrated Peak Load Hour: 04/09/2015 HE 14 Peak load: 79.00 GW
Central Region: 41.60GW North Region: 17.18GW South Region: 20.22GW
19
Source: MISO Information Delivery and Market Analysis Department
*Based on 5-minute unit level generation dispatch target
Dispatched Generation Fuel Mix by Region
20
67.6%
50.4%
15.3%
67.8%
49.0%
10.5%
13.7%
12.3%
26.4%
15.7%
9.9%
31.2%
14.7%
7.2%
53.9%
11.4%
7.1%
52.5%
3.3%
28.0%
3.7%
31.4%
4.3% 5.8%
0.0%
20.0%
40.0%
60.0%
80.0%
100.0%
120.0%
Central Region North Region South Region Central Region North Region South Region
Mar-2015 Apr-2015
Coal(%) Nuclear(%) Gas(%) Wind(%) Other(%)
Generation Outages by Region
Source: MISO CROW Outage Scheduler
* Forced Outages include Emergency, Forced, and Urgent
* Planned Outages include Planned
*De-rates are based on limits observed in Real-Time and may reflect normal seasonal de-rates in addition to de-rates for maintenance
or other operating conditions.
Outages extracted on May 01, 2015 Data includes both MISO market and reliability footprints. Outage data is “point in time” and
can change. The chart reflects the data as it resided in the system on the date of extraction.
21
0
2
4
6
8
10
12
14
16
18
Central Region North Region South Region Central Region North Region South Region
Mar-2015 Apr-2015
GW
Daily Average Generation Outages and Derates - Reliability Footprint
Forced Planned Derates
Source: The Web-based Revenue Sufficiency Guarantee Report
Revenue Sufficiency Guarantee by Regions
*DA_RSG_VLR% is the ratio of DA RSG associated with VLR commitments to the total DA RSG MWP.
*RT_RSG_Txx% is the ratio of RT RSG associated with congestion mitigation to the total RT RSG MWP.
Date of Extraction: May 5, 2015. Values may change due to resettlement.
22
0%
10%
20%
30%
40%
50%
60%
70%
80%
$0.00
$2.00
$4.00
$6.00
$8.00
$10.00
Central Region North Region South Region
Apr-2015
Millions
DA RSG & DA RSG Associated with VLR
Total DA RSG MWP DA RSG Associated with VLR Commitments DA_RSG_VLR%*
0%
5%
10%
15%
20%
25%
30%
35%
40%
$0.00
$2.00
$4.00
$6.00
$8.00
$10.00
Central Region North Region South Region
Apr-2015
Millions
RT RSG & RT RSG Associated with Congestion Mitigation
RT RSG MWP RT RSG Associated with Congestion Mitigation RT_RSG_Txx%*
Reliability – Manual Re-dispatches and TLR by Region
Transmission Loading Relief (TLR) Events (Count)
Levels:
3 – curtailing non-firm
4 – curtailing non-firm and reconfiguring
5 – curtailing firm
6 – emergency
Manual Redispatches (Count)
Source: MISO Real-Time Operations Department
TLR – April 2015
Notifications – April 2015
• 04/08/15 15:38-23:00 EST: Severe
Weather Alert for areas in the Central
Region, due to Tornado Warnings.
• 04/09/15 01:00-02:30 EST: System
Status Level 1 YELLOW due to network
issues affecting M2M, ARS, MCS and the
portal.
• 04/09/15 19:30 EST to 04/10/2015
03:00 EST: Severe Weather Alert for
MISO footprint due to a long line of
severe thunderstorms including tornado
watches and warnings.
• 04/27/15: 05:50 – 14:00 EST Severe
Weather Alert issued for southern
Louisiana and southern Mississippi areas
due to heavy storms, tornadoes,
damaging wind and hail.
• 04/27/15: 10:10 – 14:00 EST
Conservative Operations issued for EES,
CLEC, LAFA, LEPA, SME due to multiple
forced transmission outages.
0 Firm MWh Curtailed
23,518 Non-Firm MWh Curtailed
23
0 0 0
4
2
00 0 0 0 0 00 0 0 0 0 0
Central Region North Region South Region Central Region North Region South Region
Mar-2015 Apr-2015
Level 3&4 Level 5 Level 6
3
25
8
2
10
17
49
Central Region North Region South Region Central Region North Region South Region MISO
Mar-2015 Apr-2015 2014 AVG
# Number of Manual Redispatch
Transmission Service and Generation Interconnection
Request by Region
Long-term Firm Transmission Service Queue
Source: MISO Transmission Planning Department
Generation Interconnect Queue
Number of Requests
April 2015
Note: The regions are determined based on POINT_OF_RECEIPT.
24
0
5
10
15
20
25
30
35
40
Central Region North Region South Region
Apr-2015
# of Requests in Study
0
4
8
12
Central Region North Region South Region
Apr-2015
# of Requests Processed
0
5,000
10,000
15,000
20,000
25,000
30,000
Central Region North Region South Region
Apr-2015
MW
Size of Queue( MW) -Total
0
200
400
600
800
1,000
1,200
1,400
Central Region North Region South Region
Apr-2015
MW
Size of Queue( MW) -New Size of Queue (MW) - Resolved
Region Total New Resolved
Central 83 0 4
North 55 2 1
South 22 0 1
Transmission Service and Generation Interconnection Request by
Region Long-term Firm Transmission Service Queue
Generation Interconnect Queue
Number of Requests
February 2015
Note: The regions are determined based on POINT_OF_RECEIPT.
25
0
5
10
15
20
25
30
35
Central Region North Region South Region
Feb-2015
# of Requests in Study
0
4
8
12
16
20
24
Central Region North Region South Region
Feb-2015
# of Requests Processed
0
5,000
10,000
15,000
20,000
25,000
30,000
Central Region North Region South Region
Feb-2015
MW
Size of Queue( MW) -Total
0
100
200
300
400
500
600
700
Central Region North Region South Region
Feb-2015
MW
Size of Queue( MW) -New Size of Queue (MW) - Resolved
Region Total New Resolved
Central 89 0 3
North 51 0 0
South 25 0 1

More Related Content

Similar to South Region Operations Metrics

Rice Energy May 2015 Company Presentation
Rice Energy May 2015 Company PresentationRice Energy May 2015 Company Presentation
Rice Energy May 2015 Company PresentationMarcellus Drilling News
 
Decarbonising EU Power: Trends and Challenges
Decarbonising EU Power: Trends and ChallengesDecarbonising EU Power: Trends and Challenges
Decarbonising EU Power: Trends and ChallengesMatt Gray
 
The upgrade of LARI app by MT Abi Saab
The upgrade of LARI app by MT Abi SaabThe upgrade of LARI app by MT Abi Saab
The upgrade of LARI app by MT Abi SaabWaPOR
 
1999 infiniti qx4 service repair manual
1999 infiniti qx4 service repair manual1999 infiniti qx4 service repair manual
1999 infiniti qx4 service repair manualfjjksekksemm
 
Vector Load Report - 24Feb16
Vector Load Report - 24Feb16Vector Load Report - 24Feb16
Vector Load Report - 24Feb16Mark Johnson
 
Clean Energy Council (CEC) Annual Conference 2015 Compiled Presentations
Clean Energy Council (CEC) Annual Conference 2015 Compiled Presentations Clean Energy Council (CEC) Annual Conference 2015 Compiled Presentations
Clean Energy Council (CEC) Annual Conference 2015 Compiled Presentations Turlough Guerin GAICD FGIA
 
1999 Infiniti Q45 Service Repair Manual
1999 Infiniti Q45 Service Repair Manual1999 Infiniti Q45 Service Repair Manual
1999 Infiniti Q45 Service Repair Manualfusjejfjskekmemm
 
الدكتور / علي المراكبي استشاري الهندسة الميكانيكية وخبير ترشيد الطاقة بعنوان...
 الدكتور / علي المراكبي استشاري الهندسة الميكانيكية وخبير ترشيد الطاقة بعنوان... الدكتور / علي المراكبي استشاري الهندسة الميكانيكية وخبير ترشيد الطاقة بعنوان...
الدكتور / علي المراكبي استشاري الهندسة الميكانيكية وخبير ترشيد الطاقة بعنوان...Egyptian Engineers Association
 
Power market operation 발표
Power market operation 발표Power market operation 발표
Power market operation 발표상진 정
 
2001 Infiniti G20 Service Repair Manual.pdf
2001 Infiniti G20 Service Repair Manual.pdf2001 Infiniti G20 Service Repair Manual.pdf
2001 Infiniti G20 Service Repair Manual.pdffusjekmdjdud3e
 
2001 Infiniti G20 Service Repair Manual.pdf
2001 Infiniti G20 Service Repair Manual.pdf2001 Infiniti G20 Service Repair Manual.pdf
2001 Infiniti G20 Service Repair Manual.pdff8usjekdkdmmd
 
2001 Infiniti G20 Service Repair Manual.pdf
2001 Infiniti G20 Service Repair Manual.pdf2001 Infiniti G20 Service Repair Manual.pdf
2001 Infiniti G20 Service Repair Manual.pdfjjkdmsmmd
 
2001 Infiniti G20 Service Repair Manual.pdf
2001 Infiniti G20 Service Repair Manual.pdf2001 Infiniti G20 Service Repair Manual.pdf
2001 Infiniti G20 Service Repair Manual.pdff8usejdkddmmd
 
2001 Infiniti G20 Service Repair Manual.pdf
2001 Infiniti G20 Service Repair Manual.pdf2001 Infiniti G20 Service Repair Manual.pdf
2001 Infiniti G20 Service Repair Manual.pdff8suejjdkddmmd
 
2001 Infiniti G20 Service Repair Manual.pdf
2001 Infiniti G20 Service Repair Manual.pdf2001 Infiniti G20 Service Repair Manual.pdf
2001 Infiniti G20 Service Repair Manual.pdffjksekmmdm
 
Ceylon Electricity Board Statistical Digest 2015
Ceylon Electricity Board Statistical Digest 2015Ceylon Electricity Board Statistical Digest 2015
Ceylon Electricity Board Statistical Digest 2015Private Consultants
 
M Resources Technical Marketing Sample Pack 2015
M Resources Technical Marketing Sample Pack 2015M Resources Technical Marketing Sample Pack 2015
M Resources Technical Marketing Sample Pack 2015Ross Stainlay
 
Tablero Gerencial de Mando - Business Intelligence
Tablero Gerencial de Mando - Business IntelligenceTablero Gerencial de Mando - Business Intelligence
Tablero Gerencial de Mando - Business IntelligenceLuis Damian
 

Similar to South Region Operations Metrics (20)

My Portfolio
My PortfolioMy Portfolio
My Portfolio
 
Rice Energy May 2015 Company Presentation
Rice Energy May 2015 Company PresentationRice Energy May 2015 Company Presentation
Rice Energy May 2015 Company Presentation
 
Decarbonising EU Power: Trends and Challenges
Decarbonising EU Power: Trends and ChallengesDecarbonising EU Power: Trends and Challenges
Decarbonising EU Power: Trends and Challenges
 
The upgrade of LARI app by MT Abi Saab
The upgrade of LARI app by MT Abi SaabThe upgrade of LARI app by MT Abi Saab
The upgrade of LARI app by MT Abi Saab
 
1999 infiniti qx4 service repair manual
1999 infiniti qx4 service repair manual1999 infiniti qx4 service repair manual
1999 infiniti qx4 service repair manual
 
CustomisedPortfoliosExample
CustomisedPortfoliosExampleCustomisedPortfoliosExample
CustomisedPortfoliosExample
 
Vector Load Report - 24Feb16
Vector Load Report - 24Feb16Vector Load Report - 24Feb16
Vector Load Report - 24Feb16
 
Clean Energy Council (CEC) Annual Conference 2015 Compiled Presentations
Clean Energy Council (CEC) Annual Conference 2015 Compiled Presentations Clean Energy Council (CEC) Annual Conference 2015 Compiled Presentations
Clean Energy Council (CEC) Annual Conference 2015 Compiled Presentations
 
1999 Infiniti Q45 Service Repair Manual
1999 Infiniti Q45 Service Repair Manual1999 Infiniti Q45 Service Repair Manual
1999 Infiniti Q45 Service Repair Manual
 
الدكتور / علي المراكبي استشاري الهندسة الميكانيكية وخبير ترشيد الطاقة بعنوان...
 الدكتور / علي المراكبي استشاري الهندسة الميكانيكية وخبير ترشيد الطاقة بعنوان... الدكتور / علي المراكبي استشاري الهندسة الميكانيكية وخبير ترشيد الطاقة بعنوان...
الدكتور / علي المراكبي استشاري الهندسة الميكانيكية وخبير ترشيد الطاقة بعنوان...
 
Power market operation 발표
Power market operation 발표Power market operation 발표
Power market operation 발표
 
2001 Infiniti G20 Service Repair Manual.pdf
2001 Infiniti G20 Service Repair Manual.pdf2001 Infiniti G20 Service Repair Manual.pdf
2001 Infiniti G20 Service Repair Manual.pdf
 
2001 Infiniti G20 Service Repair Manual.pdf
2001 Infiniti G20 Service Repair Manual.pdf2001 Infiniti G20 Service Repair Manual.pdf
2001 Infiniti G20 Service Repair Manual.pdf
 
2001 Infiniti G20 Service Repair Manual.pdf
2001 Infiniti G20 Service Repair Manual.pdf2001 Infiniti G20 Service Repair Manual.pdf
2001 Infiniti G20 Service Repair Manual.pdf
 
2001 Infiniti G20 Service Repair Manual.pdf
2001 Infiniti G20 Service Repair Manual.pdf2001 Infiniti G20 Service Repair Manual.pdf
2001 Infiniti G20 Service Repair Manual.pdf
 
2001 Infiniti G20 Service Repair Manual.pdf
2001 Infiniti G20 Service Repair Manual.pdf2001 Infiniti G20 Service Repair Manual.pdf
2001 Infiniti G20 Service Repair Manual.pdf
 
2001 Infiniti G20 Service Repair Manual.pdf
2001 Infiniti G20 Service Repair Manual.pdf2001 Infiniti G20 Service Repair Manual.pdf
2001 Infiniti G20 Service Repair Manual.pdf
 
Ceylon Electricity Board Statistical Digest 2015
Ceylon Electricity Board Statistical Digest 2015Ceylon Electricity Board Statistical Digest 2015
Ceylon Electricity Board Statistical Digest 2015
 
M Resources Technical Marketing Sample Pack 2015
M Resources Technical Marketing Sample Pack 2015M Resources Technical Marketing Sample Pack 2015
M Resources Technical Marketing Sample Pack 2015
 
Tablero Gerencial de Mando - Business Intelligence
Tablero Gerencial de Mando - Business IntelligenceTablero Gerencial de Mando - Business Intelligence
Tablero Gerencial de Mando - Business Intelligence
 

Recently uploaded

BabyOno dropshipping via API with DroFx.pptx
BabyOno dropshipping via API with DroFx.pptxBabyOno dropshipping via API with DroFx.pptx
BabyOno dropshipping via API with DroFx.pptxolyaivanovalion
 
VIP High Class Call Girls Jamshedpur Anushka 8250192130 Independent Escort Se...
VIP High Class Call Girls Jamshedpur Anushka 8250192130 Independent Escort Se...VIP High Class Call Girls Jamshedpur Anushka 8250192130 Independent Escort Se...
VIP High Class Call Girls Jamshedpur Anushka 8250192130 Independent Escort Se...Suhani Kapoor
 
Invezz.com - Grow your wealth with trading signals
Invezz.com - Grow your wealth with trading signalsInvezz.com - Grow your wealth with trading signals
Invezz.com - Grow your wealth with trading signalsInvezz1
 
Carero dropshipping via API with DroFx.pptx
Carero dropshipping via API with DroFx.pptxCarero dropshipping via API with DroFx.pptx
Carero dropshipping via API with DroFx.pptxolyaivanovalion
 
Delhi Call Girls Punjabi Bagh 9711199171 ☎✔👌✔ Whatsapp Hard And Sexy Vip Call
Delhi Call Girls Punjabi Bagh 9711199171 ☎✔👌✔ Whatsapp Hard And Sexy Vip CallDelhi Call Girls Punjabi Bagh 9711199171 ☎✔👌✔ Whatsapp Hard And Sexy Vip Call
Delhi Call Girls Punjabi Bagh 9711199171 ☎✔👌✔ Whatsapp Hard And Sexy Vip Callshivangimorya083
 
Introduction-to-Machine-Learning (1).pptx
Introduction-to-Machine-Learning (1).pptxIntroduction-to-Machine-Learning (1).pptx
Introduction-to-Machine-Learning (1).pptxfirstjob4
 
BigBuy dropshipping via API with DroFx.pptx
BigBuy dropshipping via API with DroFx.pptxBigBuy dropshipping via API with DroFx.pptx
BigBuy dropshipping via API with DroFx.pptxolyaivanovalion
 
VIP Call Girls in Amravati Aarohi 8250192130 Independent Escort Service Amravati
VIP Call Girls in Amravati Aarohi 8250192130 Independent Escort Service AmravatiVIP Call Girls in Amravati Aarohi 8250192130 Independent Escort Service Amravati
VIP Call Girls in Amravati Aarohi 8250192130 Independent Escort Service AmravatiSuhani Kapoor
 
代办国外大学文凭《原版美国UCLA文凭证书》加州大学洛杉矶分校毕业证制作成绩单修改
代办国外大学文凭《原版美国UCLA文凭证书》加州大学洛杉矶分校毕业证制作成绩单修改代办国外大学文凭《原版美国UCLA文凭证书》加州大学洛杉矶分校毕业证制作成绩单修改
代办国外大学文凭《原版美国UCLA文凭证书》加州大学洛杉矶分校毕业证制作成绩单修改atducpo
 
BPAC WITH UFSBI GENERAL PRESENTATION 18_05_2017-1.pptx
BPAC WITH UFSBI GENERAL PRESENTATION 18_05_2017-1.pptxBPAC WITH UFSBI GENERAL PRESENTATION 18_05_2017-1.pptx
BPAC WITH UFSBI GENERAL PRESENTATION 18_05_2017-1.pptxMohammedJunaid861692
 
Ukraine War presentation: KNOW THE BASICS
Ukraine War presentation: KNOW THE BASICSUkraine War presentation: KNOW THE BASICS
Ukraine War presentation: KNOW THE BASICSAishani27
 
Generative AI on Enterprise Cloud with NiFi and Milvus
Generative AI on Enterprise Cloud with NiFi and MilvusGenerative AI on Enterprise Cloud with NiFi and Milvus
Generative AI on Enterprise Cloud with NiFi and MilvusTimothy Spann
 
Al Barsha Escorts $#$ O565212860 $#$ Escort Service In Al Barsha
Al Barsha Escorts $#$ O565212860 $#$ Escort Service In Al BarshaAl Barsha Escorts $#$ O565212860 $#$ Escort Service In Al Barsha
Al Barsha Escorts $#$ O565212860 $#$ Escort Service In Al BarshaAroojKhan71
 
Market Analysis in the 5 Largest Economic Countries in Southeast Asia.pdf
Market Analysis in the 5 Largest Economic Countries in Southeast Asia.pdfMarket Analysis in the 5 Largest Economic Countries in Southeast Asia.pdf
Market Analysis in the 5 Largest Economic Countries in Southeast Asia.pdfRachmat Ramadhan H
 
Industrialised data - the key to AI success.pdf
Industrialised data - the key to AI success.pdfIndustrialised data - the key to AI success.pdf
Industrialised data - the key to AI success.pdfLars Albertsson
 
Call me @ 9892124323 Cheap Rate Call Girls in Vashi with Real Photo 100% Secure
Call me @ 9892124323  Cheap Rate Call Girls in Vashi with Real Photo 100% SecureCall me @ 9892124323  Cheap Rate Call Girls in Vashi with Real Photo 100% Secure
Call me @ 9892124323 Cheap Rate Call Girls in Vashi with Real Photo 100% SecurePooja Nehwal
 
Ravak dropshipping via API with DroFx.pptx
Ravak dropshipping via API with DroFx.pptxRavak dropshipping via API with DroFx.pptx
Ravak dropshipping via API with DroFx.pptxolyaivanovalion
 
Halmar dropshipping via API with DroFx
Halmar  dropshipping  via API with DroFxHalmar  dropshipping  via API with DroFx
Halmar dropshipping via API with DroFxolyaivanovalion
 
Schema on read is obsolete. Welcome metaprogramming..pdf
Schema on read is obsolete. Welcome metaprogramming..pdfSchema on read is obsolete. Welcome metaprogramming..pdf
Schema on read is obsolete. Welcome metaprogramming..pdfLars Albertsson
 

Recently uploaded (20)

BabyOno dropshipping via API with DroFx.pptx
BabyOno dropshipping via API with DroFx.pptxBabyOno dropshipping via API with DroFx.pptx
BabyOno dropshipping via API with DroFx.pptx
 
VIP High Class Call Girls Jamshedpur Anushka 8250192130 Independent Escort Se...
VIP High Class Call Girls Jamshedpur Anushka 8250192130 Independent Escort Se...VIP High Class Call Girls Jamshedpur Anushka 8250192130 Independent Escort Se...
VIP High Class Call Girls Jamshedpur Anushka 8250192130 Independent Escort Se...
 
Invezz.com - Grow your wealth with trading signals
Invezz.com - Grow your wealth with trading signalsInvezz.com - Grow your wealth with trading signals
Invezz.com - Grow your wealth with trading signals
 
Carero dropshipping via API with DroFx.pptx
Carero dropshipping via API with DroFx.pptxCarero dropshipping via API with DroFx.pptx
Carero dropshipping via API with DroFx.pptx
 
Delhi Call Girls Punjabi Bagh 9711199171 ☎✔👌✔ Whatsapp Hard And Sexy Vip Call
Delhi Call Girls Punjabi Bagh 9711199171 ☎✔👌✔ Whatsapp Hard And Sexy Vip CallDelhi Call Girls Punjabi Bagh 9711199171 ☎✔👌✔ Whatsapp Hard And Sexy Vip Call
Delhi Call Girls Punjabi Bagh 9711199171 ☎✔👌✔ Whatsapp Hard And Sexy Vip Call
 
Introduction-to-Machine-Learning (1).pptx
Introduction-to-Machine-Learning (1).pptxIntroduction-to-Machine-Learning (1).pptx
Introduction-to-Machine-Learning (1).pptx
 
BigBuy dropshipping via API with DroFx.pptx
BigBuy dropshipping via API with DroFx.pptxBigBuy dropshipping via API with DroFx.pptx
BigBuy dropshipping via API with DroFx.pptx
 
VIP Call Girls in Amravati Aarohi 8250192130 Independent Escort Service Amravati
VIP Call Girls in Amravati Aarohi 8250192130 Independent Escort Service AmravatiVIP Call Girls in Amravati Aarohi 8250192130 Independent Escort Service Amravati
VIP Call Girls in Amravati Aarohi 8250192130 Independent Escort Service Amravati
 
代办国外大学文凭《原版美国UCLA文凭证书》加州大学洛杉矶分校毕业证制作成绩单修改
代办国外大学文凭《原版美国UCLA文凭证书》加州大学洛杉矶分校毕业证制作成绩单修改代办国外大学文凭《原版美国UCLA文凭证书》加州大学洛杉矶分校毕业证制作成绩单修改
代办国外大学文凭《原版美国UCLA文凭证书》加州大学洛杉矶分校毕业证制作成绩单修改
 
BPAC WITH UFSBI GENERAL PRESENTATION 18_05_2017-1.pptx
BPAC WITH UFSBI GENERAL PRESENTATION 18_05_2017-1.pptxBPAC WITH UFSBI GENERAL PRESENTATION 18_05_2017-1.pptx
BPAC WITH UFSBI GENERAL PRESENTATION 18_05_2017-1.pptx
 
꧁❤ Aerocity Call Girls Service Aerocity Delhi ❤꧂ 9999965857 ☎️ Hard And Sexy ...
꧁❤ Aerocity Call Girls Service Aerocity Delhi ❤꧂ 9999965857 ☎️ Hard And Sexy ...꧁❤ Aerocity Call Girls Service Aerocity Delhi ❤꧂ 9999965857 ☎️ Hard And Sexy ...
꧁❤ Aerocity Call Girls Service Aerocity Delhi ❤꧂ 9999965857 ☎️ Hard And Sexy ...
 
Ukraine War presentation: KNOW THE BASICS
Ukraine War presentation: KNOW THE BASICSUkraine War presentation: KNOW THE BASICS
Ukraine War presentation: KNOW THE BASICS
 
Generative AI on Enterprise Cloud with NiFi and Milvus
Generative AI on Enterprise Cloud with NiFi and MilvusGenerative AI on Enterprise Cloud with NiFi and Milvus
Generative AI on Enterprise Cloud with NiFi and Milvus
 
Al Barsha Escorts $#$ O565212860 $#$ Escort Service In Al Barsha
Al Barsha Escorts $#$ O565212860 $#$ Escort Service In Al BarshaAl Barsha Escorts $#$ O565212860 $#$ Escort Service In Al Barsha
Al Barsha Escorts $#$ O565212860 $#$ Escort Service In Al Barsha
 
Market Analysis in the 5 Largest Economic Countries in Southeast Asia.pdf
Market Analysis in the 5 Largest Economic Countries in Southeast Asia.pdfMarket Analysis in the 5 Largest Economic Countries in Southeast Asia.pdf
Market Analysis in the 5 Largest Economic Countries in Southeast Asia.pdf
 
Industrialised data - the key to AI success.pdf
Industrialised data - the key to AI success.pdfIndustrialised data - the key to AI success.pdf
Industrialised data - the key to AI success.pdf
 
Call me @ 9892124323 Cheap Rate Call Girls in Vashi with Real Photo 100% Secure
Call me @ 9892124323  Cheap Rate Call Girls in Vashi with Real Photo 100% SecureCall me @ 9892124323  Cheap Rate Call Girls in Vashi with Real Photo 100% Secure
Call me @ 9892124323 Cheap Rate Call Girls in Vashi with Real Photo 100% Secure
 
Ravak dropshipping via API with DroFx.pptx
Ravak dropshipping via API with DroFx.pptxRavak dropshipping via API with DroFx.pptx
Ravak dropshipping via API with DroFx.pptx
 
Halmar dropshipping via API with DroFx
Halmar  dropshipping  via API with DroFxHalmar  dropshipping  via API with DroFx
Halmar dropshipping via API with DroFx
 
Schema on read is obsolete. Welcome metaprogramming..pdf
Schema on read is obsolete. Welcome metaprogramming..pdfSchema on read is obsolete. Welcome metaprogramming..pdf
Schema on read is obsolete. Welcome metaprogramming..pdf
 

South Region Operations Metrics

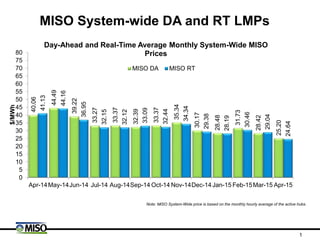
  • 1. MISO System-wide DA and RT LMPs 40.06 44.49 39.22 33.27 33.37 32.39 33.37 35.34 30.17 28.48 31.73 28.42 25.20 41.13 44.16 36.95 32.15 32.12 33.09 32.44 34.34 29.38 28.19 30.46 29.04 24.64 0 5 10 15 20 25 30 35 40 45 50 55 60 65 70 75 80 Apr-14May-14Jun-14 Jul-14 Aug-14Sep-14 Oct-14 Nov-14Dec-14Jan-15 Feb-15Mar-15 Apr-15 $/MWh Day-Ahead and Real-Time Average Monthly System-Wide MISO Prices MISO DA MISO RT Note: MISO System-Wide price is based on the monthly hourly average of the active hubs. 1
  • 2. 30.7% 30.1% 22.8% 14.0% 10.3% 12.3% 12.8% 14.0% 10.4% 11.1% 19.0% 17.9% 13.6% 0.0% 10.0% 20.0% 30.0% 40.0% 50.0% 60.0% 70.0% Apr-14 May-14 Jun-14 Jul-14 Aug-14 Sep-14 Oct-14 Nov-14 Dec-14 Jan-15 Feb-15 Mar-15 Apr-15 PercentPriceDivergence* DA/RT Price Deviation Price Convergence: DA and RT LMP 12.30 13.41 8.94 4.65 3.44 4.00 4.27 4.93 3.13 3.17 6.03 5.08 3.42 -1.08 0.33 0.23 1.12 1.25 -0.70 0.93 1.00 0.78 0.29 1.27 -0.63 0.56 Apr-14 May-14 Jun-14 Jul-14 Aug-14 Sep-14 Oct-14 Nov-14 Dec-14 Jan-15 Feb-15 Mar-15 Apr-15 $/MWh Average Absolute (DA-RT) difference Average (DA-RT) difference * Monthly deviation, expressed as a percent of average DA LMP, is calculated as the average of hourly absolute (DA-RT) price differences divided by the average of hourly DA LMPs for the month. Note: MISO System-Wide price is based on the monthly hourly average of the active trading hubs. 2
  • 3. 29.68 30.77 30.01 24.18 25.88 32.79 26.22 28.50 28.64 29.93 29.20 24.01 25.07 36.81 25.95 28.52 22.20 24.64 23.36 16.70 20.98 23.85 22.48 22.03 19.99 24.78 23.12 16.15 19.99 21.35 21.13 20.93 ILL IND MICH MINN ARK LOU TEX MISO $/MWh Peak/Off-Peak: March 2015 DA Peak RT Peak DA OffPeak RT OffPeak MISO DA and RT Hub LMPs 3 ILL IND MICH MINN ARK LOU TEX MISO DA Peak 1.55 1.54 0.31 -2.45 -1.55 3.70 -2.10 0.14 RT Peak 0.45 0.64 -0.36 -2.95 -2.18 8.03 -2.09 0.22 DA OffPeak 0.84 2.30 0.91 -3.35 0.03 1.75 0.56 0.43 RT OffPeak -0.79 3.07 1.42 -3.37 -0.16 0.14 0.06 0.05 Congestion Component of LMP ($/MWh)
  • 4. 0 100 200 300 400 500 600 0 20 40 60 80 100 120 140 160 180 200 220 240 260 280 300 320 340 360 $/MWh Number of Hours Price Duration Curve – Peak Hours Note: MISO System-Wide price is based on the hourly average of the active hubs. 4 Apr-2015 MISO Real-Time Price 196.48 2(0.57%) 2(0.57%) 344(97.73%) 0(0.00%) Apr-2015 MISO Day-Ahead Price 39.44 0(0.00%) 0(0.00%) 352(100.00%) 0(0.00%) Mar-2015 MISO Real-Time Price 476.20 2(0.57%) 3(0.85%) 328(93.18%) 0(0.00%) Mar-2015 MISO Day-Ahead Price 78.11 0(0.00%) 0(0.00%) 340(96.59%) 0(0.00%) Hours w ith LMP< $0/MWh Hours w ith LMP> $150/MWh Hours w ith LMP> $100/MWh Hours w ith LMP< $50/MWh Peak Hourly LMP
  • 5. Price Duration Curve – Off-Peak Hours Source MISO Information Delivery and Market Analysis Department Note: MISO System-Wide price is based on the hourly average of the active hubs. 5 0 10 20 30 40 50 60 70 80 90 100 0 20 40 60 80 100 120 140 160 180 200 220 240 260 280 300 320 340 360 380 400 420 $/MWh Number of Hours Apr-2015 MISO Real-Time Price 55.80 0(0.00%) 0(0.00%) 367(99.73%) 0(0.00%) Apr-2015 MISO Day-Ahead Price 38.69 0(0.00%) 0(0.00%) 368(100.00%) 0(0.00%) Mar-2015 MISO Real-Time Price 86.65 0(0.00%) 0(0.00%) 386(98.47%) 0(0.00%) Mar-2015 MISO Day-Ahead Price 56.99 0(0.00%) 0(0.00%) 390(99.49%) 0(0.00%) Peak Hourly LMP Hours w ith LMP< $0/MWh Hours w ith LMP> $150/MWh Hours w ith LMP> $100/MWh Hours w ith LMP< $50/MWh
  • 6. 92.24 131.77 108.02 52.54 49.01 85.99 79.25 65.59 50.36 55.40 94.71 74.04 49.21 Apr-14 May-14 Jun-14 Jul-14 Aug-14 Sep-14 Oct-14 Nov-14 Dec-14 Jan-15 Feb-15 Mar-15 Apr-15 DA Congestion Collections Normalized* Day-Ahead Market Congestion Collections $/MWh 1.72 2.27 1.64 0.77 0.69 1.42 1.39 1.13 0.84 0.84 1.53 1.27 0.94 Apr-14 May-14 Jun-14 Jul-14 Aug-14 Sep-14 Oct-14 Nov-14 Dec-14 Jan-15 Feb-15 Mar-15 Apr-15 Day-Ahead Market Congestion Collections $ in millions Source: MISO Information Delivery and Market Analysis Department * Normalized using Day-Ahead load Date of Extraction: May 05, 2015. 6
  • 7. 4.74 4.61 4.66 4.15 3.92 3.96 3.87 4.49 3.65 3.09 4.48 4.62 4.60 4.59 4.08 3.86 3.94 3.80 4.02 3.43 2.99 2.88 2.87 2.58 3.01 2.58 Apr-14 May-14 Jun-14 Jul-14 Aug-14 Sep-14 Oct-14 Nov-14 Dec-14 Jan-15 Feb-15 Mar-15 Apr-15 Chicago Citygate Hub Henry Hub 1.98 1.95 1.94 1.88 1.86 1.85 1.89 1.90 1.90 1.92 1.78 1.71 1.72 0.74 0.74 0.73 0.71 0.67 0.65 0.66 0.66 0.66 0.66 0.66 0.66 0.66 Apr-14 May-14 Jun-14 Jul-14 Aug-14 Sep-14 Oct-14 Nov-14 Dec-14 Jan-15 Feb-15 Mar-15 Apr-15 Illinois Basin Powder River Basin Nominal Fuel Prices Gas ($/mmbtu) Coal ($/mmbtu) Chicago Citygate Trading Hub and Henry Trading Hub Oil* ($/mmbtu) Illinois Basin Heat Content = 11,800 btu/lb, Powder River Basin Heat Content = 8,800 btu/lb Distillate Fuel Oil Heat Content = 5.825 mmbtu/bbl Source: Publicly Available/Government Sources-EIA and ICE 22.82 22.69 22.73 22.36 21.95 21.32 20.09 19.68 16.59 14.58 15.92 14.50 14.83 Apr-14 May-14 Jun-14 Jul-14 Aug-14 Sep-14 Oct-14 Nov-14 Dec-14 Jan-15 Feb-15 Mar-15 Apr-15 https://www.theice.com/marketdata/reports/76 http://www.eia.doe.gov/cneaf/coal/page/coalnews/coalmar.html#spot; “SNL Energy” http://www.eia.gov/emeu/steo/pub/cf_tables/steotables.cfm?tableNumber=8 * Monthly oil prices are estimates and subject to change upon finalization. 7
  • 8. 193.61 255.95 175.34 89.85 79.28 134.66 140.66 125.26 95.91 101.27 167.54 139.74 92.80 125.34 7.48 2.83 2.65 21.74 6.49 0.32 12.19 2.55 1.95 4.97 0.00 1.62 1.23 15.63 0 50 100 150 200 250 300 Apr 2014 May Jun Jul Aug Sep Oct Nov Dec Jan 2015 Feb Mar Apr YTD Avg $inMillions Hourly and Monthly Funding for Credits Net FTR Shortfall Source: MISO Market ECF Report Date of Extraction: May 5, 2015. Values may change due to resettlement. FTR Rolling 12-month percentage calculations can be found in the April 2015 FTRWG meeting materials. FTR Monthly and Rolling 12-Month Funding C 8 Apr-14 May-14 Jun-14 Jul-14 Aug-14 Sep-14 Oct-14 Nov-14 Dec-14 Jan-15 Feb-15 Mar-15 Apr-15 Monthly FTR Allocation% 89.9% 97.5% 99.8% 96.9% 96.8% 94.7% 90.0% 91.1% 97.4% 98.8% 99.0% 100.0% 94.9% Rolling 12-month Allocation% 97.7% 98.2% 98.6% 98.4% 98.3% 97.9% 97.6% 97.5% 97.4% 96.1% 96.1% 96.1% 96.8%
  • 9. Offered Capacity and RT Peak Load Obligation Offered Capacity (Hourly Average per category) MW Source: MISO Information Delivery and Market Analysis Department *Gas excludes CC and CT units. **Other includes DRR as well as oil ,pet coke and waste units. 1Real-Time ICCP Load plus Real-Time Regulation Requirement plus Real-Time Spinning Requirement at the daily Peak hour Average Net Scheduled Interchange over all hours Hydro Nuclear Gas* CC CT Other** 1Real-Time peak load obligation Coal Wind 9 0 10,000 20,000 30,000 40,000 50,000 60,000 70,000 80,000 90,000 100,000 110,000 120,000 130,000 140,000 150,000 160,000 4/1 4/2 4/3 4/4 4/5 4/6 4/7 4/8 4/9 4/10 4/11 4/12 4/13 4/14 4/15 4/16 4/17 4/18 4/19 4/20 4/21 4/22 4/23 4/24 4/25 4/26 4/27 4/28 4/29 4/30
  • 10. Marginal Fuel – April 2015 Percentage of Time a Fuel is Marginal in the Real-Time Market % of Time Source: MISO Information Delivery and Market Analysis Department 42 85 30 0 0 0 66 46 82 48 0 2 1 55 44 83 39 0 1 0 61 0 20 40 60 80 100 120 CC Coal Gas^^ Nuclear Oil Hydro *Wind Off-Peak On-Peak Total Note: Binding transmission constraints can produce instances where more than one unit is marginal in the system. Consequently, more than one fuel may be on the margin; and since each marginal unit is included in the analysis, the percentage may sum to more than 100%. ^^Gas excludes Combined Cycle units 10
  • 11. Generation Outages and Derates Source: MISO CROW Outage Scheduler * Forced Outages include Emergency, Forced, and Urgent * Planned Outages include Planned *De-rates are based on limits observed in Real-Time and may reflect normal seasonal de-rates in addition to de-rates for maintenance or other operating conditions. Outages extracted on May 01, 2015 0 5,000 10,000 15,000 20,000 25,000 30,000 35,000 40,000 Apr-14 May-14 Jun-14 Jul-14 Aug-14 Sep-14 Oct-14 Nov-14 Dec-14 Jan-15 Feb-15 Mar-15 Apr-15 MW Daily Average Generation Outages and Derates - Reliability Footprint Forced* Planned* Derates* Data includes both MISO market and reliability footprints. Outage data is “point in time” and can change. The chart reflects the data as it resided in the system on the date of extraction. 11
  • 12. 0 0 0 0 0 0 0 0 0 0 0 0 00 0 0 0 0 0 0 0 0 0 0 0 00 0 0 0 0 0 0 0 0 0 0 0 0 Apr-14 May-14 Jun-14 Jul-14 Aug-14 Sep-14 Oct-14 Nov-14 Dec-14 Jan-15 Feb-15 Mar-15 Apr-15 Count Alerts* Warnings* Events* Minimum and Maximum Generation Notifications 0 0 0 1 0 0 0 0 0 0 0 0 00 0 0 0 0 0 0 0 0 0 0 0 00 0 0 0 0 0 0 0 0 0 0 0 0 Apr-14 May-14 Jun-14 Jul-14 Aug-14 Sep-14 Oct-14 Nov-14 Dec-14 Jan-15 Feb-15 Mar-15 Apr-15 Count Alerts* Warnings* Events* Minimum Generation Actions Supply surplus situations during light load periods when on-line resources need to operate at Emergency Minimum levels or be decommitted as to not over burden the interconnected system. Maximum Generation Actions System-wide or transmission contingency related capacity shortages that may jeopardize the reliable operation of all or part of the MISO system. Source: MISO Real-Time Operations Department * Alerts – forecasting specific emergency situations in a future time-frame * Warnings – experiencing initial stages of an emergency situation and taking action * Events – experiencing an emergency situation and taking action 12
  • 13. 100 96 98.33 98.9 Apr-15 Mar-15 2015 YTD Avg 2014 Avg -4.2 251.5 256.6 286.2 -11.6 -3.5 -20.6 254.4 Apr-15 Mar-15 2015 YTD Avg 2014 Avg Mean STD 45 49 36 29 Apr-15 Mar-15 2015 YTD Avg 2014 Avg 6 0 0 0 0 0 Level 3 & 4 Level 5 Level 6 Apr-15 Mar-15 2.5 4.0 1.0 0.0 1.0 2.0 Apr-15 Mar-15 2015 YTD Avg 2014 Avg MISO External Reliability — Other Metrics Transmission Loading Relief (TLR) Events Area Control Error (ACE) MW Levels: 3 – curtailing non-firm 4 – curtailing non-firm and reconfiguring 5 – curtailing firm 6 – emergency Manual Redispatches (Count) 23,518 MWh Non-Firm MWh Curtailed 0 MWh Firm MWh Curtailed Source: MISO Real-Time Operations Department April 2015 Unit Commitment Efficiency Percentage of days with online generation held to target and sufficient to meet demand and constraints N Contingency Reserve Sharing # of ARS events O 13
  • 14. Generation Interconnect Queue – Overall 0 50 100 150 200 250 300 350 400 450 Apr 2013 May Jun Jul Aug Sep Oct Nov Dec Jan 2014 Feb Mar Apr May Jun Jul Aug Sep Oct Nov Dec Jan 2015 Feb Mar Apr #ofRequests 0 5,000 10,000 15,000 20,000 25,000 30,000 SizeofQueue(MW) Size of Queue (MW) Number of Requests Generation Interconnect Queue – Overall Status Source: MISO Transmission Planning Department 84 2 81 Requests Wind Coal Other 14
  • 15. Generator Suspension/Retirement – Overall 0 5 10 15 20 Apr 2013 May Jun Jul Aug Sep Oct Nov Dec Jan 2014 Feb Mar Apr May Jun Jul Aug Sep Oct Nov Dec Jan 2015 Feb Mar Apr #ofRequests 0 500 1,000 1,500 2,000 2,500 3,000 3,500 SizeofQueue(MW) Size of Queue (MW) Number of Requests Generator Suspension/Retirement Requests – Overall Source: MISO Transmission Planning Department 2 1 0 Requests in Study - Current Month Coal Gas Other 15
  • 16. Regional DA and RT Average Hub LMP Source: MISO Information Delivery and Market Analysis Department 16 29.68 30.77 30.01 24.18 25.88 32.79 26.22 28.64 29.93 29.20 24.01 25.07 36.81 25.95 22.20 24.64 23.36 16.70 20.98 23.85 22.48 19.99 24.78 23.12 16.15 19.99 21.35 21.13 ILL IND MICH MINN ARK LOU TEX Central Region North Region South Region Day-Ahead and Real-Time Average Monthly LMP for Hubs Peak/Off-Peak : April 2015 DA_Peak RT_Peak DA_offPeak RT_offPeak
  • 17. Source: MISO Information Delivery and Market Analysis Department Regional & System-wide DA & RT LMP – MISO, PJM, SPP Note: SPP price is the hourly average of LMPs at SPP’s Settlement Locations. Hourly LMP data provided by SPP. 21.70 25.20 30.35 22.00 24.64 29.81 SPP MISO PJM $/MWh Day-Ahead and Real-Time Average Monthly LMP for MISO, PJM and SPP: April 2015 Day-Ahead Real-Time 26.12 23.38 27.64 24.77 27.12 22.47 27.30 24.75 SPP South Hub MISO Arkansas Hub MISO Indiana Hub PJM Chicago Hub $/MWh 17
  • 18. 6.92 6.83 6.83 6.83 6.83 6.83 7.45 6.83 7.46 6.64 6.64 6.64 6.64 6.64 12.37 6.64 1.75 1.66 1.66 1.66 1.66 1.66 2.27 1.66 2.02 1.20 1.20 1.20 1.20 1.20 6.93 1.20 0.65 0.54 0.54 0.54 0.54 0.54 1.29 0.54 1.28 0.44 0.44 0.44 0.44 0.44 6.32 0.44 MISO Zone 1 Zone 2 Zone 3 Zone 4 Zone 5 Zone 6 Zone 7 Non-Zone Indiana Michigan Wisconsin Minnesota Louisiana Texas $/MWh Day-Ahead and Real-Time Monthly Average of Hourly MCPs by Zones: April 2015 REG_DA_MCP REG_RT_MCP SPIN_DA_MCP SPIN_RT_MCP SUPP_DA_MCP SUPP_RT_MCP Source: MISO Information Delivery and Market Analysis Department Note: No reserve MCP separation across zones if no reserve zone constraints bind. The definition of the Reserve Zones is updated on a quarterly basis, in conjunction with the update of the Network Model. See Zonal Regulation Map Zonal DA and RT MCP 18
  • 19. Average Load by Region Central Region (GW) South Region (GW) North Region (GW) Source: MISO Information Delivery and Market Analysis Department * Monthly data based on hourly ICCP load data. 36.57 37.93 43.12 42.36 44.35 39.51 37.18 40.40 41.28 43.61 45.07 39.37 35.83 Apr-14 May-14 Jun-14 Jul-14 Aug-14 Sep-14 Oct-14 Nov-14 Dec-14 Jan-15 Feb-15 Mar-15 Apr-15 15.27 15.05 16.68 17.20 17.70 15.70 15.43 17.22 17.47 17.91 18.39 16.04 14.84 Apr-14 May-14 Jun-14 Jul-14 Aug-14 Sep-14 Oct-14 Nov-14 Dec-14 Jan-15 Feb-15 Mar-15 Apr-15 16.81 18.15 21.48 21.88 22.75 20.96 17.69 17.86 17.88 19.51 19.48 16.88 16.68 Apr-14 May-14 Jun-14 Jul-14 Aug-14 Sep-14 Oct-14 Nov-14 Dec-14 Jan-15 Feb-15 Mar-15 Apr-15 Hourly Integrated Peak Load Hour: 04/09/2015 HE 14 Peak load: 79.00 GW Central Region: 41.60GW North Region: 17.18GW South Region: 20.22GW 19
  • 20. Source: MISO Information Delivery and Market Analysis Department *Based on 5-minute unit level generation dispatch target Dispatched Generation Fuel Mix by Region 20 67.6% 50.4% 15.3% 67.8% 49.0% 10.5% 13.7% 12.3% 26.4% 15.7% 9.9% 31.2% 14.7% 7.2% 53.9% 11.4% 7.1% 52.5% 3.3% 28.0% 3.7% 31.4% 4.3% 5.8% 0.0% 20.0% 40.0% 60.0% 80.0% 100.0% 120.0% Central Region North Region South Region Central Region North Region South Region Mar-2015 Apr-2015 Coal(%) Nuclear(%) Gas(%) Wind(%) Other(%)
  • 21. Generation Outages by Region Source: MISO CROW Outage Scheduler * Forced Outages include Emergency, Forced, and Urgent * Planned Outages include Planned *De-rates are based on limits observed in Real-Time and may reflect normal seasonal de-rates in addition to de-rates for maintenance or other operating conditions. Outages extracted on May 01, 2015 Data includes both MISO market and reliability footprints. Outage data is “point in time” and can change. The chart reflects the data as it resided in the system on the date of extraction. 21 0 2 4 6 8 10 12 14 16 18 Central Region North Region South Region Central Region North Region South Region Mar-2015 Apr-2015 GW Daily Average Generation Outages and Derates - Reliability Footprint Forced Planned Derates
  • 22. Source: The Web-based Revenue Sufficiency Guarantee Report Revenue Sufficiency Guarantee by Regions *DA_RSG_VLR% is the ratio of DA RSG associated with VLR commitments to the total DA RSG MWP. *RT_RSG_Txx% is the ratio of RT RSG associated with congestion mitigation to the total RT RSG MWP. Date of Extraction: May 5, 2015. Values may change due to resettlement. 22 0% 10% 20% 30% 40% 50% 60% 70% 80% $0.00 $2.00 $4.00 $6.00 $8.00 $10.00 Central Region North Region South Region Apr-2015 Millions DA RSG & DA RSG Associated with VLR Total DA RSG MWP DA RSG Associated with VLR Commitments DA_RSG_VLR%* 0% 5% 10% 15% 20% 25% 30% 35% 40% $0.00 $2.00 $4.00 $6.00 $8.00 $10.00 Central Region North Region South Region Apr-2015 Millions RT RSG & RT RSG Associated with Congestion Mitigation RT RSG MWP RT RSG Associated with Congestion Mitigation RT_RSG_Txx%*
  • 23. Reliability – Manual Re-dispatches and TLR by Region Transmission Loading Relief (TLR) Events (Count) Levels: 3 – curtailing non-firm 4 – curtailing non-firm and reconfiguring 5 – curtailing firm 6 – emergency Manual Redispatches (Count) Source: MISO Real-Time Operations Department TLR – April 2015 Notifications – April 2015 • 04/08/15 15:38-23:00 EST: Severe Weather Alert for areas in the Central Region, due to Tornado Warnings. • 04/09/15 01:00-02:30 EST: System Status Level 1 YELLOW due to network issues affecting M2M, ARS, MCS and the portal. • 04/09/15 19:30 EST to 04/10/2015 03:00 EST: Severe Weather Alert for MISO footprint due to a long line of severe thunderstorms including tornado watches and warnings. • 04/27/15: 05:50 – 14:00 EST Severe Weather Alert issued for southern Louisiana and southern Mississippi areas due to heavy storms, tornadoes, damaging wind and hail. • 04/27/15: 10:10 – 14:00 EST Conservative Operations issued for EES, CLEC, LAFA, LEPA, SME due to multiple forced transmission outages. 0 Firm MWh Curtailed 23,518 Non-Firm MWh Curtailed 23 0 0 0 4 2 00 0 0 0 0 00 0 0 0 0 0 Central Region North Region South Region Central Region North Region South Region Mar-2015 Apr-2015 Level 3&4 Level 5 Level 6 3 25 8 2 10 17 49 Central Region North Region South Region Central Region North Region South Region MISO Mar-2015 Apr-2015 2014 AVG # Number of Manual Redispatch
  • 24. Transmission Service and Generation Interconnection Request by Region Long-term Firm Transmission Service Queue Source: MISO Transmission Planning Department Generation Interconnect Queue Number of Requests April 2015 Note: The regions are determined based on POINT_OF_RECEIPT. 24 0 5 10 15 20 25 30 35 40 Central Region North Region South Region Apr-2015 # of Requests in Study 0 4 8 12 Central Region North Region South Region Apr-2015 # of Requests Processed 0 5,000 10,000 15,000 20,000 25,000 30,000 Central Region North Region South Region Apr-2015 MW Size of Queue( MW) -Total 0 200 400 600 800 1,000 1,200 1,400 Central Region North Region South Region Apr-2015 MW Size of Queue( MW) -New Size of Queue (MW) - Resolved Region Total New Resolved Central 83 0 4 North 55 2 1 South 22 0 1
  • 25. Transmission Service and Generation Interconnection Request by Region Long-term Firm Transmission Service Queue Generation Interconnect Queue Number of Requests February 2015 Note: The regions are determined based on POINT_OF_RECEIPT. 25 0 5 10 15 20 25 30 35 Central Region North Region South Region Feb-2015 # of Requests in Study 0 4 8 12 16 20 24 Central Region North Region South Region Feb-2015 # of Requests Processed 0 5,000 10,000 15,000 20,000 25,000 30,000 Central Region North Region South Region Feb-2015 MW Size of Queue( MW) -Total 0 100 200 300 400 500 600 700 Central Region North Region South Region Feb-2015 MW Size of Queue( MW) -New Size of Queue (MW) - Resolved Region Total New Resolved Central 89 0 3 North 51 0 0 South 25 0 1

Editor's Notes

  1. Copy Day_Ahead and Real_Time data from Monthly_Assessment_Data.xlsx > SEC0_System_Wide_Monthly_Avg tab to above chart.
  2. For bottom chart, copy percent_dev data from Monthly_Assessment_Data.xlsx > SEC0_System_Wide_Monthly_Avg tab to above chart. For top chart, copy Average_DA_RT_Difference and AverageAbsolute_DA_RT_difference data to chart.
  3. For top chart, copy DATA from Monthly_Assessment_Data.xlsx > SEC1_HUB_LMPS tab to above chart. For bottom table, copy table from OPS_HUB_MCC tab
  4. Copy from PriceDuration_OPS_CHARTS.xls > Peak chart tab. Make sure that data in PEAK_GRAPH table contains the proper number of rows. Different months have different # of days. Change months in top row of PEAK_GRAPH. Legend in upper right comes from Table tab.
  5. Copy from PriceDuration_OPS_CHARTS.xls > OffPeak chart tab. Make sure that data in OFFPEAK_GRAPH table contains the proper number of rows. Different months have different # of days. Change months in top row of OFFPEAK_GRAPH. Legend in upper right comes from Table tab.
  6. I:\Shared\Market Data Team\Monthly Operations Report\2015 Normalized_Congestion_Rent_Monthly_3_2015.csv DA_CONGESTION_RENT/1E6 NORMALIZED_DA_CONGESTION_RENT
  7. Update 0.FUEL_PRICES.xlsx. 0. Update PPI tab. Follow web link on that tab and find PPI for All Commodities. Update top two tables. Bottom table is calculated. 1. For Natural Gas, make sure Tom Welch has updated database. Use Netezza queries (saved in Queries folder) to get Henry Hub and Chicago Citygate volume-weighted averages. 2. Coal prices (Illinois basin) can be found using web link on top of Coal tab. Paste price table to left side, compute monthly averages, and insert into spreadsheet and normalize. Update ranges & title for all the graphs. 3. Oil prices come from Jeff in e-mail. Follow similar procedure.
  8. Settlements Data not final until the 7th or 8th. For top: Monthly_Reporting.xlsx: FTR_CHART_DATA For bottom: FTR Rolling 12-month percentage calculations can be found in the Monthly FTRWG meeting materials. Update Market Analysis Management\Reports\Regular Reports\Monthly Operations Report\4. April 2015\FTR_Rolling12month_April.xlsx
  9. Get data from I:\Shared\Market Data Team\Monthly Operations Report\YYYY\mm-yyyy\ Unit_EconMax_Data_M_yyyy.csv OfferedGen_SEMW_RT_M_yyyy.csv Update spreadsheet in EXTRAS folder: 0.OfferedGen_SEMW_CALCS.xls 0.OFFERED_CAPACITY_CHART.xls Also need NSI data and peak-load data that are e-mailed
  10. Monthly_Reporting.xls > MARGINAL_FUEL tab. Copy data from top of spreadsheet into this chart. Need to transpose data & multiply by 100…
  11. Create output input data following section 6 of “Monthly Report Automation Program Input Preparation Procedure” Run 8.GenerationAndTransmissionOutages_v5.sas Copy current month data from OUTAGES.xlsx > MONTHLY_OUTAGES tab to chart Update extraction date above.
  12. Update using “MMM Operations Data” e-mail from Mickey Headds. Sample e-mail data: Minimum Generation Emergency Declarations – NONE Maximum Generation Emergency Declarations – NONE Manual Re-dispatches – 36 (Central: 3, South: 8, North: 25) Tie Line Error (the number of events when the 15min avg tie line error exceeded +/- 1000MW) – NONE Unit Commitment Efficiency –March score was 96.0%.  YTD average is 97.78%
  13. TLR Data from Monthly Operations Report for April, 2015 e-mail from Nicholas Krebsbach. ACE data from “MM YYYY-ACE and CPS2.xlsx” spreadsheet attached to “ACE and CPS2 report for MM YYYY” e-mail from Nina Zheng. Need to compute AVERAGE and STDEVA on ACE data. Also put in 0.YTD_CALC_2015.xls Update two charts using “MMM Operations Data” e-mail from Mickey Headds. Sample e-mail data: Manual Re-dispatches – 36 (Central: 3, South: 8, North: 25) Unit Commitment Efficiency –March score was 96.0%.  YTD average is 97.78% ARS (Contingency Reserve Sharing) from Bob Klueber e-mail.
  14. Bar/line chart on left uses last row data from top table in “MM YYYY Report_GI-and-TSR_YYYYMMDD.xlsx” spreadsheet Pie chart uses “New Pie Chart” table in spreadsheet.
  15. Attachment Y spreadsheet (last sent by Radha Sooryavarm). Filter: Alt Y Type = Y Status = Under Study
  16. From Regional_Report_Data.xlsx > HUB_LMPS
  17. Use input/MISO_LMPS.csv for MISO & PJM data. MISO_DA_HUB and MISO_RT_HUB columns. Must run input/0.MISO_LMPS.sas to generate this data PJM Chicago Hub = ComEd. SPP data put together by Seyi. Gets data from SPP FTP site (https://xfer.spp.or), and then uses SAS to create results. Working directory is Z:\Users\oakinbode\SPP
  18. From Regional_Report_Data.xlsx > MCP_ZONE
  19. From Regional_Report_Data.xlsx > load_region Peak load hour data at top: 1. Find out peak load day/hour from Patti/Tag spreadsheet 2. Go to MISO Market Reports [https://www.misoenergy.org/RTDisplays/MKTRPT/AllReportsList.html?rptName=Daily Regional Forecast and Actual Load (xls)] and find report dated for the NEXT day. 3. Copy data
  20. From Regional_Report_Data.xlsx > Generationby_fuel_by_region (must manually update data in this table first)
  21. From Regional_Report_Data.xlsx > Outage By Region tab (must manually update data in table first)
  22. From Regional_Report_Data.xlsx > RSG BY REGION Make sure to run INPUT/VLRQuery.sql and update RSG_VLR_INPUT.xlsx before running the regional SAS code.
  23. Update top chart using “MMM Operations Data” e-mail from Mickey Headds. Sample e-mail data: Manual Re-dispatches – 36 (Central: 3, South: 8, North: 25) Update Regional_Report_Data.xlsx > TLR by Region tab, and copy chart TLR Data from Monthly Operations Report for April, 2015 e-mail from Nicholas Krebsbach. Put in Regional_Report_Data.xlsx > TLR by Region tab
  24. Use By_Region tab of “MM YYYY Report_GI-and-TSR_M-D-YY.xlsx”. Update yellow sections of Regional_Report_Data.xlsx > TSR by Region tab Paste pictures into this document.