
Recommended
Recommended
More Related Content
Similar to Income statement Income Statements for Disney Corporation year end
Similar to Income statement Income Statements for Disney Corporation year end (20)
More from LizbethQuinonez813
More from LizbethQuinonez813 (20)
Recently uploaded
Recently uploaded (20)
Income statement Income Statements for Disney Corporation year end
- 1. Income statement Income Statements for Disney Corporation year ending on 2020 20202019Revenue65,388.0069,607.00Cost of goods sold43,880.0042,061.00gross profit 21,508.0027,546.00Research and development expenses- 0- 0SG&A Expenses12,369.0011,549.00other operating income or expenses- 0- 0operating Expenses67,329.0058,960.00operating Income(1,941.00)10,647.00Total Non-Operating Income/Expenses198.003,276.00Pre-tax Income(1,743.00)13,923.00Income taxes699.003,026.00Income After taxes(2,442.00)10,897.00Other Income- 0- 0Income From Continuos Operations(2,442.00)10,897.00Income From Discontinued Operations(32.00)687.00Net Income(2,864.00)11,054.00EBITDA8,357.0014,814.00EBIT(1,9 41.00)10,647.00Basic shares Outstanding1,808.001,656.00Shares Outstanding1,808.001,666.00Basic EPS(1.58)6.68EPS- Earnings per share (1.58)6.64Graphical representetion 2020Graphical representetion 2019 Revenue gross profit operating Income Pre-tax Income Income taxes Income After taxes EBITDA 65388 21508 -1941 -1743 699 -2442 8357 Revenue gross profit operating Income Pre-tax Income Income taxes Income After taxes Net Income EBITDA 69607 27546 10647 13923 3026 10897 11054 14814 Balance sheetBalance sheets of Disney Corporation for the year ending 2020 20202019ItemsCash on hand$ 17,914.005,418.00Receivable$ 12,708.0015,481.00Inventory $ 1,583.001,649.00Pre-paid expenses$ - 0- 0Other current assets$ 875.00979.00Total current assets$ 35,251.0028,124.00Property, plant and equipment$ 26,594.0026,174.00Longterm investment $
- 2. 3,903.003,224.00Goodwill and intangible assets$ 96,862.00103,508.00Other long-term assets$ 8,433.004,715.00Total long-term assets$ 166,298.00165,860.00Total assets$ 201,549.00193,984.00Total current liabilities$ 26,628.0031,341.00longterm Debt$ 52,917.0038,129.00Other Non-Current Liabilities$ 17,204.0013,760.00Total long term liabilities$ 86,658.0068,754.00Total liabilities$ 113,286.00100,095.00Common Stock Net $ 54,497.0053,907.00Retained Earnings (Accumulated Deficit)$ 38,315.0042,494.00Comprehensive income$ (8,322.00)(6,617.00)Other Share Hol;ders Equity$ - 0- 0Share holder Equity$ 88,263.0093,889.00Total Liabilities and Share Holders Equity$ 201,549.00193,984.00Graphical Representetion 2020Graphical representetion 2019 Total current assets Total assets Total current liabilities Total liabilities Share holder Equity Total Liabilities and Share Holders Equity 35251 201549 26628 113286 88263 201549 Total current assets Total assets Total current liabilities Total liabilities Share holder Equity Total Liabilities and Share Holders Equity 28124 193984 3134 1 100095 93889 193984 Cashflow statementCashflow statements of Disney Corporation for the year ending 2020 ITEMS20202019Net IncomeLoss(2,442.00)10,897.00Total depreciation and amortization- Cash flow10,298.004,167.00Other Non-Cash Items(633.00)(3,048.00)Total Non-Cash Items9,665.001,119.00Change in accounts Receivable1,943.0055.00Change in Inventories14.00(223.00)Change in accounts payable- 0- 0Change in assets/Liabilities240.00390.00Total change in Assets/Liabilites(248.00)(6,186.00)Cash flow from operating activites7,616.005,984.00Net change in property, plant and
- 3. Equipment(4,022.00)(4,876.00)Net change in intangible Assets - 0- 0Net acquisation/Divestitures- 0(9,901.00)Net change in short-term Investments- 0- 0Net change in long-term investments - 0- 0Net Change in investments- Total- 0- 0Investing Activities- Other172.00(319.00)Cash Flow From Investing Activities (3,850.00)(15,096.00)Net Long-term Debt14,587.00(641.00)Net Current Debt(3,354.00)4,318.00Debt issuanceRetirement Net -Total11,233.003,677.00Net common equity issued/repurchased305.00318.00Net Total Equity issued repurchased305.00318.00Total common and preferred stock dividends paid(1,587.00)(2,895.00)Financial activities- other(1,471.00)(1,564.00)Cash Flow from financial activities8,480.00(464.00)Net Cash Flow12,499.001,300.00Stock-Based compensation525.00711.00Common stock dividends paid (1,587.00)(2,895.00)Graphical representetion 2020Graphical representetion 2019 Cash flow from operating activites Cash Flow From Investing Activities Cash Flow from financial activities Net Cash Flow 5984 -15096 -464 1300 Cash flow from operating activites Cash Flow From Investing Activities Cash Flow from financial activities Net Cash Flow 7616 -3850 8480 12499 Financial ratioProfitability RatioReturn on assets (ROA)20202019-0.0142099440.0569840812Return on Equity20202019-0.03244847780.1177347719Liquidity ratioQuick Ratio20202019(1,382.95)1,308.61Day’s sales outstanding 202020191.260.84E.) Long-term solvency ratiosDebt to equity ratio202020191.28350497941.0660993301Debt to asset ratio202020190.56207671580.5159961646 Efficiency/Valuation ratios:Accounts receivable turnover ratio202020195.14542020774.4962857697Asset turnover
- 4. ratio202020193.70985220284.9500071114Leverage ratios:Current ratio202020191.32383205650.8973549025Time Interest earned ratioEBIT/ Interest expense20202019- 2.49356223184.6011235955 Write a 250-word essay for each question below. Sources and data are required for each essay. ESSAY QUESTIONS Question 1 Essay. How has the Internet altered the way in which newspapers present news? How are print newspapers responding to the decline of subscribers and the rise of online readers? Support your discussion with reliable sources. Sources: https://www.pewresearch.org/journalism/fact- sheet/newspapers/ https://open.lib.umn.edu/mediaandculture/chapter/4-5-current- popular-trends-in-the-newspaper-industry/ <Type your answer here> Question 3 Essay. How has "fake news" come to exist and spread so rapidly? Why do you think this happens? How is "fake news" harmful? What are the long- and short-term effects and consequences of being a consumer of "fake news"? How does it affect each of us? How can we, as consumers and sharers of news, learn to identify potential "fake news" stories? Support your discussion with reliable sources. Sources: https://www-sciencedirect- com.ezproxy.umgc.edu/science/article/pii/S0191886921006486? via%3Dihub https://doaj.org/article/636db73a56ba49ef9e1530b4b7d842e7
- 5. https://www-sciencedirect- com.ezproxy.umgc.edu/science/article/pii/S0099133321000811? via%3Dihub <Type your answer here> Question 5 Essay. How has Digital Media influenced (or changed) children of this generation? How are their lives different than ours? Include a historical (before and after the digital media) and global perspective (include discussion of the US and at least two additional countries). Include whether the change has been positive, negative, or both. Support your discussion with reliable sources. https://www-sciencedirect- com.ezproxy.umgc.edu/science/article/pii/S0828282X20304001 ?via%3Dihub https://www.npr.org/sections/health- shots/2013/11/20/246316731/kids-are-less-fit-today-than-you- were-back-then <Type your answer here> Question 8 Essay. Discuss how social media was used in the 2016 U.S. Presidential Election in terms of communicating with voters, fundraising, and campaign organizing. Discuss how databases of political information can be used to help voters make decisions on candidates and issues. Support your discussion with reliable sources. https://academic.oup.com/poq/article/84/S1/236/5871904?login =true https://www.pewresearch.org/fact-tank/2018/02/15/voter-files- study-qa/
- 6. <Type your answer here> Balance SheetPowered by ClearbitDisney (Walt) Co. (The) (NYS: DIS)Exchange rate used is that of the Year End reported date As Reported Quarterly Balance Sheet Report Date07/03/202104/03/202101/02/202106/27/202003/28/202012/ 28/201906/29/201903/30/201912/29/20183rd Quarter2nd Quarter1st Quarter3rd Quarter2nd Quarter1st Quarter3rd Quarter2nd Quarter1st QuarterCurrencyUSDUSDUSDUSDUSDUSDUSDUSDUSDAudi t StatusUnauditedUnauditedUnauditedUnauditedUnauditedUnaudi tedUnauditedUnauditedUnauditedConsolidatedYesYesYesYesY esYesYesYesYesScaleThousandsThousandsThousandsThousand sThousandsThousandsThousandsThousandsThousandsCash & cash equivalents1607000015890000170680002311500014339000683 30006728000101080004455000Receivables13355000125330001 40510001262200014532000171000001567300014593000101230 00Inventories13440001406000148000015590001531000157100 0151600014450001357000Licensed content costs & advances236700022040001423000313500018690001334000452 60005408000824000Other current assets830000844000852000899000100300093800010350001257 000778000Assets held for sale------18920001466000-Total current assets339660003287700034874000413300003327400027776000 313700003427700017537000Produced & licensed content costs278890002685800025929000255600002675700026539000 22552000243530008177000Investments40450004309000403700 0361100031800003312000387200040800002970000Attractions, buildings & equipment64023000630370006301700061130000609290005991 0000574570005799100055385000Accumulated depreciation -
- 7. attractions, buildings & equipment37579000368660003638000034639000337130 003305 7000320880003313200031069000Parks, resorts & other property before projects in progress & land, Total264440002617100026637000264910002721600026853000 253690002485900024316000Projects in progress4856000489100045470004380000391600040230004853 00049840004336000Land1077000107500010790001020000101 90001019000117000011740001145000Parks, resorts & other property, net32377000321370003226300031891000321510003189500031 3920003101700029797000Intangible assets, net17601000181230001864200019589000220370002266900025 114000269850006747000Goodwill778350007786100077800000 772330008032000080314000778010007505700031289000Nonc urrent assets held for sale------1259100013182000-Other assets850800080850008343000843500085750008443000478300 053910003424000Total assets202221000200250000201888000207649000206294000200 94800020947500021434200099941000Accounts payable & other accrued liabilities183170001706200016846000169860001790600019755 000176470002050300010696000Current portion of borrowings4728000524300053970001022400012676000100180 0021923000191580003489000Deferred revenue & other current liabilities436800043370004303000370700048910005024000473 000042810003434000Liabilities held for sale------ 293000434000-Total current liabilities274130002664200026546000309170003547300034797 000445930004437600017619000Commercial paper borrowings- ---84830006534000--699000U.S. & European medium-term notes--------17947000U.S. dollar denominated notes---- 4428900039380000---Asia International Theme Parks borrowings--------1160000Asia Theme Parks borrowings---- 11850001146000---Foreign currency denominated debt & other borrowings----14890001015000--859000Total borrowings
- 8. before current portion----5544600048075000--20665000Less: current portion of borrowings----1267600010018000-- 3489000Borrowings511100005090300052878000541970004277 000038057000363110003780300017176000Deferred income taxes683500068940007201000705500079650008364000104040 00112080003177000Noncurrent liabilities held for sale------ 23530002659000-Other long-term liabilities162490001661500017205000158550001611300015928 00010561000128540006452000Redeemable noncontrolling interests9492000941000093300009162000909600090290008897 00011030001124000Common stock551740005500000054663000543860005423000053995000 537180005341900036799000Retained earnings (accumulated deficit)40311000393650003845600039004000437210004320200 0413820004121200084887000Market value adjustments for investments----6000---1000-4000-Market value adjustments for hedges-213000--324000-122000-70003300048000128000Market value adjustments--214000-------Unrecognized pension & postretirement medical expense-6712000-6881000-7072000- 5469000-5566000-5639000-3155000-3179000-3247000Foreign currency translation & other accumulated comprehensive income (loss)-912000-823000-745000-1142000-1193000- 887000-598000-651000-663000Accumulated other comprehensive income (loss)-7837000-7918000-8141000- 6617000-6637000-6533000-3721000-3786000- 3782000Shareholders' equity sub-total------- 90845000117904000Treasury stock, at cost9070009070009070009070009070009070009070009070006 7588000Total disney shareholders' equity86741000855400008407100085866000904070008975700 0904720008993800050316000Noncontrolling interests4381000424600046570004597000447000050160005884 000144010004077000Total equity91122000897860008872800090463000948770009477300 09635600010433900054393000 Income StatementPowered by ClearbitDisney (Walt) Co. (The)
- 9. (NYS: DIS)Exchange rate used is that of the Year End reported date As Reported Quarterly Income Statement Report Date07/03/202104/03/202101/02/202106/27/202003/28/202012/ 28/201906/29/201903/30/201912/29/20183rd Quarter2nd Quarter1st Quarter3rd Quarter2nd Quarter1st Quarter3rd Quarter2nd Quarter1st QuarterCurrencyUSDUSDUSDUSDUSDUSDUSDUSDUSDAudi t StatusUnauditedUnauditedUnauditedUnauditedUnauditedUnaudi tedUnauditedUnauditedUnaudi tedConsolidatedYesYesYesYesY esYesYesYesYesScaleThousandsThousandsThousandsThousand sThousandsThousandsThousandsThousandsThousandsServices revenues155850001452200014871000112350001617400018075 000180220001300600012866000Products revenues143700010910001378000544000183500027830002223 00019160002437000Total revenues170220001561300016249000117790001800900020858 000202450001492200015303000Cost of services (exclusive of depreciation & amortization)102510008932000107380007209000106640001137 70001144500071670007564000Cost of products (exclusive of depreciation & amortization)982000850000103700068700012540001639000137 400012090001437000Selling, general, administrative & other expenses316800031130002917000245500033880003703000336 200023270002152000Depreciation & amortization126600012720001298000137700013330001298000 1304000828000732000Total costs & expenses-15667000- 14167000-15990000117280001663900018017000- 1748500011531000-11885000Restructuring & impairment charges-------662000-Restructuring & impairment charges350004140001130005047000145000150000207000-- DraftKings, Inc. gain (loss)-217000--------German free-to-air (FTA) television network gain (loss)126000--------Other income (expense), net-91000305000-382000---123000--Other income--- ----4963000-Interest
- 10. expense4040004150004040004560003650003620004720001980 00163000Interest & investment income-9000131000- 4100063000-340003000075000Net periodic pension & postretirement benefit costs (other than service costs) -32000- 36000-30002000-270002500025000Interest income, investment income & other interest income (expense)--80000--79000--- Interest income (expense), net-445000-320000-324000-412000- 300000-283000-411000-143000-63000Equity in the income (loss) of investees211000213000224000186000135000224000- 1000-31200076000Income from continuing operations before income taxes995000123000046000- 484000010600002632000201800072370003431000Income taxes from continuing operations-13300010800016000- 3310005250004590003950001647000645000Net income (loss) from continuing operations1128000112200030000- 4509000535000217300016230005590000-Income (loss) from discontinued operations, net -5000-11000-12000-3000-15000- 2600035900021000-Net income (loss)1123000111100018000- 45120005200002147000198200056110002786000Net income (loss) from continuing operations attributable to noncontrolling interests-205000-210000-1000-209000-60000-40000-- 1590002000Less: net income from continuing operations attributable to noncontrolling & redeemable noncontrolling interests-------186000--Less: net income from discontinued operations attributable to noncontrolling interests-------36000-- Net income (loss) attributable to The Walt Disney Company (Disney)91800090100017000- 47210004600002107000176000054520002788000Weighted average shares outstanding - basic181800018170001812000180900018080001805000180200 015300001490000Weighted average shares outstanding - diluted18300001829000182300018090001816000181700018140 0015370001498000Year end shares outstanding1781000178100017810001781000178100017810001 78100017790001500000Earnings (loss) per share - continuing operations - basic0.510.50.02-2.610.261.180.83.55-Earnings
- 11. (loss) per share - discontinued operations - basic--0.01-0.01-- 0.01-0.010.180.01-Net earnings (loss) per share - basic0.50.50.01-2.610.251.170.983.561.87Earnings (loss) per share - continuing operations - diluted0.50.50.02- 2.610.261.170.793.53-Earnings (loss) per share - discontinued operations - diluted--0.01-0.01--0.01-0.010.180.01-Net earnings (loss) per share - diluted0.50.490.01- 2.610.251.160.973.551.86Dividends declared per common share---0.880.880.880.88-0.88 Cash FlowPowered by ClearbitDisney (Walt) Co. (The) (NYS: DIS)Exchange rate used is that of the Year End reported date As Reported Quarterly Cash Flow Report Date07/03/202104/03/202101/02/202106/27/202003/28/202012/ 28/201906/29/201903/30/201912/29/20183rd Quarter2nd Quarter1st Quarter3rd Quarter2nd Quarter1st Quarter3rd Quarter2nd Quarter1st QuarterCurrencyUSDUSDUSDUSDUSDUSDUSDUSDUSDAudi t StatusUnauditedUnauditedUnauditedUnauditedUnauditedUnaudi tedUnauditedUnauditedUnauditedConsolidatedYesYesYesYesY esYesYesYesYesScaleThousandsThousandsThousandsThousand sThousandsThousandsThousandsThousandsThousandsNet income (loss)--------2786000Net income (loss) from continuing operations2280000115200030000- 18130002708000217300099990008376000-Depreciation & amortization383600025700001298000401000026310001298000 28640001560000732000Net gain/(loss) on investments-- 481000-80000------Goodwill & intangible asset impairment--- 4953000-----Net loss (gain) on investments-325000--------Net loss (gain) on acquisitions & investments----370000-----Loss (gain) on acquisition-------4794000-4917000-Deferred income taxes-749000-556000-105000- 5480002970005340001716000119000046000Equity in the loss (income) of investees-648000-437000-224000-545000-359000- 224000234000236000-76000Cash distributions received from equity
- 12. investees546000372000193000567000405000219000548000370 000170000Net change in produced & licensed content costs & advances-3192000-1685000771000-1483000-925000- 7700059000-281000468000Net change in operating lease right of use assets / liabilities1270001460003600016000-96000---- Equity-based compensation42800027000013400038800024600011500059100 047500092000Other adjustments, net72800049000090000471000156000650001520001210006100 0Receivables-301000-37000-13240002100000828000-1424000- 1428000-386000- 1078000Inventories23600017500094000860007000081000- 96000-1900032000Other assets-113000-131000-1360008000- 174000-330004500004600025000Accounts payable & other accrued liabilities---------1289000Accounts payable & other liabilities341000-780000-642000-1986000-888000- 841000219000-283000-Income taxes-260000400000- 6000095000-112000-256000-6248000-474000130000Net cash flows from operations - continuing operations--- 59490004787000-4266000--Net cash flows from operating activities29340001468000750005949000- 1630000426600060140002099000Investments in parks, resorts & other property-2468000-1530000-760000-3293000-2585000- 1338000-3567000-2390000-1195000Acquisitions-------9901000- 9901000-Other investing activities38300020300028000-27000- 21000-12000-317000-392000-141000Net cash flows from (used in) investing activities - continuing operations----3320000- 2606000--13785000--Net cash flows from investing activities- 2085000-1327000-732000-3320000--1350000-13785000- 12683000-1336000Commercial paper borrowings/(payments), net-99000-87000- 1790001373000313800011720002973000376000- 302000Borrowings4300037000100018030000607100051000313 4800031145000-Reduction of borrowings-2319000-1816000- 139000-2297000-1048000-46000-19039000-17398000- Dividends----1587000-1587000--1310000-1310000-Proceeds
- 13. from exercise of stock options40500039400020900023800020700012600027800083000 37000Acquisition of noncontrolling & redeemable noncontrolling interests-------1430000--Contributions from or sales of noncontrolling interests------544000--Other financing activities-801000-769000-225000-838000-165000-186000- 831000-200000-146000Net cash flows from financing activities - continuing operations---149190006616000-12533000--Net cash flows from financing activities-2771000-2241000- 33300014919000-11170001253300012696000-411000Cash flows from operating activities of discontinued operations- 20004000-20004000-320000--Cash flows from financing activities of discontinued operations-------179000--Cash flows from investing activities of discontinued operations80004000- 198000198000----Cash flows from operations - discontinued operations600080009000200000202000-19000141000-35000- Impact of exchange rates on cash, cash equivalents & restricted cash7700070000139000-49000-76000410004700075000- 44000Change in cash, cash equivalents & restricted cash- 1839000-2022000- 842000176990008923000141900032020006067000308000Cash, cash equivalents & restricted cash, beginning of period17954000179540001795400054550005455000545500041 5500041550004155000Cash, cash equivalents & restricted cash, end of period16115000159320001711200023154000143780006874000 7357000102220004463000 FIN 320 Project Two Financial Analyst Report [Note: To complete this template, replace the bracketed text with your own content. Remove this note before you submit your report.] Financial Analysis, Financial Evaluation, and Financial
- 14. Recommendation(s) Financial Analysis Financial Calculations: Using the most current quarter’s financial statements for your chosen business and the Financial Formulas spreadsheet, calculate the financial formulas below to assess the business’s financial health. Working capital: [Write the result of the calculation and what it says about the company’s health.] Current ratio: [Write the result of the calculation and what it says about the company’s health.] Debt ratio: [Write the result of the calculation and what it says about the company’s health.] Earnings per share: [Write the result of the calculation and what it says about the company’s health.] Price/earnings ratio: [Write the result of the calculation and what it says about the company’s health.] Total asset turnover ratio: [Write the result of the calculation and what it says about the company’s health.] Financial leverage: [Write the result of the calculation and what it says about the company’s health.] Net profit margin: [Write the result of the calculation and what it says about the company’s health.] Return on assets:
- 15. [Write the result of the calculation and what it says about the company’s health.] Return on equity: [Write the result of the calculation and what it says about the company’s health.] Working Capital Management: [In one paragraph, explain the impact of working capital management on the business’s operations. Provide examples to support your claims.] Bond Investment: [In one paragraph, analyze the risks and benefits of the business choosing to invest in a corporate bond, including the necessary ethical considerations, appropriate calculations, and examples to support your analysis.] Capital Equipment: [In one paragraph, analyze the risks and benefits of the business choosing to invest in capital equipment, including the necessary ethical considerations, appropriate calculations, and examples to support your analysis.] Capital Lease: [In one paragraph, analyze the risks and benefits of the business choosing to purchase a capital lease, including the necessary ethical considerations, appropriate calculations, and examples to support your analysis.] Financial Evaluation In this section of the report, you will evaluate the three available financial options for the business and recommend which option(s) are the best for the business to choose. 1. Financing:
- 16. [In one paragraph, explain how a business finances its operations and expansion.] Bond Investment: [In one paragraph, write your assessment on the appropriateness of a bond investment as an option for the business’s financial health, using your financial analysis and other financial information to support your claims.] Capital Equipment: [In one paragraph, write your assessment on the appropriateness of a capital equipment investment as an option for the business’s financial health, using your financial analysis and other financial information to support your claims.] Capital Lease: [In one paragraph, write your assessment on the appropriateness of a capital lease purchase as an investment option for the business’s financial health, using your financial analysis and other financial information to support your claims.] Short-Term Financing: [In one paragraph, explain how potential short-term financing sources could help the business raise needed funds for improving its financial health. Base your response on the business’s current financial information.] Future Financial Considerations: [In one paragraph, describe the business’s likely future financial performance based on its current financial well-being and risk level. Use financial information to support your claims.] Financial Recommendation(s) [In 1 to 2 paragraphs, recommend the most appropriate financing option(s) based on the business’s financial health, and include a rationale for why the option(s) are the best.]
- 17. 3 Running Head: Financial review for Disney Corporation 1 Financial review for Disney Corporation 2 Financial review for Disney Corporation Name Institution Affiliation Date Introduction Financial review can be described as a fundamental aspect applied in determining long-term sustainability pentagram. This process is characterized by profound in-depth analysis of the information presented in financial statements of business entities to provide skeptical judgment applied to evaluate short- term and long-term durable competitive advantage. According to the information provided by (Guerard, 2013) Disney Inc.Com is a world class film, theme park resort, television shows and business entity which offer entertainment content intended for children and families. Over the recent past, this entity has been highlighted to have intensified its populism leading to heighted profitability yield. Disney Inc.Com can be described to be a faultless case scenario based on its precise operational pentagram that is undergoing significant modification in terms of organizational structure, quality product production, market investment portfolio, organizational ethnicity and radical update of its advertisement and customer outreach measures based on postulated customer
- 18. competitive pressure. This is a business that nurtured extremely fast within a little time span. Thus, its management found themselves not being able to cling to their procedures and finances under control. However, the Disney Inc.Com almost faced insolvency. Therefore, the company had to re-evaluate and restructure its organizational principles and organizational configuration to avoid bankruptcy. The organizational culture embraces change; with the motive to outperform and be successful as its fundamental objectives (Dyer, Furr, & Lefrandt, 2019), acknowledges. Financial statement analysis Review of financial statement can be described as a fundamental aspect in determining the certainty of short-term and long-term operability pentagram. Consequently, critical scrutiny of financial review is also a significant step in healthcare vender as it aids in planning and determining the going concern concept based on the estimated profitable yield earned from patients. Going concern is the ability of Disney Inc.Com to sustain its operating in the future despite of the stiff competition which emerges in the market amongst other systematic and unsystematic risk occurrences. The information provided by (Davidson, 2018), provides further insight on financial review as the process of determining potential credit risk based on financial rationales. This process of financial reviewing provides decisive information to investors, shareholders, owners, general public and the government as it aids in determining whether the business venture has the financial ability to meet the expected financial obligations on short run and long run basis. However, in terms of planning and expansion, the financial statement review based on the information provided in the spreadsheet analysis aid in drafting the leeway of generating more capital and minimize expenditures based on financial forecasting heightened through ratio analysis.
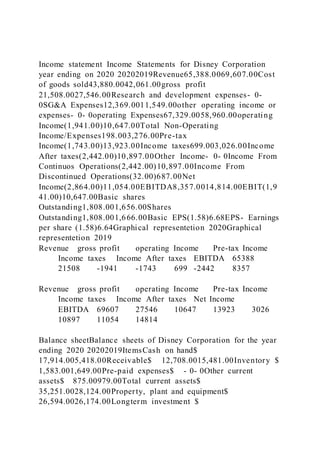
- 19. Graphical representations of Balance sheet for the year end 2020 Graphical representations of Balance sheet for the year end 2019 According to the information presented in the entities balance sheet computed on the basis of quantum strategy, the total assets have been indicated to maintain a positive growth variant from the financial year ending 2019 to the financial year ending on 2020. In addition, the total expected liability has been represented with a linear incline over the respective financial period indicating enhanced increase on debt rate. Debt increase can be classified as a negative variant based on long-term performance portfolio. Shareholders’ equity have been characterized by augmented positive growth over the respective financial period indicating a favorable operating margin based on short-term and long-term factor evaluation matrix. Cash flow statement graphical representation for the year end 2020 Cash flow statement graphical representation for the year end 2019 Cash flow statement can be described as the fundamental breakdown of the entities cash flow from operating activities, net cash flow from investing activities and net cash flow generated from financing activities. A well-defined decision making criterion is required while computing cash & cash equivalents based on the respective operational timeline to facilitate sustainable going concern. The information presented in (Macro trends, 2021) indicates the existence of a distinct performance benchmark regarding cash flow from operating
- 20. activities due to linear increase in growth over the last quantum financial periods. Concurringly, net cash flow from investing activities has increased since the financial year ending 2019 from $ 5,984 to $ 7,616 in the financial year ending 2020 a clear indication that Disney Inc.Com has heighted the investment portfolio in terms of long-term operational pentagram. The expected net cash flow from financing activities can be described to have also a favorable growth factor over the respective financial period having an increased positive factor from ($15,096) in the financial year 2019 to ($3,850) in the financial year ending 2020. This can be described to have a negative profitability impact on short-term performance pentagram and projected to have a positive long-term profitability impact on Disney Inc.Com investment portfolio chart, (Guerard, 2013). Income statement graphical representation for the year end 2020 Income statement graphical representation for the year end 2019 Income statement can be described as a critical representation of the entities revenue growth compared to the expected operational expenses and income taxes. According to the information presented in (Macro trends, 2021), the expected to cost of revue has been highlighted to have unfavorable negative growth rate over the respective period from the financial year 2019 with $ 69,607 to the financial year ending 2020 with $ 65,388. This indicates a favorable going concern concept and certain operability pentagram. The expected net income has also been indicated to have unfavorable growth proportion over this respective financial period from $11,054 in the financial year 2019 to $ (2,864) in the financial year ending 2020. Financial ratio analysis A profound efficiency analysis of Disney Inc.Com financial
- 21. health is enhanced through horizontal presentation of rationale which includes liquidity ratios, profitability ratio, efficiency ratio, long-term solvency ratio and financial leverage ratios. Profitability ratio which have been used to provide relevant insight on Disney Inc.Com financial strength include return on assets and return on equity. Based on (Guerard, 2013), profitability ratios highlight the ability of Disney Inc.Com to be able to generate profit despite of the expected financial expenditures and risk uncertainties. A negative variant portrayed by return on asset and return on equity which is less than 1 indicates unfavorable financial health based on short- term financial operability pentagram. Liquidity ratios can be describes the ability of Disney Inc.Com to meet its financial obligations and margin of long-term operability safety based on the available inventories. Precisely, quick ratio and the day’s sales outstanding have been computed to provide further insight on the debt coverage portfolio. Having a quick ratio of 1,308.61 in the financial year ending 2019 and (1,308.61) in the financial year ending 2020 is a clear indication that Disney Inc.Com has uncertain long-term debt coverage. Day’s sales outstanding have been computed to provide a detailed analysis of short-term payment range of debt. Having represented with this rationale which is greater than 1; it is a clear indication that the organization is unable to meet its short term obligations. Financial leverage ratios which have been applied to enhance a profound financial analysis of Disney Inc.Com include current ratio and time interest earned ratio. A positive favorable operational pentagram has been highlighted by the arithmetic computation of these proportions. Consequently, efficiency ratios have also been considered to highlight the effectiveness of Disney Inc.Com operational pentagram. This included the accounts receivable turnover ratio and the asset turnover ratio based on the expected total sales. Long-term solvency of Disney Inc.Com has also been indicated to be certain based on debt to equity ratio and debt to asset ratio. Long term solvency is based
- 22. on the total expected debts to be incurred compared to the entities equity and total assets. Having a debt to equity ratio of 1.076 for the financial year 2019 and debt to asset ratio of 1.28 in the same quarter is a clear indication that Disney Inc.Com has a certain long-term solvency rationale. Conclusion In summary, relevant application of internal factor evaluation matrix postulate effective integration of relevant analysis of financial performance of business entities. Disney Inc.Com has been highlighted to have a certain going concern despite of the increased competitive pressure and change in customer preference. A well-integrated supply chain management, application of quantum strategy and enhanced risk analysis portfolio has been indicated to be some of the key phenomenal which have enhanced profit maximization (Dyer, Furr, & Lefrandt, 2019). Reference list Dyer, J., Furr, N. R., & Lefrandt, C. T. (2019). Innovation capital: How to compete--and win--like the world's most innovative leaders. Davidson, W. N. (2018). Financial forecasting and decision making Place of publication not identified: JOHN WILEY. Guerard, J. (2013). Introduction to financial forecasting in investment analysis New York, NY: Springer. Macro trends, (2021). Disney Inc.Com – Stock Price History 2005-2021. Retrieved on 18th October 2021 From https://www.macrotrends.net/stocks/charts/DIS/disney/financial -statements
- 23. Cash flow from operating activites Cash Flow From Investing Activities Cash Flow from financial activities Net Cash Flow 5984 -15096 -464 1300 Revenue gross profit operating Income Pre-tax Income Income taxes Income After taxes EBITDA 65388 21508 -1941 -1743 699 -2442 8357 Revenue gross profit operating Income Pre-tax Income Income taxes Income After taxes Net Income EBITDA 69607 27546 10647 13923 3026 10897 11054 14814 Total current assets Total assets Total current liabilities Total liabilities Share holder Equity Total Liabilities and Share Holders Equity 35251 201549 26628 113286 88263 201549 Total current assets Total assets Total current liabilities Total liabilities Share holder Equity Total Liabilities and Share Holders Equity 28124 193984 3134 1 100095 93889 193984 Cash flow from operating activites Cash Flow From Investing Activities Cash Flow from financial activities Net Cash Flow 5984 -15096 -464 1300 RATIOSACCOUNTING & FINANCIAL RATIOSCURRENT RATIO (Current Assets / Current Liabilities)TOTAL ASSET TURNOVER RATIO (Total Revenue / Total Assets)Current Assets339660Total Revenue170220Current Liabilities2741301.2390471674Total Assets20222.18.4175234026WORKING CAPITAL (Current Assets - Current Liabilities)FINANCIAL LEVERAGE (Total Assets / Shareholder's Equity)Current Assets339660Total
- 24. Assets20222.1Current Liabilities27413065530Shareholder's Equity8674100.0233131968DEBT RATIO (Total Debt / Total Assets)NET PROFIT MARGIN (Net Income / Total Revenue)Total Debt-78370Net Income11230Total Assets2022210-0.0387546298Total Revenue1702200.0659734461EARNINGS PER SHARE (Net Income / Weighted Average Common Shares Outstanding)RETURN ON ASSETS (Net Income / Total Assets)Net Income11230Net Income11230Shares Outstanding181800.6177117712Total Assets20222.10.5553330267PRICE EARNINGS RATIO (Share Price (end of quarter / EPS)RETURN ON EQUITY (Net Income - Preferred Dividends / Shareholder's Equity)Stock Price551740NI - Pref. Div.9180EPS0.511081843.1372549Shareholder's Equity8674100.0105832305 Monthly Time Value of Money - Monthly CompoundingRate of ReturnYear 1Initial InvestmentMonth123456789101112Interest$0$0$0$0$0$0$0$0$ 0$0$0$0Investment Value$0$0$0$0$0$0$0$0$0$0$0$0Year 2Month123456789101112Interest$0$0$0$0$0$0$0$0$0$0$0$0I nvestment Value$0$0$0$0$0$0$0$0$0$0$0$0Year 3Month123456789101112Interest$0$0$0$0$0$0$0$0$0$0$0$0I nvestment Value$0$0$0$0$0$0$0$0$0$0$0$0Year 4Month123456789101112Interest$0$0$0$0$0$0$0$0$0$0$0$0I nvestment Value$0$0$0$0$0$0$0$0$0$0$0$0Year 5Month123456789101112Interest$0$0$0$0$0$0$0$0$0$0$0$0I nvestment Value$0$0$0$0$0$0$0$0$0$0$0$0Year 6Month123456789101112Interest$0$0$0$0$0$0$0$0$0$0$0$0I nvestment Value$0$0$0$0$0$0$0$0$0$0$0$0Year 7Month123456789101112Interest$0$0$0$0$0$0$0$0$0$0$0$0I nvestment Value$0$0$0$0$0$0$0$0$0$0$0$0Year 8Month123456789101112Interest$0$0$0$0$0$0$0$0$0$0$0$0I nvestment Value$0$0$0$0$0$0$0$0$0$0$0$0Year 9Month123456789101112Interest$0$0$0$0$0$0$0$0$0$0$0$0I nvestment Value$0$0$0$0$0$0$0$0$0$0$0$0Year
- 25. 10Month123456789101112Interest$0$0$0$0$0$0$0$0$0$0$0$0 Investment Value$0$0$0$0$0$0$0$0$0$0$0$0 AnnualTime Value of Money - Annual CompoundingRate of ReturnYear 12345678910Initial InvestmentInterest$0$0$0$0$0$0$0$0$0$0Investment Value$0$0$0$0$0$0$0$0$0$0 PVTime Value of Money - Present Value AnnuityNumber of YearsRate of Return$0.00Payment FVTime Value of Money - Future Value AnnuityNumber of YearsRate of Return$0.00Payment PV - Lump SumTime Value of Money - Present Value of Lump SumRateYears$0.00Initial Investment FV - Lump SumTime Value of Money - Future Value of Lump SumRateYears$0.00Initial Investment NPVNet Present Value (NPV) CalculatorBuilding Initial InvestmentYear12345678910Annual Cash InflowsCas h Flows$0$0$0$0$0$0$0$0$0$0Discount RateNPV = $0Year11121314151617181920Number of YearsCash Flows$0$0$0$0$0$0$0$0$0$0Salvage ValueEquipmentInitial InvestmentYear12345678910Annual Cash InflowsCash Flows$0$0$0$0$0$0$0$0$0$0Discount RateNPV = $0Year11121314151617181920Number of YearsCash Flows$0$0$0$0$0$0$0$0$0$0Salvage ValueBondsInitial InvestmentAnnual Cash InflowsDiscount RateNPV = $0Year12345678910Number of YearsCash Flows$0$0$0$0$0$0$0$0$0$0Principal Returned