
Recommended
Recommended
More Related Content
Similar to Balance SheetGREAT BASIN SCIENTIFIC, INC.September 30, 2015Decembe.docx
Similar to Balance SheetGREAT BASIN SCIENTIFIC, INC.September 30, 2015Decembe.docx (20)
More from rock73
More from rock73 (20)
Recently uploaded
Recently uploaded (20)
Balance SheetGREAT BASIN SCIENTIFIC, INC.September 30, 2015Decembe.docx
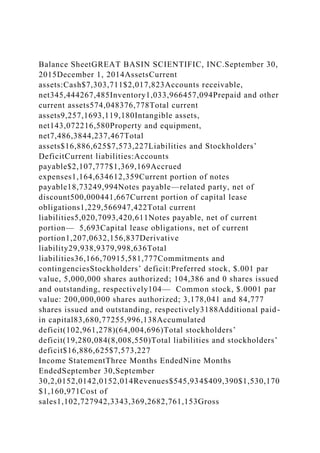
- 1. Balance SheetGREAT BASIN SCIENTIFIC, INC.September 30, 2015December 1, 2014AssetsCurrent assets:Cash$7,303,711$2,017,823Accounts receivable, net345,444267,485Inventory1,033,966457,094Prepaid and other current assets574,048376,778Total current assets9,257,1693,119,180Intangible assets, net143,072216,580Property and equipment, net7,486,3844,237,467Total assets$16,886,625$7,573,227Liabilities and Stockholders’ DeficitCurrent liabilities:Accounts payable$2,107,777$1,369,169Accrued expenses1,164,634612,359Current portion of notes payable18,73249,994Notes payable—related party, net of discount500,000441,667Current portion of capital lease obligations1,229,566947,422Total current liabilities5,020,7093,420,611Notes payable, net of current portion— 5,693Capital lease obligations, net of current portion1,207,0632,156,837Derivative liability29,938,9379,998,636Total liabilities36,166,70915,581,777Commitments and contingenciesStockholders’ deficit:Preferred stock, $.001 par value, 5,000,000 shares authorized; 104,386 and 0 shares issued and outstanding, respectively104— Common stock, $.0001 par value: 200,000,000 shares authorized; 3,178,041 and 84,777 shares issued and outstanding, respectively3188Additional paid- in capital83,680,77255,996,138Accumulated deficit(102,961,278)(64,004,696)Total stockholders’ deficit(19,280,084(8,008,550)Total liabilities and stockholders’ deficit$16,886,625$7,573,227 Income StatementThree Months EndedNine Months EndedSeptember 30,September 30,2,0152,0142,0152,014Revenues$545,934$409,390$1,530,170 $1,160,971Cost of sales1,102,727942,3343,369,2682,761,153Gross
- 2. loss(556,793)(532,944)(1,839,098)(1,600,182)Operating expenses:Research and development2,878,3161,424,8776,284,1703,265,149Selling and marketing1,481,140479,4993,206,9571,646,782General and administrative1,795,766597,7954,132,9732,004,080(Gain) loss on sale of assets— — — (8,166)Total operating expenses6,155,2222,502,17113,624,1006,907,845Loss from operations(6,712,015)(3,035,115)(15,463,198)(8,508,027)Other income (expense):Interest expense(253,220)(314,450)(868,587)(819,235)Interest income4,74661918,0782,057Change in fair value of derivative liability20,016,848(13,900,400)(22,641,625)(13,900,400)Total other income (expense)19,768,374(14,214,231)(23,492,134)(14,717,578)Inco me (loss) before provision for income taxes13,056,359(17,249,346)(38,955,332)(23,225,605)Provision for income taxes— 822(1,250)(5,297)Net income (loss)13,056,359(17,248,524)(38,956,582)(23,230,902)Net income (loss) per common share— basic$21$(7,052)$(142)$(11,057)Net income (loss) per common share—diluted$16$(7,052)$(142)$(11,057)Weighted average common shares—basic625,7142,446274,2952,101Weighted average common shares—diluted752,2722,446274,2952,101 Statement of CashflowsSeptember 30, 2015December 1, 2014Cash flows from operating activities:Net loss$(38,956,582)$(23,230,902)Adjustments to reconcile net loss to net cash used in operating activities:Depreciation and amortization1,130,826855,484Change in fair value of derivative liability22,641,62513,900,400Gain on sale of assets— (8,166)Interest converted to preferred stock— 13,129Employee stock compensation66,391242,696Warrant issuance and modifications54,48925,063Debt discount amortization58,33316,667Asset disposal— 11,124Changes in operating assets and liabilities:Increase in accounts receivable, net(77,959)(49,011)Increase in inventory(576,872)(61,713)Increase in prepaid and other
- 3. assets(197,270)(269,459)Increase in accounts payable457,250360,882Increase in accrued liabilities552,27542,598Net cash used in operating activities(14,847,494)(8,151,208)Cash flows from investing activities:Acquisition of property and equipment(842,225)(222,584)Construction of equipment(3,223,827)(479,196)Proceeds from sale of assets— 35,000Proceeds from sale leaseback— 1,500,000Net cash provided by (used in) investing activities(4,066,052)833,220Cash flows from financing activities:Proceeds from exercise of warrants3,166,394— Proceeds from issuance of convertible notes payable— 100,000Proceeds from issuance of convertible notes payable— related party— 300,000Proceeds from issuance of preferred stock— 6,569,886Proceeds from follow-on offering21,737,625— Proceeds from issuance of notes payable—related party250,000890,000Principal payments of capital leases(667,630)(653,837)Principal payments of notes payable(36,955)(390,000)Principal payments of notes payable— related party(250,000)(33,013)Net cash provided by financing activities24,199,4346,783,036Net increase (decrease) in cash5,285,888(534,952)Cash, beginning of the period2,017,8231,211,423Cash, end of the period$7,303,711$676,471Supplemental disclosures of cash flow information:Interest paid$818,378$775,666Income taxes paid$1,250$6,447Supplemental schedule of non-cash investing and financing activities:Conversion of preferred stock to common stock$10,478$1,480,000Issuance of preferred stock as debt discount$— $100,000Conversion of note payable to preferred stock$— $400,000Assets acquired through capital leases$— $807,272Initial public offering and follow-on offering costs incurred but unpaid$41,175$531,280Property and equipment included in accounts payable$240,183$70,784Cashless exercise of warrants$173,657$— Change in derivative liability from exercised and issued warrants$24,400,224$—
- 4. Solution sORIGINAL S- 1/A:http://www.sec.gov/Archives/edgar/data/1512138/00011931 2516429220/d12581ds1a.htm1)Monthly Net Cash Burn 1,576,129Months Until Cash Runs Out4.632)Current Ratio1.84Quick Ratio1.64Cash Ratio1.45Probably Not. For every dollar of current liabilities, the firm has 1.45 of cash with which it could pay those liabilities.3)Days Inventory Outstanding84(Note that I multiply by 0.75 to adjust for the 9- month reporting period)4)Days Sales Outstanding625)Days Payables Outstanding3776)Cash Conversion Cycle(231)Thus the firm could essentially finance its operating cycle purely on supplier credit. I.e., the firm's suppliers are very lenient.7)Sales/Assets0.0906Sales/(Average Assets)0.1251Thus, for every dollar of assets the firm makes roughly 9-13 cents of revenue8)ROA = (Sales/Assets)*(Net Income/Sales)Sales/Assets 0.0906Net Income/Sales(25)Since the company is not yet profitable this calculation doesn't make much sense, i.e. ROA is negative due to the negative gross profit margin. Since Net Income is positive for the last three months of operation, we could calculate the ROA for the last three months to get an idea of where the firm is headed. However, if you look closely you'll
- 5. notice that Net Income is not positive due to an increase in sales, but to the "Change in Fair Value of Derivative Liability", a non-cash item related to a change in the price of warrants that it owes. Thus, this increase in profitability is a little suspect. 9)Gross Profit Margin(1.20)Net Profit Margin(11.56)The large difference between the two margins is due primarily to the firm's large R&D expense and to the "Change in Fair Value of Derivative Liability"10)From https://www.google.com/finance?q=NASDAQ%3AGBSN&ei=w FiaVpHBLoa2mAGu4YDIBwThe closest comparable is Nanosphere Inc. 11)Ideally you would pull Nanospere's data and compare its ratio's to Great Basin's.12)20142015Monthly Net Cash Burn7,317,9881,576,129-78%Current Ratio0.911.84102%Net Profit Margin(20.01)(11.56)- 42%13)Company performance has improved in general. The firm is spending less cash relative to how much they make, they're better able to pay off short-term bills and their profitability is increasing (i.e. its less negative). Name: EVALUATING STARTUP FINANCES
- 6. Company Name: 1. How many months until the company exhausts their cash holdings given their current rate of spending? 2. Will the firm have difficulty paying their bills in the short- run? 3. How long does the company’s product sit in inventory on average? 4. How many days does it take for the firm to collect on its A/R?
- 7. 5. How many days does the company wait before paying its vendor invoices on average? 6. From start to finish, how long is each dollar tied up in the production and sales process before it is converted into cash? Name: 7. For every dollar of assets, how many dollars of sales does your firm generate?
- 8. 8. Does your company’s ROA come from its ability to create sales or from its ability to generate a high profit on those sales? 9. What are your company’s profit margins? 10. Which companies are in your firm’s peer group? 11. How does your company compare to its peers?
- 9. 12. How has your company’s performance changed over time? 13. Summarize the financial health of your company Company Name:1. How many months until the company exhausts their cash holdings given their current rate of spending?2. Will the firm have difficulty paying their bills in the short-run?3. How long does the company’s product sit in inventory on average?4. How many days does it take for the firm to collect on its A/R?5. How many days does the company wait before paying its vendor invoices on average?6. From start to finish, how long is each dollar tied up in the production and sales process before it is converted into cash?7. For every dollar of assets, how many dollars of sales does your firm generate?8. Does your company’s ROA come from its ability to create sales or from its ability to generate a high profit on those sales?9. What are your company’s profit margins?10. Which companies are in your firm’s peer group?11. How does your company
- 10. compare to its peers?12. How has your company’s performance changed over time?13. Summarize the financial health of your company