Recommended

Recommended
More Related Content
What's hot
What's hot (13)
Similar to Lise Sandenbergh poster
Similar to Lise Sandenbergh poster (20)
Recently uploaded
Recently uploaded (20)
Lise Sandenbergh poster
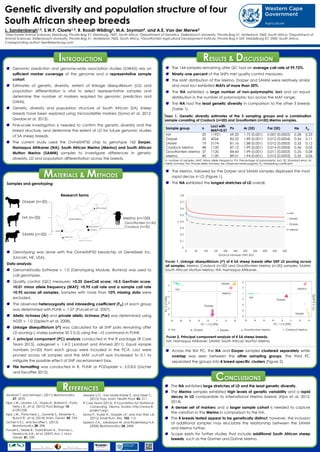
- 1. The NA exhibited large stretches of LD and the least genetic diversity. The Merino samples exhibited high levels of genetic variability and a rapid decay in LD comparable to international Merino breeds (Kijas et al. 2012; 2014). A denser set of markers and a larger sample cohort is needed to capture the variation in the Merino in comparison to the NA. The 4 breeds tested appear to be genetically distinct, however, the inclusion of additional samples may elucidate the relationship between the SAMM and Merino further. Scope exists for further studies that include additional South African sheep breeds, such as the Dormer and Dohne Merino. The 144 samples remaining after QC had an average call rate of 99.72%. Ninety-one percent of the SNPs met quality control measures. The MAF distribution of the Merino, Dorper and SAMM were relatively similar and most loci exhibited MAFs of more than 30%. The NA exhibited a large number of non-polymorphic loci and an equal distribution in the number of polymorphic loci across the MAF range. The NA had the least genetic diversity in comparison to the other 3 breeds (Table 1). The Merino, followed by the Dorper and SAMM samples displayed the most rapid decay in LD (Figure 1). The NA exhibited the longest stretches of LD overall. Across the first PC, the NA and Dorper samples clustered separately while overlap was seen between the other sampling groups. The third PC separated the groups into 4 breed-specific clusters (Figure 2). Samples and genotyping: Genotyping was done with the OvineSNP50 beadchip at GeneSeek Inc. (Lincoln, NE, USA). Data analysis: GenomeStudio Software v. 1.0 (Genotyping Module, Illumina) was used to call genotypes. Quality control (QC) measures: >0.25 GenCall score; >0.5 GenTrain score; >0.01 minor allele frequency (MAF); >0.95 call rate and a sample call rate >0.95 across all samples. Samples with more than 10% missing data were excluded. The observed heterozygosity and inbreeding coefficient (FIS) of each group was determined with PLINK v. 1.07 (Purcell et al. 2007). Allelic richness (Ar) and private allelic richness (Par) was determined using ADZE v. 1.0 (Szpiech et al. 2008). Linkage disequilibrium (r2) was calculated for all SNP pairs remaining after LD pruning (--indep-pairwise 50 5 0.5) using the --r2 command in PLINK. A principal component (PC) analysis conducted in the R package (R Core Team 2015), adegenet v. 1.4-2 (Jombart and Ahmed 2011). Equal sample numbers (n=20) from each group were included in the PCA. Loci were pruned across all samples and the MAF cut-off was increased to 0.1 to mitigate the possible effect of SNP ascertainment bias. File formatting was conducted in R, PLINK or PGDspider v. 2.0.8.0 (Lischer and Excoffier 2012). L. Sandenbergh1,2, S.W.P. Cloete1,3, R. Roodt-Wilding2, M.A. Snyman4, and A.E. Van der Merwe2 1Directorate Animal Sciences: Elsenburg, Private Bag X1, Elsenburg, 7607, South Africa; 2Department of Genetics, Stellenbosch University, Private Bag X1, Matieland, 7602, South Africa; 3Department of Animal Sciences, Stellenbosch University, Private Bag X1, Matieland, 7602, South Africa, 4Grootfontein Agricultural Development Institute, Private Bag X 529, Middelburg EC 5900, South Africa. Corresponding author: lises@elsenburg.com Genetic diversity and population structure of four South African sheep breeds Jombart T. and Ahmed I. (2011) Bioinformatics 27: 3070. Kijas J.W., Lenstra J.A., Hayes B., Boitard S., Porto Neto L.R., et al. (2012) PLoS Biology 10: e1001258. Kijas J.W., Porto-Neto L., Dominik S., Reverter A., Bunch R., et al. (2014) Anim. Genet. 45: 754. Lischer H.E.L. and Excoffier L. (2012) Bioinformatics 28: 298. Purcell S., Neale B., Todd-Brown K., Thomas L., Ferreira M.A.R., et al. (2007) Am. J. Hum. Genet. 81: 559. Qwabe S.O., Van Marle-Köster E. and Visser C. (2013) Trop. Anim. Health Prod. 45: 511. R Core Team (2015). R Foundation for Statistical Computing, Vienna, Austria. http://www.R- project.org/. Soma P., Kotze A., Grobler J.P. and Van Wyk J.B. (2012) Small Rum. Res. 103: 112. Szpiech Z.A., Jokabsson M. and Rodenberg N.A. (2008) Bioinformatics 24: 2498. RESULTS & DISCUSSION CONCLUSIONS REFERENCES Genomic prediction and genome-wide association studies (GWAS) rely on sufficient marker coverage of the genome and a representative sample cohort. Estimates of genetic diversity, extent of linkage disequilibrium (LD) and population differentiation is vital to select representative samples and determine the number of markers required for genomic prediction and GWAS. Genetic diversity and population structure of South African (SA) sheep breeds have been explored using microsatellite markers (Soma et al. 2012; Qwabe et al. 2013). Fine-scale investigation is needed to confirm the genetic diversity and the breed structure, and determine the extent of LD for future genomic studies of SA sheep breeds. The current study used the OvineSNP50 chip to genotype 160 Dorper, Namaqua Afrikaner (NA), South African Merino (Merino) and South African Mutton Merino (SAMM) samples to investigate differences in genetic diversity, LD and population differentiation across the breeds. MATERIALS & METHODS n: number of samples, MAF: Minor allele frequency; Pn: Percentage of polymorphic loci; SE: Standard error; Ar: Allelic richness; Par: Private allelic richness; He: Observed heterozygosity; FIS: Inbreeding coefficient. TABLE 1. Genetic diversity estimates of the 5 sampling groups and a combination sample consisting of Cradock (n=20) and Grootfontein (n=20) Merino samples. INTRODUCTION Dorper (n=20) SAMM (n=20) NA (n=20) Merino (n=100) Grootfontein (n=50) Cradock (n=50) Research farms Dorper Dorper NA NA SAMM SAMM Merino Merino ᴏ -Grootfontein MerinoX -NA + -Cradock Merino◊ -SAMMΔ -Dorper PC 1 (12.29%) PC3(6.83%) PC 1 (12.29%) PC2(7.93%) FIGURE 2. Principal component analysis of 4 SA sheep breeds. NA: Namaqua Afrikaner; SAMM: South African Mutton Merino FIGURE 1. Linkage disequilibrium (r2) of 4 SA sheep breeds after SNP LD pruning across all samples. Merino: Cradock (n=20) and Grootfontein Merino (n=20) samples; SAMM: South African Mutton Merino; NA: Namaqua Afrikaner. Sample group n Loci with MAF<0.01 Pn Ar (SE) Par (SE) He FIS NA 20 11921 69.20 1.75 (0.001) 0.007 (0.0003) 0.28 0.25 Dorper 20 4026 83.55 1.89 (0.001) 0.012 (0.0004) 0.34 0.11 SAMM 19 5174 81.16 1.88 (0.001) 0.012 (0.0003) 0.33 0.12 Cradock Merino 48 1120 87.12 1.99 (0.001) 0.014 (0.0004) 0.36 0.05 Grootfontein Merino 37 1120 84.43 1.99 (0.001) 0.011 (0.0003) 0.35 0.08 Merino 40 1120 89.01 1.94 (0.001) 0.012 (0.0003) 0.35 0.06