
Recommended
Recommended
More Related Content
Similar to Understanding Financial Reports & Market Valuation
Similar to Understanding Financial Reports & Market Valuation (20)
More from LinhLeThiThuy4
More from LinhLeThiThuy4 (19)
Recently uploaded
Recently uploaded (20)
Understanding Financial Reports & Market Valuation
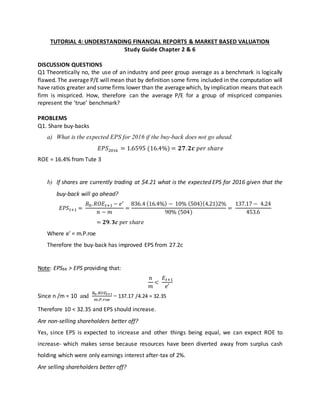
- 1. TUTORIAL 4: UNDERSTANDING FINANCIAL REPORTS & MARKET BASED VALUATION Study Guide Chapter 2 & 6 DISCUSSION QUESTIONS Q1 Theoretically no, the use of an industry and peer group average as a benchmark is logically flawed. The average P/E will mean that by definition some firms included in the computation will have ratios greater and some firms lower than the averagewhich, by implication means that each firm is mispriced. How, therefore can the average P/E for a group of mispriced companies represent the ‘true’ benchmark? PROBLEMS Q1. Share buy-backs a) What is the expected EPS for 2016 if the buy-back does not go ahead. 𝐸𝑃𝑆2016 = 1.6595 (16.4%) = 𝟐𝟕.𝟐𝒄 𝑝𝑒𝑟 𝑠ℎ𝑎𝑟𝑒 ROE = 16.4% from Tute 3 b) If shares are currently trading at $4.21 what is the expected EPS for 2016 given that the buy-back will go ahead? 𝐸𝑃𝑆𝑡+1 = 𝐵0.𝑅𝑂𝐸𝑡+1 − 𝑒′ 𝑛 − 𝑚 = 836.4 (16.4%) − 10% (504)(4.21)2% 90% (504) = 137.17 − 4.24 453.6 = 𝟐𝟗.𝟑𝒄 𝑝𝑒𝑟 𝑠ℎ𝑎𝑟𝑒 Where e’ = m.P.roe Therefore the buy-back has improved EPS from 27.2c Note: EPSbb > EPS providing that: 𝑛 𝑚 < 𝐸𝑡+1 𝑒′ Since n /m = 10 and 𝐵0.𝑅𝑂𝐸𝑡+1 𝑚.𝑃.𝑟𝑜𝑒 = 137.17 /4.24 = 32.35 Therefore 10 < 32.35 and EPS should increase. Are non-selling shareholders better off? Yes, since EPS is expected to increase and other things being equal, we can expect ROE to increase- which makes sense because resources have been diverted away from surplus cash holding which were only earnings interest after-tax of 2%. Are selling shareholders better off?
- 2. This is more difficult to say. On the surface of it we would say that they are worse off however, if the market can see the expected improvement in ROE from the buy-back then there may be a positive reaction to the announcement, which means that selling shareholders will get more for their shares. This in turn would suggest the cost of the buy-back will be more and therefore the positive impact on ROE will be lower so that selling and non-selling shareholders are indifferent. Q2 a) & b) Peer Group Measure X Ltd Alpha Beta Delta Average EPS 1.50 1.20 2.50 4 P0/E0 Trailing 5.33 4.58 6.0 5.625 5.40 Undervalued $8.10 EPS1 0.75 0.48 3.00 2.70 P0/E1 Leading 10.67 11.46 5.0 8.33 8.26 Overvalued $6.195 g (b.ROE) 7.5% 3.6 10 3.75 PEG 0.71 1.27 0.60 1.50 1.123 Undervalued $12.63 Fundamental P0/E0 Trailing 21.5 Undervalued $32.25 Fundamental P0/E1 Leading 20.0 Undervalued $15.00 B0 5.00 4.00 12.00 18.00 P0/B0 1.60 1.38 1.25 1.25 1.29 Overvalued $6.45 Fundamental P0/B0 3.0 Undervalued $15.00 Supporting calculations Fundamental P0/E0 (1 − 𝑏)(1+ 𝑔) 𝑟 − 𝑔 = (1 − 0.5)(1.075) . 10 − .075 = 21.50 Fundamental P0/E1 (1 − 𝑏) 𝑟 − 𝑔 = 1 − 0.5 . 10 − .075 = 20.0 Fundamental P0/B0 𝑅𝑂𝐸 − 𝑔 𝑟 − 𝑔 = 0.15 − .075 . 10 − .075 = 3.0
- 3. 𝑆𝑖𝑛𝑐𝑒 𝑃𝐸𝐺 𝑏𝑒𝑛𝑐ℎ𝑚𝑎𝑟𝑘 = 1.123 𝑃 𝐸 = 1.123 𝑥 𝑔 = 1.123 𝑥 7.5 = 8.4225 𝑃 = 𝑃 𝐸 𝑥 𝐸𝑃𝑆 = 8.4225 𝑥 1.50 = $12.63 Q3. From Q5 of “tutorial 3 questions” using DPS = (1-b)EPS. Note that firstyear of growth is 2017. Using DPS16 = $0.242 𝑉𝑆ℎ𝑎𝑟𝑒 = 0.242 1.1 + 0.242 (1.0182)[1 − ( 1.0182 1.1 ) 4 ] . 1 − .0182 1 (1.1) + 0.242 (1.0182)4 (1.03) . 1 − .03 1 (1.1)5 = 0.22 + 0.7279 + 3.827 (0.6209) = $𝟑.𝟑𝟐 This model represents our first valuation model based on retention ratio, ROE & ROC