- If a firm continues to earn negative free cash flow to the firm (FCFF), it means its cash from operations is insufficient to meet investing needs and it will require external financing like debt or equity issuance.
- The FCFF and free cash flow to equity (FCFE) models will only lead to the same firm value if the firm has no debt. With debt, the models are unlikely to yield the same value.
- Using market values for debt and equity avoids problems of circularity that can arise when using book values in the weighted average cost of capital (WACC) calculation under the FCFF approach. Differences between the models can also arise if the firm's debt-to-equity ratio is changing
Value Proposition canvas- Customer needs and pains
Tutorial 6 Solutions.docx
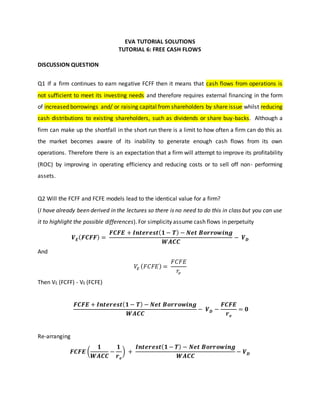
1. EVA TUTORIAL SOLUTIONS
TUTORIAL 6: FREE CASH FLOWS
DISCUSSION QUESTION
Q1 If a firm continues to earn negative FCFF then it means that cash flows from operations is
not sufficient to meet its investing needs and therefore requires external financing in the form
of increased borrowings and/ or raising capital from shareholders by share issue whilst reducing
cash distributions to existing shareholders, such as dividends or share buy-backs. Although a
firm can make up the shortfall in the short run there is a limit to how often a firm can do this as
the market becomes aware of its inability to generate enough cash flows from its own
operations. Therefore there is an expectation that a firm will attempt to improve its profitability
(ROC) by improving in operating efficiency and reducing costs or to sell off non- performing
assets.
Q2 Will the FCFF and FCFE models lead to the identical value for a firm?
(I have already been derived in the lectures so there is no need to do this in class but you can use
it to highlight the possible differences). For simplicity assume cash flows in perpetuity
𝑽𝑬(𝑭𝑪𝑭𝑭) =
𝑭𝑪𝑭𝑬 + 𝑰𝒏𝒕𝒆𝒓𝒆𝒔𝒕(𝟏 − 𝑻) − 𝑵𝒆𝒕 𝑩𝒐𝒓𝒓𝒐𝒘𝒊𝒏𝒈
𝑾𝑨𝑪𝑪
− 𝑽𝑫
And
𝑉𝐸 (𝐹𝐶𝐹𝐸) =
𝐹𝐶𝐹𝐸
𝑟𝑒
Then VE (FCFF) - VE (FCFE)
𝑭𝑪𝑭𝑬 + 𝑰𝒏𝒕𝒆𝒓𝒆𝒔𝒕(𝟏 − 𝑻) − 𝑵𝒆𝒕 𝑩𝒐𝒓𝒓𝒐𝒘𝒊𝒏𝒈
𝑾𝑨𝑪𝑪
− 𝑽𝑫 −
𝑭𝑪𝑭𝑬
𝒓𝒆
= 𝟎
Re-arranging
𝑭𝑪𝑭𝑬 (
𝟏
𝑾𝑨𝑪𝑪
−
𝟏
𝒓𝒆
) +
𝑰𝒏𝒕𝒆𝒓𝒆𝒔𝒕(𝟏 − 𝑻) − 𝑵𝒆𝒕 𝑩𝒐𝒓𝒓𝒐𝒘𝒊𝒏𝒈
𝑾𝑨𝑪𝑪
− 𝑽𝑫
2. If Debt = $0, both models will lead to the same value since WACC will collapse to r thereby
discounting the same cash flows by the same discount rate. However when Debt ≠ $0; the
condition is unlikely to hold. For companies that invest in a lot of human capital, like CSL, it is
likely that the WACC will be understated if equity is based on book value leading to a higher
valuation using the FCFF methodology. This difference can be mitigated by substituting it with
market capitalisation.
PROBLEMS
Q1. Calculate FCFF employing the Net Income method.
CSR Free Cash Flows 2015
From Q2 Tute 5 Total FCFE 114.3
Add Int(1-T) 15.7
Less Net borrowing 34.4
Total FCFF 164.4
Workings (see cash flow statement and below)
Interest (1-T) = 20.7 (1 − .24) = $15.7𝑚
(see answer to Q4 Tute 2 for tax rate)
Cross checking using cash distributed to shareholders = FCFF
𝐷𝑖𝑠𝑡𝑟𝑖𝑏𝑢𝑡𝑖𝑜𝑛 𝑡𝑜 𝑠ℎ𝑎𝑟𝑒ℎ𝑜𝑙𝑑𝑒𝑟𝑠 𝑎𝑛𝑑 𝑑𝑒𝑏𝑡ℎ𝑜𝑙𝑑𝑒𝑟𝑠
= (𝐵 + 𝐷)𝑡−1 + 𝐸𝑡 + 𝐼𝑛𝑡𝑒𝑟𝑒𝑠𝑡(1 − 𝑇)𝑡 − (𝐵 + 𝐷)𝑡
= (825.2 + 34.4) + 125.5 + 15.7 − (836.4 + 0) = $164.4
Interpretation of cash flows. CSR earns enough cash from operations to meet investments
however it is noted that CSR was disinvesting and reducing borrowings to zero.
BORAL. Calculate FCFF employing the Net Income method using the data from Tute 5.
BORAL Free Cash Flows 2015
From tute 5 Q3 Total FCFE $170.5
Add Int(1-T) 64.5
Less Net borrowing -221.1
3. Total FCFF $13.9
Interest (1-T) = 76.5 (1- 45.1/ 288.5) = 64.5
𝐷𝑖𝑠𝑡𝑟𝑖𝑏𝑢𝑡𝑖𝑜𝑛 𝑡𝑜 𝑠ℎ𝑎𝑟𝑒ℎ𝑜𝑙𝑑𝑒𝑟𝑠 𝑎𝑛𝑑 𝑑𝑒𝑏𝑡ℎ𝑜𝑙𝑑𝑒𝑟𝑠
= (𝐵 + 𝐷)𝑡−1 + 𝐸𝑡 + 𝐼𝑛𝑡𝑒𝑟𝑒𝑠𝑡(1 − 𝑇)𝑡 − (𝐵 + 𝐷)𝑡 =
= (3,194+ 215.4 + 886.1) + 257 + 64.5 − (3,280.5 + 1.8 + 1,320.8)
= $13.9𝑚
Interpretation of cash flows. Boral does earn enough cash from its operations to meet
investment needs, which is not a good sign and therefore needs to borrow money for this
purpose plus for distribution to shareholders.
Q2 Under the FCFF approach.
𝑊𝐴𝐶𝐶 = 13.87% (600
1,000
⁄ ) + 7% (1 − .4)(400
1,000
⁄ ) = 10%
𝑉𝐹𝑖𝑟𝑚 =
𝐹𝐶𝐹𝐹
𝑊𝐴𝐶𝐶
=
100
0.1
= $1,000𝑚
𝑉𝐸𝑞𝑢𝑖𝑡𝑦 = 𝑉𝑓𝑖𝑟𝑚 − 𝑉𝑑𝑒𝑏𝑡 = 1,000𝑚 − 400𝑚 = $600𝑚
Under the FCFE approach.
𝑉𝐸𝑞𝑢𝑖𝑡𝑦 =
𝐹𝐶𝐹𝐸
𝑟𝑒
=
𝐹𝐶𝐹𝐹 − 𝐼𝑛𝑡𝑒𝑟𝑒𝑠𝑡(1 − 𝑇) + 𝑁𝑒𝑡 𝐵𝑜𝑟𝑟
𝑟𝑒
=
100 − 7%(400)(1 − .4)
0.1387
=
83.202
0.1387
= $600𝑚
Interest = rd*Debt
Note the cost of equity is equal to
𝑟𝑒 = 10% + 4
6
⁄ [10% − 7%(1 − .4)] = 13.87%
What is important to note here is that the market weights of debt and equity are based on their
true market values which avoids the problem of circularity in the FCFF methodology (equity is
both a required input in the WACC calculation and required solution). Using proxies, such as
book values, will introduce errors.
4. There is a further problem if a firm has not reached a stable D/E ratio, which is to be expected
in the short to medium term. Under these conditions the value of debt may differ to that under
a target D/E ratio, which will in turn affect the WACC calculation.
Q3. Using FCFE = $114.30 FCFF $164.40 T = 24% Interest = 20.7 Debt = $0m
Interest rate on new debt = 20.7 /400 = 5.2% re = 12%
Net Borrowings = -$34.4
a) FCFF methodology
No debt for 2015 WACC = re
𝑉𝐸 = 𝑉𝐹 − 𝑉𝐷 =
164.4
. 12
− 0 = $1,370
𝑉𝑆ℎ𝑎𝑟𝑒 =
1,370
504
= $2.72 𝑝𝑠
FCFE methodology
Revised FCFE = 114.3 + 34.4 + 20.7 (0.76) = $164.4m since there is no debt and the target debt
level is $0 then there can be no borrowings or interest expense.
𝑉𝐸 (𝐹𝐶𝐹𝐸) =
𝐹𝐶𝐹𝐸
𝑟𝑒
=
164.4
. 12
= $1,370𝑚
Conclusion: The answer under both methodologies is the same for the situation of no debt and
recognising that net borrowings is not projected indefinitely, which makes sense given that the
target level of debt has been reached. Also given that debt = 0, there should be no interest
costs.
Note: if we don’t adjust for net borrowings our valuation under FCFE would be as follows which
is completely different
𝑉𝐸 =
114.3
. 12
= $952.5𝑚
Difference= 1,370 – 952.5 = $417.5m
b) Debt $400m and assume the correction to net borrowings and interest
FCFF methodology
Revise WACC
𝑊𝐴𝐶𝐶 = 12% (
836.4
836.4 + 400
) + 5.2% (1 − .24)(
400
836.4 + 400
)
= 12% (0.6765) + 3.952%(0.3235) = 8.12% + 1.28% = 9.4%
𝑉𝐹 =
164.4
0.094
= $1,749𝑚
5. 𝑉𝐸 = 𝑉𝐹 − 𝑉𝐷 = 1,749 − 400 = $1,349
FCFE methodology
Revise
Interest expense is unchanged 20.7 (.76) = $15.7
Revise FCFE = 114.3 + 34.4 = $148.7m
𝑉𝐸 =
148.7
. 12
= $1,239𝑚
Difference= 1,349 - 1,239–= $110m
Reconcile Difference
= 148.7 (
1
0.094
−
1
0.12
) +
15.7 + 0
0.094
− 400 = 343 + 167 − 400 = $110
Conclusion: Even though net borrowings has been removed there is still a difference between
the two methodologies. This suggests that the problem is with the WACC.
c) Consider using market value of equity 504m x $4.21 = $2,121.8 to determine WACC
FCFF methodology
Consider using
𝑊𝐴𝐶𝐶 = 12% (
2,121.8
2,121.8 + 400
) + 5.2% (1 − .24)(
400
2,121.8 + 400
)
= 12% (0.842)+ 3.95%(0.158) = 10.1% + 0.6% = 10.7%
𝑉𝐹 =
164.4
0.107
= $1,536𝑚
𝑉𝐸 = 1,536 − 400 = $𝟏,𝟏𝟑𝟔𝒎
FCFE methodology
As with part c)
𝑉𝐸 =
148.7
. 12
= $1,239𝑚
Difference= 1,136 – 1,239 = $103m (slightly better)
Reconcile
= 148.7 (
1
0.107
−
1
0.12
) +
15.7 + 0
0.107
− 400 = 151 + 147 − 400 = $103𝑚
6. Conclusion: Adjusting WACC for market values has not solved the inconsistency between the
two models.
d) Using 𝑉𝐸 =
𝐹𝐶𝐹𝐹
𝑊𝐴𝐶𝐶
− 𝐷
And recognising the Equity can be replace by VE
Removing denominator
𝑉𝐸. 𝑊𝐴𝐶𝐶 = 𝐹𝐶𝐹𝐹 − 𝐷. 𝑊𝐴𝐶𝐶
Rearranging
𝑉𝐸. 𝑊𝐴𝐶𝐶 + 𝐷. 𝑊𝐴𝐶𝐶 = 𝐹𝐶𝐹𝐹
Since E+D = V and substitute
𝑉. 𝑊𝐴𝐶𝐶 = 𝐹𝐶𝐹𝐹
Expanding WACC
𝑉 [𝑟𝑒
𝑉𝐸
𝑉
+ 𝑟𝑑(1− 𝑇)
𝐷
𝑉
] = 𝐹𝐶𝐹𝐹
Simplifies to
𝑟𝑒. 𝑉𝐸 + 𝑟𝑑(1− 𝑇)𝐷 = 𝐹𝐶𝐹𝐹
Therefore
𝑉𝐸 =
𝐹𝐶𝐹𝐹 − 𝑟𝑑(1− 𝑇)𝐷
𝑟𝑒
Using Debt $400m
𝑉𝐸 =
164.4 − 5.2% (1 − .24) (400)
0.12
=
148.7
0.12
= $1,239𝑚
Revise WACC (FCFF methodology)
𝑊𝐴𝐶𝐶 = 12% (
1,239
1,239 + 400
) + 5.2% (1 − .24) (
400
1,239 + 400
)
= 12% (0.756)+ 3.952%(0.244) = 9.07% + 0.964% = 10.034%
𝑉𝐹 =
164.4
0.10034
= $1,638𝑚
𝑉𝐸 = 1,638 − 400 = $1,239𝑚
FCFE methodology
As with part c)
𝑉𝐸 =
148.7
. 12
= $𝟏,𝟐𝟑𝟗𝒎
Comment:
Therefore except for a rounding error both models yield the same result. However, this
outcome is easily achieved if the relationship between debt and equity is maintained for period
7. t+1 onwards. This becomes far more complicated if we consider changes to this relationship
over time ie don’t assume in perpetuity.