
Recommended
More Related Content
What's hot
What's hot (20)
Similar to A3 Problem Solving Technique.pdf
Similar to A3 Problem Solving Technique.pdf (20)
Recently uploaded
Recently uploaded (20)
A3 Problem Solving Technique.pdf
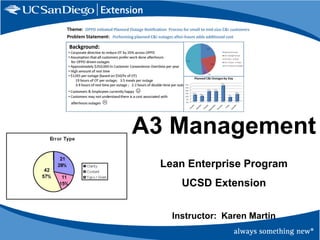
- 1. A3 Management Lean Enterprise Program UCSD Extension Instructor: Karen Martin
- 2. Learning Objectives • You will learn: – The fundamentals of A3 problem-solving. – The A3 Report – purpose & common components. – Key root cause analysis tools. – Common problem-solving pitfalls. – How the A3 process shifts culture & develops the workforce. – Where the A3 fits into the Lean toolbox.
- 4. © 2011 Karen Martin & Associates Why is problem-solving so challenging? It takes a different kind of thinking to solve a problem than the kind of thinking that produced the problem. 4 -- Albert Einstein
- 5. © 2011 Karen Martin & Associates What is A3? • The core of Toyota’s renowned management system. • A structured method for applying the PDCA (plan-do-check-act) approach to problem- solving. • International designation for 11 x 17” paper. 5
- 6. Sample A3 Report 6 Plan Do, Check, Act
- 7. © 2011 Karen Martin & Associates The A3 Report • A concise “story board” that reflects the problem solver’s discoveries and thought process along the way. • A “living document” that reflects the iterative nature of problem-solving and enables organizational learning. • Highly visual – graphics, charts, maps, drawings, etc. • “Making it pretty” isn’t the goal. – Hand drawn A3s are honored at Toyota. • Neither the format nor the specific sections are set in stone. – Beware of using “templates.” – Serve the iterative nature of the problem-solving process. 7
- 8. © 2011 Karen Martin & Associates Benefits of the A3 • Creates consistency in how the organization goes about solving problems. • Forces a holistic/comprehensive view of the problem and solutions; requires collaborative problem-solving. – Reduction in “silo-ism” • Thorough root cause analyses reduce the risk of “band-aid” solutions. • Ownership role reduces risk of “it’s everything else’s problem.” 8
- 9. © 2011 Karen Martin & Associates Benefits of the A3 (continued) • Stimulates data-driven decisions. • Fairness and accountability replace blame and deceit. • Transparency re: problems spawns a commitment to action. • Develops deep organizational capabilities. 9
- 10. © 2011 Karen Martin & Associates Deming’s PDCA Cycle Plan Do Check Act Develop hypothesis & design experiment Conduct experiment Measure results Analyze results & take appropriate action
- 11. © 2011 Karen Martin & Associates Problem-Solving Steps 1. Identify the problem 2. Explore the problem – What’s the true root cause? 3. Consider potential solutions – Hypothesize 4. Test solutions – Confirm hypothesis 5. Implement solution(s) 6. Measure results – Did the hypothesis prove out? 7. Adjust as needed 11 Plan Do Check Act { At least 50% of the total time
- 12. Common Components of the A3 Report Theme: ________________________________ Owner: ________________________________ Plan Do, Check, Act Background Current Condition Countermeasures / Implementation Plan Effect Confirmation Follow-up Actions Target Condition / Measurable Objectives Root Cause & Gap Analysis
- 13. Common Components of the A3 Report Theme: ________________________________ Owner: ________________________________ Plan Do, Check, Act Background Current Condition Countermeasures / Implementation Plan Effect Confirmation Follow-up Actions Target Condition / Measurable Objectives Root Cause & Gap Analysis
- 14. © 2011 Karen Martin & Associates The A3 Process: Define the Theme • What is our area of focus? • Articulating the right theme will force you to focus on the right problem. • Should be closely aligned with organizational goals to avoid spending limited time and resources on trivial issues. • Avoid judging or offering solutions. • Discussion: Sample A3s 14
- 15. Common Components of the A3 Report Theme: ________________________________ Owner: ________________________________ Plan Do, Check, Act Background Current Condition Countermeasures / Implementation Plan Effect Confirmation Follow-up Actions Target Condition / Measurable Objectives Root Cause & Gap Analysis
- 16. © 2011 Karen Martin & Associates A3 Roles & Responsibilities • Problem owner – Individual who’s accountable both for the results and the process for achieving results. – Problem owners have the authority to engage anyone needed and the responsibility to engage all relevant parties. • Coach – Person teaching the owner the problem-solving process. – Typically the owner’s direct supervisor. 16
- 17. Common Components of the A3 Report Theme: “What is our area of focus?” Owner: Person accountable for results. Plan Do, Check, Act Background Current Condition Countermeasures / Implementation Plan Effect Confirmation Follow-up Actions • What? • Who? • When? • Where? (if relevant) Target Condition / Measurable Objectives • Diagram of desired state • Measurable targets – how will we know that the improvement has been successful? • Diagram of current situation or process • What about it is not ideal? • Extent of the problem (metrics) • Problem statement • Context - why is this a problem? (visual) Root Cause & Gap Analysis • Graphical depiction of the most likely direct (root) causes • What measurable results did the solution achieve (or will be measured to verify effectiveness)? • Who’s responsible for ongoing measurement? • Where else in the organization can this solution be applied? • How will the improved state be standardized and communicated?
- 18. © 2011 Karen Martin & Associates The A3 Process: Background • Include a problem statement – State the problem; do not offer a solution • Background – information for understanding the importance and extent of the problem. – How does the problem relate to company goals? – How was the problem discovered? How long has it been a problem? – What evidence demonstrates that there’s a problem? – What degree of variation exists currently compared to a previous state? • Tailor information for the audience. • Present information visually. • “Sell” the need for improvement; create a sense of urgency. 18
- 19. Background Sections 19 Gray – highest industry quality scores Purple – average industry quality scores (benchmark) Blue – client quality scores
- 21. Common Components of the A3 Report Theme: “What is our area of focus?” Owner: Person accountable for results. Plan Do, Check, Act Background Current Condition Countermeasures / Implementation Plan Effect Confirmation Follow-up Actions • What? • Who? • When? • Where? (if relevant) Target Condition / Measurable Objectives • Diagram of desired state • Measurable targets – how will we know that the improvement has been successful? • Diagram of current situation or process • What about it is not ideal? • Extent of the problem (metrics) • Problem statement • Context - why is this a problem? Root Cause & Gap Analysis • Graphical depiction of the most likely direct (root) causes • What measurable results did the solution achieve (or will be measured to verify effectiveness)? • Who’s responsible for ongoing measurement? • Where else in the organization can this solution be applied? • How will the improved state be standardized and communicated?
- 22. © 2011 Karen Martin & Associates The A3 Process: Current Condition • Two primary goals – Provide the audience with an overview of the current process. – Demonstrate a fact-based understanding of the problem. • Content – Provide a visual overview of the current state process or system (strong use of charts, maps, graphs, tables, photos, etc.). – Highlight key factors in the current state. – Provide evidence of the problem (data) • Avoid qualitative opinions. – Avoid suggesting solutions or judging. 22
- 23. © 2011 Karen Martin & Associates Current State Documentation Options • Go to the gemba! – OBSERVE • Performance data • Spaghetti diagrams • Documentation / job aid review • Videotape / photos • Worker interviews • Work samples • Mapping – Value Stream Maps (VSM) - strategic – Metrics-Based Process Mapping (MBPM) – tactical 23
- 24. Sample A3s – Current State Missing inventory resulting in write-offs Poor correspondence quality
- 25. Common Components of the A3 Report Theme: “What is our area of focus?” Owner: Person accountable for results. Plan Do, Check, Act Background Current Condition Countermeasures / Implementation Plan Effect Confirmation Follow-up Actions • What? • Who? • When? • Where? (if relevant) Target Condition / Measurable Objectives • Diagram of desired state • Measurable targets – how will we know that the improvement has been successful? • Diagram of current situation or process • What about it is not ideal? • Extent of the problem (metrics) • Problem statement • Context - why is this a problem? Root Cause & Gap Analysis • Graphical depiction of the most likely direct (root) causes • What measurable results did the solution achieve (or will be measured to verify effectiveness)? • Who’s responsible for ongoing measurement? • Where else in the organization can this solution be applied? • How will the improved state be standardized and communicated?
- 26. © 2011 Karen Martin & Associates The A3 Report: Targets / Measurable Objectives • Purpose – How will we know that the improvement has been successful? – What standard or basis of comparison will be used? • Pointers – Use measurable objectives when possible. – Consider how data will be collected and shared to evaluate the effectiveness of the implemented solution(s). 26
- 27. I.T.R. Process Projected Summary Metrics Customer Request to Close-Out 27 Metric Current State Projected Future State Project % Improvement Timeline Lead Time 36 Days 16.5 Days 54% Timeline Process Time 5.75 Hrs 4 Hrs 30% % Activity 2% 3% 52% Rolled First Pass Yield 21% 69% 229% Total Process Time 14.75 Hrs 5 Hrs 66% Labor Requirements 2.0 FTEs 1.7 FTEs 15% Freed Capacity * - .23 FTEs - * Freed Capacity when rolled out to all Software I.T.Rs ≈ 6 FTEs
- 28. © 2011 Karen Martin & Associates • Refrigerant Adjustments / Write Offs Reduced To X% Sample A3 Target Condition / Measurable Objectives • 100% Of Branches Performing Quarterly Audits On All Service Inventory Sites. • Reduce Audit Process from monthly at 226 minutes to quarterly at 104 Minutes.
- 29. Common Components of the A3 Report Theme: “What is our area of focus?” Owner: Person accountable for results. Plan Do, Check, Act Background Current Condition Countermeasures / Implementation Plan Effect Confirmation Follow-up Actions • What? • Who? • When? • Where? (if relevant) Target Condition / Measurable Objectives • Diagram of desired state • Measurable targets – how will we know that the improvement has been successful? • Diagram of current situation or process • What about it is not ideal? • Extent of the problem (metrics) • Problem statement • Context - why is this a problem? Root Cause & Gap Analysis • Graphical depiction of the most likely direct (root) causes • What measurable results did the solution achieve (or will be measured to verify effectiveness)? • Who’s responsible for ongoing measurement? • Where else in the organization can this solution be applied? • How will the improved state be standardized and communicated?
- 30. © 2011 Karen Martin & Associates The A3 Report: Root Cause Analysis • Show the root cause of the problem(s) identified in the current state. • Separate symptoms and opinions from cause-and-effect determination. • Consider which techniques will be most useful in gaining root cause insight. • Identify add’l tests, if needed, to establish level of certainty re: cause and effect. • Summarize your findings visually. 30
- 31. © 2011 Karen Martin & Associates Root Cause Analysis 31
- 32. © 2011 Karen Martin & Associates Root Cause Analysis (RCA) • RCA is necessary to: –Avoid jumping to conclusions. –Avoid creating “band-aid” fixes (addressing only the symptoms). –Select proper countermeasures. –Design and implement lasting solutions that truly eliminate the problem. 32
- 33. © 2011 Karen Martin & Associates Root Cause Analysis Tools • Simple problems – Five Why’s – Problem Analysis Tree • More complex problems – Brainstorm causes (fishbone) – Tally frequency of most likely causes (check sheet) – Identify relevant few (Pareto analysis) for countermeasure development 33 If necessary
- 34. Five Why’s Example 1. Why is the error report being prepared? • My supervisor told me to. 2. Supervisor – Why are you asking for this report? • One of the standard reports to be prepared per my predecessor – I have yet to determine its usage. 3. Predecessor – Why did you initiate this report? • Report was required in the past because personnel in order entry were making data input errors. 4. Data entry – Why were orders being input with errors? • Orders received via fax were blurry and hard to read. 5. Data entry - Why were the fax orders hard to read? • Fax machine was old and of low quality. It was replaced 10 months ago and errors no longer are occurring. Problem: Report is taking too much of an employee’s time; team questions whether the report is needed
- 35. Problem Analysis Tree Problem: Documents are not being translated well and on time Late or poorly translated documents Translation problems** Lost docs* In physical transit In cyberspace In in-basket In out-basket * Lost and found = 40%; lost & never found = 5%; stuck in system = 55% ** Rework on over 50% of documents Translator doesn’t understand original Translator understands original, but still poor translation Poor original Translator skills Wrong technical vocabulary Poorly expressed No tracking Large batches Confusing formats Faxed / poor resolution Random vocabulary Lack of training No standard Selection Unclear expectations Training Poor editing Uneven workload
- 36. © 2011 Karen Martin & Associates Cause-and-Effect Diagram (aka Fishbone, Ishikawa) • Brainstorming tool used to identify most likely causes for an undesirable effect • Explores potential causes in 6 categories (6 M’s): – People (“Man”) – Material/Information - Inputs used in the process – Method - Procedures, work instructions, processes – Machine - Equipment, computers, tools, supplies – Measurement - Techniques used for assessing the quality/quantity of work, including inspection – Environment (“Mother Nature”) - External & internal • Use other categories if appropriate 36
- 37. © 2011 Karen Martin & Associates Cause-and-Effect Diagram (continued) • Effective brainstorming tool – Forces teams to consider all possible causes • Decreases the likelihood that something is being overlooked • Shows us the possible causes, but not how much each contributes, if at all, to the problem • Does not provide solutions / countermeasures 37
- 38. Cause-and-Effect Diagram Machine Measurement Environment People Material / Info Method Budgets Submitted Late Lack of experience Time availability No sense of import No stnd spread sheet Email vs. FedEx No standard work Input rec’d late Forecast in other system Manual vs. PC System avail. No milestones $ vs. units Weather delays Dispersed sales force Changing schedule
- 39. Techs Moving Product Skill Set Repair TAT Productivity Man Data Collection GMP Reason Man Power Flexing Between Families Schedule Estimates Low Backlog Non Standard Bench Set Up Bag Refill Process Component Parts Materials Measures Labor Time Collection Feed Back Frequency Incorrect Dates Recorded Machine Sap Data Entry Shared Equipment FIFO for Repair Units Methods Batching Cherry Picking Complaints Sent to W.R. Testing Guidelines Planning Tech Documentation Ease of Use No Std Repair Troubleshooting Variation in complexity Environment Demand Variation Shipping By product Line Flex Schedule/Breaks Blue affect productivity Yellow Most affect TAT
- 41. © 2011 Karen Martin & Associates Check Sheets • Help collect and record process data in an organized way (how often are certain events occurring?) • Provides factual data to help analyze process (transition from subjective to objective) • Detects patterns • Includes “likely candidates” from Cause-and-Effect Diagram (the relevant few) • Basis for Pareto Analysis • NOTE: Make it easy & collect data for limited period of time only 41
- 42. Check Sheets Quantify Occurrences Reason Tally Material shortage ||||| || Quality issue requiring rework ||||| Staffing/absenteeism ||| Order entry error ||||| ||||| Changing customer requirements w/ no adjustment to expected delivery ||||| ||||| ||| Equipment failure | 42 Root Cause Analysis: Late Shipments
- 43. © 2011 Karen Martin & Associates Pareto Analysis • Named after Wilfredo Pareto (18th century Italian economist/statistician) who discovered the 80-20 principle. – 20% of the people held 80% of the wealth • Focuses our attention on the VITAL FEW issues that have the greatest impact to avoid spending energy on the TRIVIAL MANY. • A type of bar graph that displays information/data in order of significance. • A visual aid for defining & prioritizing problems. 43
- 44. Pareto Chart Credit Application Delays 2909 627 561 242 180 2493 41% 77% 86% 100% 97% 94% 0 500 1000 1500 2000 2500 3000 3500 No Signature Insufficient Bank Info No prior address Current Customer No Credit History Other Reason for Delay Occurrences 0% 10% 20% 30% 40% 50% 60% 70% 80% 90% 100%
- 45. Sample A3 Root Cause & Gap Analysis
- 46. Sample A3 Root Cause & Gap Analysis
- 47. © 2011 Karen Martin & Associates Class Activity Begin performing root cause analysis for your class project (or determine which tools are relevant) 15 mins to work 47
- 48. © 2011 Karen Martin & Associates Nailing the left side of the A3 report is the most important element in the entire process. 48
- 49. © 2011 Karen Martin & Associates Left Side Reminders • Background – Need to quantify the problem to reduce subjective / emotional responses • Financial • Labor effort (which can be monetized) • Lead time / responsiveness (which can be monetized) • Market share • Compliance-related – Problem definition – proper scoping is vital! • Recommendation: Include one very specific problem statement in background section. 49
- 50. © 2011 Karen Martin & Associates Left Side Reminders (continued) • Target Condition / Desired state – Targeted performance metric, not the solution! – Must include measurable objectives • Include both % improvement and the raw numbers (from what to what) • Root cause – You cannot solve a problem without knowing it’s root cause! – Avoid making assumptions - “Do you think or do you know?” – When multiple root causes exist, quantify and select the relevant few for countermeasure development. 50
- 51. © 2011 Karen Martin & Associates Left Side Reminders (continued) • Displaying information visually aids tremendously in the absorption rate of the information – Pie charts, trend charts, graphs, bar diagrams – Drawings – Photographs – Problem trees, fishbone diagrams, Pareto charts – Process maps – Representations of the people involved – Anything that communicates information more quickly and effectively than words 51
- 52. Common Components of the A3 Report Theme: ________________________________ Owner: ________________________________ Plan Do, Check, Act Background Current Condition Countermeasures / Implementation Plan Effect Confirmation Follow-up Actions Target Condition / Measurable Objectives Root Cause & Gap Analysis
- 53. Common Components of the A3 Report Theme: “What is our area of focus?” Owner: Person accountable for results. Plan Do, Check, Act Background Current Condition Countermeasures / Implementation Plan Effect Confirmation Follow-up Actions • What? • Who? • When? • Where? (if relevant) Target Condition / Measurable Objectives • Diagram of desired state • Measurable targets – how will we know that the improvement has been successful? • Diagram of current situation or process • What about it is not ideal? • Extent of the problem (metrics) • Problem statement • Context - why is this a problem? Root Cause & Gap Analysis • Graphical depiction of the most likely direct (root) causes • What measurable results did the solution achieve (or will be measured to verify effectiveness)? • Who’s responsible for ongoing measurement? • Where else in the organization can this solution be applied? • How will the improved state be standardized and communicated?
- 54. © 2011 Karen Martin & Associates Once you know the root cause, brainstorm and prioritize solutions 1. List relevant countermeasures. 2. Eliminate those that aren’t possible. – Regulatory, budgetary, resource availability, system capability, etc. 3. Combine those that are similar. 4. Number the countermeasures sequentially. 5. Place countermeasures accordingly on the PACE Prioritization Grid.
- 55. Building a Lean Enterprise Lean Tools
- 56. PACE Prioritization Matrix High Low Anticipated Benefit Ease of Implementation Difficult Easy 20 7 5 13 4 23 1 22 8 9 2 10 16 11 6 12 14 19 15 17 3 21 18
- 57. © 2011 Karen Martin & Associates The A3 Report: Countermeasures / Implementation Plan • Consider all options – Be innovative – be willing to challenge your paradigms and help others challenge their own • Make sure the countermeasure is directed very specifically to the key root causes • Make is clear exactly what will be done, by whom, when, where, how, in what order – Gantt charts can be helpful – How often will the implementation plan be reviewed? • Aim for full implementation by a specific date • At this point, the problem owner’s key roles shifts to advocate and project manager • Cross-functional involvement and consensus is a vital success factor
- 58. Sample A3 Countermeasures / Implementation Plan
- 59. Common Components of the A3 Report Theme: “What is our area of focus?” Owner: Person accountable for results. Plan Do, Check, Act Background Current Condition Countermeasures / Implementation Plan Effect Confirmation Follow-up Actions • What? • Who? • When? • Where? (if relevant) Target Condition / Measurable Objectives • Diagram of desired state • Measurable targets – how will we know that the improvement has been successful? • Diagram of current situation or process • What about it is not ideal? • Extent of the problem (metrics) • Problem statement • Context - why is this a problem? Root Cause & Gap Analysis • Graphical depiction of the most likely direct (root) causes • What measurable results did the solution achieve (or will be measured to verify effectiveness)? • Who’s responsible for ongoing measurement? • Where else in the organization can this solution be applied? • How will the improved state be standardized and communicated?
- 60. © 2011 Karen Martin & Associates The A3 Report: Effect Confirmation • Tie confirmation directly to the target condition. • Define 2-5 key performance indicators (KPIs). • Determine ways to verify the effectiveness of the countermeasures, one by one if possible. • Plan in advance for the data that will need to be collected. • Identify who will help collect the data and how frequently.
- 61. Common Components of the A3 Report Theme: “What is our area of focus?” Owner: Person accountable for results. Plan Do, Check, Act Background Current Condition Countermeasures / Implementation Plan Effect Confirmation Follow-up Actions • What? • Who? • When? • Where? (if relevant) Target Condition / Measurable Objectives • Diagram of desired state • Measurable targets – how will we know that the improvement has been successful? • Diagram of current situation or process • What about it is not ideal? • Extent of the problem (metrics) • Problem statement • Context - why is this a problem? Root Cause & Gap Analysis • Graphical depiction of the most likely direct (root) causes • What measurable results did the solution achieve (or will be measured to verify effectiveness)? • Who’s responsible for ongoing measurement? • Where else in the organization can this solution be applied? • How will the improved state be standardized and communicated?
- 62. © 2011 Karen Martin & Associates 62 The A3 Report: Follow-up Actions • How will you communicate the new process? • Who will monitor the process? • Which metrics will be used to measure ongoing performance? • Look for similar processes within the department and across the organization that can benefit from these countermeasures • Ensure ongoing improvement – who will do this? • Share the wealth! – Communicate results across the organization and teach others to problem-solve via the A3 process
- 63. Sample A3 Effect Confirmation & Follow-up Actions Follow-up Actions Effect Confirmation
- 64. © 2011 Karen Martin & Associates 64
- 65. © 2011 Karen Martin & Associates © 65 Additional A3 Considerations • A3 Roles & Responsibilities – Problem Owner – Person(s) accountable for results; authorized to engage any and all parties needed – Problem Coach – Person(s) “developing” the process owner into a skilled problem-solver; typically leadership. • A3 vs. Value Stream Mapping – how they work together (or separately)
- 66. © 2011 Karen Martin & Associates PDCA: Plan Stage 66 Primary problem-solving role: Investigator
- 67. © 2011 Karen Martin & Associates PDCA: Do-Check-Act Stages 67 Primary problem-solving role: Director
- 68. © 2011 Karen Martin & Associates Other A3 Applications and Common A3 Components • Proposal – Theme – Background – Current Condition – Analysis and Proposal – Plan Details – Unresolved Issues (if relevant) – Implementation Schedule – Total Effect • Status Report – Theme – Background – Current Condition – Results – Unresolved Issues / Follow-up Actions – Total Effect
- 69. © 2011 Karen Martin & Associates In Summary A3 reports should become a standardized form of currency for problem-solving, dialogue, and decision-making in your organization– creating an organization of “scientists” who continually improve operations and achieve results through constant learning from the work at hand. 69