SlideShare a Scribd company logo
1 of 72
© 2008 PALGRAVE MACMILLAN 1462-8732 J O U R N A L
O F C O M M E R C I A L B I OT E C H N O L O G Y. VOL
14. NO 4. 307–325 OCTOBER 2008 307
www.palgrave-journals.com/jcb
INTRODUCTION
The increasing discussion about rising
healthcare cost is fuelled by reports that
General Motors paid more for healthcare than
Value-driven project and
portfolio management in
the pharmaceutical industry:
Drug discovery versus drug
development – Commonalities
and differences in portfolio
management practice
Kerstin M. Bode-Greuel and Klaus J.
Nickisch
Date Received (in revised form): 31st January, 2008
Kerstin M. Bode-Greuel
is founding and managing partner of Bioscience Valuation in
Germany and USA, and of Bioscience Market Research, USA.
Her 20-year
experience covers virtually all therapy areas in pharmaceutical
R & D and strategic marketing. She held senior positions at
Bayer AG,
and after fi ve years of independent management consultancy,
co-founded Bioscience Valuation. Her publications include two
expert
SCRIP reports, professional journal articles and chapter of a
textbook. She is Associate Lecturer at University of Essen ’ s
Masterclass
programme, as well as speaker / workshop leader in
international conferences. Kerstin studied medicine in Germany
and UK, and was
educated in corporate fi nance at the Wharton School of the
University of Pennsylvania.
Klaus J. Nickisch
received his PhD in Organic Chemistry from the Technical
University Berlin in 1979. He then joined the Schering AG as a
medicinal
chemist doing research work in the endocrinology and
cardiovascular fi eld for fi ve years. In 1985 he moved into
development and
fi nally led the chemical development department for many
years. In 1999 he moved to project management and became
head of
project- and portfolio management of Specialized Therapeutics,
a business unit of Schering AG located in the US. He fi nally
got
promoted to heading global project management. After the
acquisition of Schering AG by Bayer AG, he joined the Berlin
School
of Economics where he is now in charge for building a new
MBA programme for pharmaceutical management.
Abstract
The concept of portfolio management has been widely used in
the pharmaceutical industry. It is used
to evaluate the commercial value and the risk structure of
development projects. The fi nal goal is to
select a portfolio of projects that addresses the strategic
objectives of the organisation optimally
and that leads to the highest overall portfolio value. Companies
now start to apply the portfolio
management concept on their research portfolios. Although the
basic principle remains the same, the
methodology applied has to be adapted to the greater
uncertainty that early research projects carry.
Commonalities and differences of the portfolio management
process in research and development
are described and recommendations are given how to harmonise
the two different approaches.
Journal of Commercial Biotechnology (2008) 14, 307 – 325.
doi: 10.1057/jcb.2008.6 ;
published online 4 March 2008
Keywords: portfolio management , research ,
development , pharmaceutical industry , risk management
Correspondence: Kerstin M. Bode-Greuel, Bioscience
Valuation BSV
GmbH, Am Zigeunerbergl 3, Grainau 82491, Germany
Tel: + 49 8821 966979 0
Fax: + 49 8821 966979 29
E-mail: [email protected]
Bode-Greuel and Nickisch
© 2008 PALGRAVE MACMILLAN 1462-8732 J O U R N A L
O F C O M M E R C I A L B I OT E C H N O L O G Y. VOL
14. NO 4. 307–325 OCTOBER 2008308
for steel per vehicle in 2004, 1 and Starbucks
paid more for health insurance than for coffee
in 2005. 2 The continuing rise in development
costs for drugs has increased pressure on R & D
organisations to contribute to higher effi ciency
in the overall process of coming up with new
drugs.
In the last few years the industry has made
signifi cant efforts to address these challenges 3
and to increase the productivity of the drug
development process. Some of the initiatives
have without doubt led to considerable
improvements. Examples are the earlier
determination of a drug ’ s toxicology profi le
and early tests to investigate the suitability of
a new drug candidate for oral administration
or once a day dosing. The question is no
longer how good we are in what we are
doing but whether we are doing the right
things. Further improvements of the overall
process should shift from attempts of
enhancing effectiveness to a greater
emphasis on the effi ciency of the processes
applied.
In this context a lot of emphasis is put
on portfolio management. In the broadest
defi nition, portfolio management describes the
process of maximising the value of R & D
portfolios through proper resource allocation.
This requires an alignment of portfolio
management with strategic business objectives.
Such objectives should not only be general
(e.g., innovation) and quantitative (eg ROI or
sales targets). They should also defi ne disease
areas of interest, clearly outline the remaining
medical needs, and specify the indications that
are considered worth pursuing. This will
enable decision makers and functional R & D
managers to identify projects with both
strategic fi t and a high value proposition.
Depending on the size of the organisation,
either a corporate or therapeutic area strategies
need to be developed, approved, and
endorsed by the entire organisation.
Value-driven project and portfolio
management implies quantitative fi nancial and
risk analysis of individual projects and overall
portfolios. Such analyses elucidate options for
improving the value and risk structure of
individual projects on the one hand and
therapeutic areas or overall corporate
portfolios on the other hand. They are
applicable and relevant to companies of any
size. Value-driven project and portfolio
management is a methodology enabling the
alignment of project decisions with corporate
strategy and defi ned business objectives.
Although portfolio management has been
applied in the fi nancial industry for many
years and Harry Markowitz was honoured
with the Nobel Prize for outlining this
concept it was only around the end of the last
century that the application of value-driven
portfolio management in the pharmaceutical
industry was published. 4 Around the same
time, an investigation across various industries
provided evidence that portfolio manageme nt
based on quantitative fi nancial analyses using
the net present value (NPV) algorithm
correlates well with value creation. Value
destruction, however, was observed more
frequently in companies that built their
portfolio decisions only on simplifi ed scoring
methods or semi-quantitative portfolio
matrices such as those introduced in the
1980s. 5
Most pharmaceutical companies have
implemented portfolio management in drug
development. 6 – 9 An increasing number of
companies is now making efforts to apply it
to discovery research and early development.
Not surprisingly, given the relatively short
period of use, the inherent complexity of the
issue has prevented the establishment of a
broadly accepted best practice in R & D
portfolio management.
This review focuses on the entire portfolio
management process with special emphasis on
commonalities and differences in the research
and development environment. For aspects
where, based on the authors ’ experience, a
best practice emerges this is clearly stated.
Otherwise, different approaches are described
and compared. We begin with the description
of portfolio management in development
because there it has a longer history than in
Value-driven project and portfolio manage ment in the
pharmaceutical industry
© 2008 PALGRAVE MACMILLAN 1462-8732 J O U R N A L
O F C O M M E R C I A L B I OT E C H N O L O G Y. VOL
14. NO 4. 307–325 OCTOBER 2008 309
The four tools mentioned above provide
information required to evaluate and prioritise
projects, and to analyse whether the portfolio
is aligned with corporate objectives. TPPs
are generally applied, but not always in an
effective way. The stage-gate decision process
is related to the major preclinical and clinical
development milestones and is also a well-
established principle in the pharmaceutical
industry. At each stage-gate, it is decided
whether the achieved results support
continuation of development, and the project
may be reprioritised depending on other
projects competing for resources. Time line
and budget management has been the
responsibility of project management for a
long time. Sales forecasting and fi nancial
project evaluation is undertaken to a variable
extent and level of detail, depending on
companies ’ policies at which development
stage quantitative analyses should commence.
In addition to the four tools mentioned
above, risk analysis has become a particular
point of concern for about fi ve years, both in
project and in portfolio management. 10 In
the context of the pharmaceutical and
biotechnology industry, it is helpful to
differentiate two different categories of risk as
they are managed by different stakeholders:
strategic and operative risk. 11 In brief, strategic
risks typically affect go / no-go decisions and
may have a signifi cant impact on value;
therefore, they are matters of concern
predominantly for project and portfolio
management. Operative risks represent issues
that may lead to deviations from the
development plan and budget. They require
particular attention by line functions and
coordination by project management, as they
are often cross-functional. Operative problems
may eventually gain strategic relevance.
Strategic risk analysis has been applied for
some time in R & D portfolio management
and is usually represented as estimates of the
probability of achieving milestones. The
systematic management of operative risk has
been initiated more recently; here, risk is
often not represented as probability but rather
research. This has led to a signifi cant body
of experience on which portfolio management
in early R & D can build.
CURRENT BEST PRACTICE OF
PORTFOLIO MANAGEMENT
IN DEVELOPMENT (BEYOND
PROOF OF CONCEPT)
There are two major tasks for implementation
of value-driven portfolio management:
evaluation methodology and metrics on the one
hand, and the corporate evaluation and
prioritisation process on the other hand. There
is a general agreement in the pharmaceutical
industry that the evaluation of projects
entering ‘ full ’ development after successful
proof of concept (PoC) should include
quantitative fi nancial parameters. Furthermore,
there appears to be a generally accepted set
of portfolio management metrics. 6 – 9 The
portfolio management process, however,
differs, as well as the degree of
implementation, refl ecting individual
companies ’ corporate structure and culture.
There are some prerequisites for successful
portfolio management that apply to all
systems: the evaluation of projects must
be suffi ciently detailed, interdisciplinary,
consistent, and embedded in a practicable
corporate process.
Value-driven project management
in development
The fi rst step towards value-driven portfolio
management is the establishment of effective
project management. Project management is
the predominant operative instrument for
the execution of portfolio decisions. Four
common tools are applied to align project
management with portfolio decisions:
Target product profi le (TPP)
A stage-gate decision process
Timeline and budget management
Sales forecast aligned with TPP and
development plan
•
•
•
•
Bode-Greuel and Nickisch
© 2008 PALGRAVE MACMILLAN 1462-8732 J O U R N A L
O F C O M M E R C I A L B I OT E C H N O L O G Y. VOL
14. NO 4. 307–325 OCTOBER 2008310
as semi-quantitative categorisation and plotted
against categories of impact.
In the following, ways towards effective
application of TPPs and strategic risk analysis
(in the format of decision trees) are described.
In addition, sales forecasting procedures and
fi nancial analyses adapted to the needs of
portfolio management are outlined.
Target product profi le (TPP)
A TPP serves as a blueprint of the desired
future product. It defi nes the disease category
and targeted patient population, the requested
effi cacy, safety and tolerability characteristics,
and technical details such as, for example,
formulation and mode of application of the
product to be developed. The TPP describes
features of the future marketed product that
can realistically be expected based on the
properties of the compound and the
pathophysiology of the disease to be treated.
It takes into account both regulatory and
market requirements, as the profi le should
refl ect both a registrable and a commercially
viable product. Ideally, TPPs for individual
projects and their respective targeted disease
categories are well aligned across discovery
research, development, and marketing
functions. The FDA has recently defi ned a
template for TPPs to facilitate communication
with the agency. 12 This is an extensive
document of several pages not only requesting
target criteria but also a description of trial
designs and obtained development results. As
internal tool for value-driven management,
focused TPPs are more suitable, summarising
the features that drive development and
marketing plans. Such TPPs do usually
comprise not more than 1 – 2 pages.
TPPs defi ne the desired label in the packet
insert and therefore serve as outline for R & D
with respect to the required clinical trials and
development activities, that is, TPPs defi ne
the scope of investment. In order to fulfi l this
task, effi cacy and safety / tolerability parameters
are defi ned in a commonly agreed and, as far
as possible, quantitative way, as they will drive
trial design and cost.
The TPP outlines the development targets,
but it does not always indicate to what extent
results would be allowed to deviate from the
target until further development is not worth
while any more. Therefore, companies often
defi ne a minimum product profi le (MPP)
alongside the TPP to establish a common
understanding of the minimum study results
required for continuation of development. All
of the MPP criteria must be achieved, and
they must respect regulatory requirements.
While the TPP outlines the scope of
investment, the MPP represents stop / go
criteria.
TPPs can play a benefi cial role in aligning
project activities between the development
functions and marketing and sales. This is best
achieved if they are established through an
interactive cross-functional process. TPPs also
facilitate the communication of project issues
and the alignment of senior management ’ s
expectations. As such, they are an important
element of value-driven management.
Decision tree analysis
Decision tree analysis is an effective tool to
illustrate R & D decision points, the
probabilities of uncertain outcomes at each
milestone, and potentially resulting decision
options ( Figure 1 ). It is well established in
pharmaceutical development. 4,12 As investment
decisions are made with respect to milestones,
it is useful to examine the risk and cost of
individual milestones and the value gained
assuming successful completion. Decision trees
serve as communication tool for portfolio
management and for project management
and line functions. They are also used for
risk adjusted net present value analysis
( ‘ augmented NPV ’ ).
Decision tree analysis focuses on those
activities that are essential for successful
development and for achievement of the
TPP. If milestones are composed of several
independent uncertain activities undertaken in
parallel, individual probabilities are multiplied
to provide the overall probability of success
Value-driven project and portfolio management in the
pharmaceutical industry
© 2008 PALGRAVE MACMILLAN 1462-8732 J O U R N A L
O F C O M M E R C I A L B I OT E C H N O L O G Y. VOL
14. NO 4. 307–325 OCTOBER 2008 311
circumstances of the individual case. An
interactive and systematic discussion process
has proven to be most effective as participants
refl ect their opinions against others. This leads
to a fruitful knowledge exchange among
experts and in most cases to a common
agreement. It is sometimes believed that the
interactive process consumes too much time,
there may not be access to professional
moderation capabilities, or expert teams are
considered overly optimistic. Therefore, some
companies prefer simplifi ed procedures, for
example, the distribution of templates that
have to be fi lled, or they use published
average success rates. However, this may
result in overlooking critical project issues that
arise from the interaction of functions and
that would not be recognised by individuals
for the respective milestone. Decision trees
usually extend up to approval. Market
scenarios and commercialisation uncertainties
are often refl ected in probabilistic sales
forecasts (see below).
Best practice decision tree analysis is
conducted with the project teams and
additional experts when appropriate. The
analysis benefi ts from a neutral moderator,
often a representative of the portfolio
management function. The development plan
is evaluated along the TPP / MPP and its
milestone structure. For those uncertain
elements that affect go / no-go decisions, the
probability of success is estimated. Benchmarks
can be used as orientation to outline a
plausible range to the team. Probabilities are
assessed based on available knowledge and the
54%
Phase III
Carcinogenicity
46%
Phase III: efficacy at least according to minimum
profile (6 months treatment, p=80%), 12 months
safety trial OK (p=80%), carcinogenicity study
OK (p=85%)
- GO TO Registration -
Phase III and/or 12 months safety trial and/
or carcinogenicity study failed
- STOP -
54%
Phase III
Carcinogenicity
46%
Phase III: efficacy at least according to minimum
profile (6 months treatment, p=80%), 12 months
safety trial OK (p=80%), carcinogenicity study
OK (p=85%)
- GO TO Registration -
Phase III and/or 12 months safety trial and/
or carcinogenicity study failed
- STOP -
40%
Phase I
go
60%
stop
65%
Phase IIa
(PoC)
go
35%
stop
46%
Phase III
L.T. Tox
go
stop
10%
Registration
go
90%
stop
Phase IIb
CMC
go
stop
54%
72%
28%
Figure 1 : Example of a decision tree. Decision trees are
tools to illustrate the potential outcomes at
development milestones and the risk structure of projects.
Outcomes are differentiated according to
available decision options. For use in portfolio management and
for valuation purposes, the layout is
usually simplifi ed as it assumes that development will be
continued and the project will fi nd an investor
if milestones are achieved. The Phase III milestone in the
present example is comprised of three
uncertain studies whose outcomes are considered independent,
while all studies must be successful in
order to proceed. Probability estimates can then be multiplied to
achieve the overall probability of
success of the milestone. If several studies are undertaken at a
milestone, care must be taken to identify
potential interdependencies between studies in order to avoid an
overestimation of risk. 11 Decision
trees may sometimes refl ect more than two decision options at
a milestone. For example, a Phase II
milestone may lead to more than one way forward: if effi cacy
is as outlined in the TPP, it may be
decided to go directly to Phase III; alternatively, Phase II
results may suggest to investigate another
treatment schedule before going to Phase III in order to
maximise the chance of success of the latter.
Bode-Greuel and Nickisch
© 2008 PALGRAVE MACMILLAN 1462-8732 J O U R N A L
O F C O M M E R C I A L B I OT E C H N O L O G Y. VOL
14. NO 4. 307–325 OCTOBER 2008312
alone. Furthermore, published benchmarks are
averages across a sample of companies, and
the method applied to generate them differs
among sources. In addition, there is evidence
that individual companies deviate signifi cantly
from average success rates, indicating
differences in R & D productivity within the
industry. Finally, success rates differ across
therapeutic fi elds, and the available statistics
do not provide reliable data for individual
disease entities.
Very often, alternative options exist for the
development of projects. These may comprise
a broader or restricted target patient group, a
fast and risky development to achieve earlier
launch versus a step-wise, risk reduced
development strategy, the cheapest possible
way towards registration, or a more or less
ambitious TPP with respect to effi cacy or
safety. Such alternatives differ with respect to
cost, risk and risk structure, timelines, and
commercial value. Decision tree analysis is
an ideal tool to facilitate the analysis of
alternative options.
The relevance of project risk structure . A project ’ s
risk structure is defi ned as the resolution of
risk per milestone. Risk structure may be
front-loaded (low probability of success in
early development), balanced, or back-loaded
(high risk in late development). Alternative
development plans usually differ in risk
structure. Mostly, but not always, this is also
associated with a difference in overall
probability of development success. Risk
structure affects the fi nancial value of projects
because the relative weighting of outcomes is
different.
This applies even if overall probability of
success is not different, in cases where the
relative weighting of expensive versus cheap
failure scenarios is changed. In essence, it
would always be advisable to reduce risk as
early and quickly as possible in order to put
the signifi cant investments in the later stages
at the lowest necessary risk.
R & D projects can be classifi ed in different
categories, such as, for example, fi rst-in-class
highly innovative new products, ‘ fast
followers ’ with validated mechanism of action,
or added-value generics, that differ in risk
structure. Highly uncertain innovative drugs
undergo signifi cant risk resolution only after
Phase II (PoC) or even Phase III, depending
on the therapeutic category and clinical trial
endpoints. Fast followers are projects of
moderate risk in Phases II and III; risk will
mostly be driven by the incremental benefi ts
the sponsor wishes to establish to make the
product competitive vis- à -vis the market
leader. Added-value generics are copies of
products with a commonly known benefi t /
risk ratio, while effi cacy, safety, or
convenience is enhanced, for example,
through an innovative formulation. Such
projects have a comparatively low
development risk and often a shorter
development time. The analysis of project risk
and the proactive selection of projects with
complementary risk structure offer
opportunities to balance portfolio risk. A risk-
balanced portfolio is more likely to meet
productivity goals. Furthermore, projects with
favourable risk structure may have a
comparatively high fi nancial value in early
development (with less pronounced
incremental value increase upon completion
of development milestones), thus balancing
not only productivity but also portfolio value.
The analysis of project risk structure
facilitates the understanding of the impact
of the chosen clinical trial plan and trial
endpoints on risk ( Figure 2 ). Development
risk is infl uenced by the reliability and validity
of individual studies, and by the quality of
development execution. Examples are the
potentially low reliability of encouraging but
small pilot studies that may carry forward risk
into later stages of development, leading to
unexpected late stage failures. If trial results
remain unclear, development may be
terminated because additional investments and
further trials would delay launch to an extent
that the value proposition is lost. If the
expected knowledge gain of particular trials
and its impact on the level of confi dence in
Value-driven project and portfolio management in the
pharmaceutical industry
© 2008 PALGRAVE MACMILLAN 1462-8732 J O U R N A L
O F C O M M E R C I A L B I OT E C H N O L O G Y. VOL
14. NO 4. 307–325 OCTOBER 2008 313
COST (EUR mill.)* ; probability of success
discount rate: 10%
tax rate: 40%
Peak
sales
(EUR
mill.)
Years to
peak Preclin Ph I Ph II Phase III Reg Phase IV
CMC/
Product
devel.
Marketing
(year of
launch)
% sales
reduction
in year of
patent expiry
Phase II/III
Added value generic 250 5 3 6 44 39 - 5 38 -
90% 85% 85% 90%
Standard product 500 5 7 9 22 98 66
5% of peak sales
(years 1-5 after
launch)
13 125 75%
70% 75% 60% 80% 95%
Blockbuster product 3,000 7 7 10 32 258 452
5% of peak sales
(years 1-5 after
launch)
13 450 90%
45% 60% 35% 65% 90%
Launch
Value
(EUR million)
103
163
272
577
1,001
214
261
376
635
145
357
734
2,608
5,664
3
6
44
7
9
22
98
7
10
32
258
0%
10%
20%
30%
40%
50%
60%
70%
80%
90%
100%
Development Stage
P
ro
b
a
b
il
it
y
o
f
L
a
u
n
c
h
Preclin Phase I Phase II Phase III Reg
Cost per stage
(EUR million)
Value
(EUR million)
103
163
272
577
1,001 1,315
214
261
376
635
806
7,326
145
357
734
2,608
5,664
3
6
44
7
9
22
98
7
10
32
258
Added value generic
‘Standard’ product (validated
MoA, incremental innovation)
1st in class (blockbuster,
breakthrough innovation)
Figure 2 : Portfolio risk structure. R & D projects can be
classifi ed according to risk / cost / value
characteristics. For the three examples shown, both overall
probability of success and risk structure is
different. (a) shows three examples of development projects
with different risk structures: (1) Innovative
NCE ( ‘ breakthrough innovation ’ ): high risk, high cost,
blockbuster potential; (2) ‘ Standard ’ product
( ‘ incremental innovation ’ ): for example, a product of a class
with clinical PoC; moderate development
risk, moderate development cost, moderate sales potential; (3)
Added value generic (generic with added
benefi ts through, eg, innovative formulation): low risk and
cost, low to moderate sales, faster
development. (b) illustrates the expected fi nancial value, the
probability of launch, and the cost per stage
of the projects at particular development milestones. For
example, a project with low risk and fast
development may have a higher fi nancial value in early
development than a highly innovative project,
emphasising the impact of risk structure on value. The expected
value uptake of the latter is, however,
much more pronounced when risk is resolved through the
completion of milestones. Innovative projects
usually experience their highest relative value uptake after
successful PoC, whereas the value uptake of
clinically validated development candidates or value-added
generics is less pronounced at PoC. Value
uptake profi les may also vary depending on the chosen clinical
development strategy and the unique
selling proposition to be established. Taking into account the
effects of projects with different risk
structures, R & D portfolios may be designed to achieve
optimum productivity and diversifi cation. Analysis
of the risk / cost / value structure of individual projects
facilitates proactive portfolio planning with respect
to overall portfolio value, effi cient resource allocation, and
sustained growth.
Bode-Greuel and Nickisch
© 2008 PALGRAVE MACMILLAN 1462-8732 J O U R N A L
O F C O M M E R C I A L B I OT E C H N O L O G Y. VOL
14. NO 4. 307–325 OCTOBER 2008314
forthcoming development stages is analysed,
the understanding of risk along the sequence
of clinical trials will be enhanced.
Commercial analysis and sales forecast
In fully integrated corporations, commercial
analyses and sales forecasts are usually
provided by (strategic) marketing.
Representatives of the portfolio management
function sometimes generate sales forecasts
for projects that have not yet passed PoC or
that are of low priority. In such cases, it is
advisable to seek alignment of the key
assumptions with marketing to ensure their
buy-in.
Assuming contemporary forecasting
capabilities (see below), the major issue of
value-driven management is the proper
alignment of commercial expectations with
the planned R & D activities and clinical trials.
Furthermore, project managers and decision
makers benefi t from investigations how
product sales may change if uncertain trial
outcomes move to the optimistic or
pessimistic direction, related to the likelihood
of the respective scenarios. As outlined above,
the TPP / MPP is a valuable tool to facilitate
the establishment of trustworthy forecasts and
expected sales scenarios.
As a consequence of the translational
medicine approach, more and more
companies choose an organisational model
that separates research and early development
until POC from full development. As a
consequence this leads also to a split of the
portfolio management function. In such cases
there is a tendency of initiating quantitative
fi nancial project evaluation only after PoC.
This is different from portfolio management
practice in the 1990s, when a development
project was nominated with the start of
preclinical development and its fi nancial value
analysed. Signifi cant decisions with respect
to the therapeutic indication and the
development strategy are sometimes already
made before the defi nition of the PoC
programme, as they infl uence its objectives
and design. If TPPs and quantitative analyses
are established only thereafter as prerequisite
for the ‘ full ’ development decision, it may
turn out that data generated earlier do not
support a competitive value proposition.
However, with a longstanding business
experience of the company in the targeted
disease areas, marketing input to early R & D,
and a broader set of clinical options tested, it
may be adequate to initiate market analyses
and fi nancial evaluation only after PoC.
Productivity analyses of the
biopharmaceutical industry indicate that
approximately 20 % of project terminations in
Phases II, III, and registration are based on
commercial and strategic considerations. 13,14
A signifi cant fraction of these late terminations
could potentially be avoided by conducting
quantitative evaluation and market research
earlier. The value of sales forecasting before
PoC is sometimes questioned, as it is entirely
based on assumptions. If, however, TPPs and
MPPs are suffi ciently detailed and respected in
development, they represent blueprints of the
future product, because R & D will be directed
towards proving the claims. In essence,
uncertainty would only materialise as more
positive product and market scenarios, as
outcomes below MPP level should lead to a
termination of development. The uncertainty
of assumptions and their impact on overall
results can be quantifi ed and illustrated by
various techniques. Companies who apply
forecasting to early projects also appreciate
its educational effect, because the relation
between criteria defi ned in TPPs and their
expected impact on sales becomes transparent.
The following three approaches to the
evaluation of the market potential can be
applied in early R & D at a moderate cost:
i. Sales forecasts based on desk research :
Commercially available reports on
disease prevalence and incidence and
market segmentation enable an estimate
of patients available for treatment. Data-
bases provide information about pipeline
products and facilitate a judgment of
Value-driven project and portfolio management in the
pharmaceutical industry
© 2008 PALGRAVE MACMILLAN 1462-8732 J O U R N A L
O F C O M M E R C I A L B I OT E C H N O L O G Y. VOL
14. NO 4. 307–325 OCTOBER 2008 315
forecast by market research reduces the risk of
pursuing development strategies that prove to
be commercially unattractive in late
development.
Financial project evaluation
The NPV algorithm is a generally accepted
approach to the fi nancial evaluation of
investments in the pharmaceutical industry,
and it is also used in R & D portfolio
management. 6 – 8,15 Originally, the NPV
algorithm has been developed for ‘ static ’
investments where managerial actions have
virtually no impact on value. As described
above, the situation is different for the
development of new drugs. Investment
decisions are made stepwise along
development milestones, while assumptions
are made about the cost, duration, and
probability of success of individual milestones.
NPV calculations that refl ect the milestone
and risk structure of projects are therefore
more useful. Many companies report to apply
‘ risk-adjusted ’ or ‘ expected ’ NPV models,
while it is not always disclosed whether such
models include the probabilities per individual
milestone or only the overall probability of
launch. The ‘ augmented NPV ’ model 15
incorporates the probability of success at
individual milestones and the option to
minimise losses by terminating development if
unfavourable results occur. While being built
on the decision tree, the evaluation does not
only include the overall probability of success
but also adequately refl ects the risk structure
of projects. Therefore, the augmented NPV is
sensitive to changes in the development plan
if they affect the project ’ s risk structure.
Augmented NPV refl ects the present value
of the project. In addition, this fi nancial
algorithm can be used to determine the
potential future value of projects and
portfolios assuming that subsequent milestones
would be completed successfully. Project
prioritisation decisions could refer to the
relative and absolute value gain that the
completion of a milestone of a particular
their competitiveness. Information of
the pricing environment and dynamics
enable an assessment of a potential price
range for the new drug. The uncertainty
of assumptions can be analysed using
Monte Carlo simulation which, however,
is not regularly applied in pharmaceutical
companies at present. Tornado diagrams
illustrating the results of one-way
sensitivity analysis are often preferred
over simulations as they are more
illustrative.
ii. Focused market research : Interviews with
key opinion leaders, experts, and health-
care providers yield valuable informa-
tion in early development, as physicians
and insurances may adopt a much more
pragmatic perspective towards drugs that
scientists consider highly innovative. In
addition, opinions may signifi cantly
differ across the countries. Such
information is used to refi ne the desk
research-based forecast.
iii. TPP conjoint analysis : In early R & D,
conjoint analysis is an ideal tool to
investigate physicians ’ attitudes towards
(potential alternative) TPPs. Conjoint
analyses are statistically relevant trade-off
analyses in which physicians weight
the relative importance of particular
product attributes including price
(if information on a feasible price range
is particularly relevant, the conjoint
analysis could include further customers,
such as, eg insurers, formulary com-
mittees, or HMOs). In early R & D, this
analysis allows investigating whether a
TPP or MPP is competitive and focuses
on attributes that drive the choice of
products. The analysis provides pref-
erence shares for alternative TPPs or
products. Thus, TPP conjoint analyses
facilitate the defi nition of robust TPPs.
In summary, building a desk research-based
sales forecast reveals the relevant issues that
may lead a product to market success or
failure. Further enhancing the reliability of the
Bode-Greuel and Nickisch
© 2008 PALGRAVE MACMILLAN 1462-8732 J O U R N A L
O F C O M M E R C I A L B I OT E C H N O L O G Y. VOL
14. NO 4. 307–325 OCTOBER 2008316
project would yield, in relation to its
respective cost and probability of success.
Furthermore, such analyses provide an
optimum basis for license contracts with
option elements, and for investors ’ decisions
regarding exit strategies.
Option pricing algorithms based on risk-
neutral valuation are also investigated for their
applicability to R & D projects. 16,17 The major
argument is that it can be concluded from
fi nancial theory that discounting in option
pricing models would better refl ect the
optionality of such projects. So far, there is no
fi nal consensus among scientists and
practitioners about the validity and advantages
of option pricing methods compared to
augmented NPV, and there is evidence that
the results of both approaches converge and
lead to similar conclusions if private risk is
refl ected adequately. 17,18 This and the absence
of experience with this abstract valuation
algorithm have prevented its widespread
implementation.
Development portfolio
management
Most pharmaceutical companies apply a
regular and systematic approach to review
their portfolio of development projects. This
is undertaken once or twice per year. The
portfolio review usually comprises both
qualitative and quantitative evaluations of
individual projects ( Figure 3 ). Common
qualitative parameters are strategic fi t and
degree of innovation, while quantitative
parameters include NPV and expected value
uptake, project productivity (ie augmented
NPV divided by risk-adjusted costs),
(risk-adjusted) sales, probability of launch,
time to launch, and (risk-adjusted) cost.
Strategic
fit
Augmented (risk-adjusted,
probabilistic) NPV
Probability of develop-
ment success
Expected value uptake by
development milestone
Project
productivity
Expected near term and
overall sales growth
Budget and
capacity
Portfolio
value and productivity
Portfolio
risk structure
Project
analysis
Portfolio
analysis
Feasibility
Optimize
Value per investment
Value at a comfortable level of portfolio risk
Pipeline
Degree of
Innovation
Pipeline
characteristics
Figure 3 : Commonly applied portfolio management
metrics and criteria. Portfolio decisions in
pharmaceutical R & D are usually built on both quantitative and
qualitative criteria such as those shown
above. From a purely fi nancial perspective, one would rank
projects according to expected NPV and
optimum productivity. This, however, ignores that future
corporate growth requires a balanced pipeline
which also includes early stage projects with lower expected
NPVs. Furthermore, capacities need to be
available and can usually not be allocated freely. Another issue
is balancing portfolio risk to ensure that
productivity goals are met. A proper strategic framework
outlining growth and productivity goals and
the therapeutic area focus serves as guidance for portfolio
decisions. Effective data analysis tools
facilitate the evaluation which combinations of projects would
maximise value, sales growth, or the
number of new launches. In addition, companies are currently
establishing tools for capacity management
to investigate more thoroughly which portfolio scenarios would
be practically feasible.
Value-driven project and portfolio managemen t in the
pharmaceutical industry
© 2008 PALGRAVE MACMILLAN 1462-8732 J O U R N A L
O F C O M M E R C I A L B I OT E C H N O L O G Y. VOL
14. NO 4. 307–325 OCTOBER 2008 317
Data quality can be further enhanced by
a comparative look across projects at the
assumptions made in the evaluation. In larger
companies, this may be most practical for
projects within therapeutic areas. The major
focus should be on validity and consistency
among the probability estimates in
development and on the assumptions
underlying the sales forecasts. Ideally, the
review process would involve senior function
managers. This has two advantages:
1. input of senior expertise may improve the
quality of the data and cross-project
consistency and
2. the involvement of senior management in
the portfolio evaluation process builds the
basis for acceptance of valuation results in
the prioritisation discussion.
Interactive decision making as prerequisite for
proper prioritisation decisions
There is no single optimal portfolio,
alternative solutions are usually feasible.
Project scoring methods leading to
While there is common agreement
on portfolio management metrics in
development, there are differences in the
portfolio management process and in the
preferences for particular project value
indicators. For example, some companies
establish quantitative project analyses only
after PoC, while others start earlier.
Furthermore, some perform a project-per-
project review with little emphasis on
cross-project comparisons, while many use
templates displaying two or three value
dimensions across projects in order to
facilitate project prioritisation decisions.
Data validation and buy-in of senior
management
If experts and project teams evaluate their
own projects they may be subjective and
sometimes overly optimistic. Subjectivity can
be balanced effectively when the project
evaluation meetings are moderated by an
experienced individual, for example, a
representative of the portfolio management
function who has no stake in particular
projects ( Figure 4 ).
Senior Management Review
of Key Assumptions
Portfolio Management Workshop
Communication to Functions
Capacity Allocation
Project Prioritization
Portfolio Optimization
Decision Tree
Meetings
Marketing
Meetings
DRAFT Project Evaluation
Finalization of Project and Portfolio Models
Potential re-iterations depending
on senior management input
Potential re-iteration if capacity
constraints become apparent
Figure 4 : Portfolio management process in fully
integrated companies. The evaluation of development
milestones and probabilities ( ‘ decision tree meetings ’ ) and
the commercial analysis ( ‘ marketing meetings ’ )
of individual projects is usually performed on the project team
level. A senior management review of
the key assumptions across projects facilitates the establishment
of valid and consistent assumptions. As
capacity constraints may limit the operational execution of
portfolio decisions, effective communication
and interaction with functions facilitates the translation of
project prioritisation decisions into feasible
actions.
Bode-Greuel and Nickisch
© 2008 PALGRAVE MACMILLAN 1462-8732 J O U R N A L
O F C O M M E R C I A L B I OT E C H N O L O G Y. VOL
14. NO 4. 307–325 OCTOBER 2008318
computated project ranking lists have
therefore not found general acceptance.
Instead, portfolio review meetings benefi t
from thorough interactive discussion and the
consideration of alternative prioritisation
solutions. Corporate strategy leaves room for
interpretation, decision makers ’ risk
preferences may differ, and keeping the
balance between short- versus long-term value
propositions or new project versus lifecycle
management investments is often a matter of
diverging opinions. Therefore, robust
portfolio decisions are best achieved in an
interactive way. Individual opinions and
attitudes of the participants become
transparent. This paves the way for consensus
and compromise that increases the chance that
decisions are respected and translated into
action on the operational level.
Understanding evaluation results that
comprise a set of parameters related to a set
of projects is a complex pattern recognition
task. The discussion strongly benefi ts from
moderation by a representative of portfolio
management who supports the participants
to achieve a balanced view.
Analysing an existing portfolio is a bottom-
up approach that usually comprises the
elements described below:
i. Evaluation of the overall pipeline with
respect to the distribution of projects
across development stages and the
frequency of expected future launches;
identifi cation of gaps.
ii. Prioritisation of projects based on
multiple criteria: In a fi rst step, par-
ticipants may agree on the ranking
of projects with respect to individual
criteria. Projects may rank high or low
for different reasons, such as, for exam-
ple, value, risk profi le, time to market, or
sales volume. In a subsequent step, overall
project priorities are defi ned. In addition
to the criteria representing value, strate-
gic and operative aspects may be relevant
for the prioritisation of projects. Care
is taken that not only late stage / high
value projects are assigned high priority,
because a systematic under-resourcing of
early stage projects would result in late
stage projects with short patent life and
unfavourable profi le. Effi cient software
tools can facilitate the investigation
of alternative project prioritisation
options that may, for example, differ
with respect to maximising productivity,
maximising near or mid-term sales
growth, or minimising portfolio risk.
iii. Identifi cation of projects with fi rmly
assigned resources, identifi cation of
remaining budget and capacities that
will potentially be subject to reallocation.
Depending on the size of the corporation,
prioritisation decisions are either made across
the whole portfolio or within business units
or therapeutic areas. The latter model would
require a corporate body that assigns resources
to individual business units according to their
relevance for the entire corporation.
Preference for a ‘ fractionated ’ approach to
project prioritisation usually depends on the
overall number of projects and the corporate
culture.
An effective portfolio management process
also requires reporting procedures to follow
up actions taken upon decisions at the
operational level. This facilitates establishing
a culture of value-driven management.
Capacity management
An often underestimated prerequisite of
successful portfolio management is appropriate
capacity management. 19 The best portfolio
management system cannot prevail if there is
a signifi cant gap between available and needed
capacities.
The consequence of a lack of a capacity
management system is not only that more or
less all projects get delayed but also that the
priority decisions are made on the working
level, based on individual judgment and
personal relationships.
In prioritisation decisions in portfolio
review meetings, the ranking should not just
Value-driven project and portfolio management in the
pharmaceutical industry
© 2008 PALGRAVE MACMILLAN 1462-8732 J O U R N A L
O F C O M M E R C I A L B I OT E C H N O L O G Y. VOL
14. NO 4. 307–325 OCTOBER 2008 319
process as an iterative business process, the
links to corporate strategy for getting strategic
directions and with project management for
appropriate execution appear to be most
important. Furthermore, an effective
organisational link to business development
would also be relevant as portfolio analysis
indicates which in-licensing candidates and
R & D partnerships would ideally complement
the internal assets.
In larger multinational organisations
composed of strong and relatively autonomous
business units covering particular therapeutic
areas, the portfolio management process might
be broken down in an inner business unit and
a corporate portfolio management process.
Observational evidence suggests that the
most effective organisational model is one in
which the portfolio management function is
closely linked to the strategy and project
management function, jointly reporting to
either the CEO or another Board member
that is neither responsible for R & D nor for
commercial. Merck Serono is currently
implementing such a model in order to
enhance the cross-functional management of
R & D and to improve alignment of portfolio
decisions with strategic goals: all functions,
along with portfolio management and business
development, are represented in the new
Executive Management Board reporting to
the CEO. 20
PORTFOLIO MANAGEMENT
IN RESEARCH AND EARLY
DEVELOPMENT
Not so long ago there was the general belief
in the industry that research was hardly
manageable and that portfolio management
techniques were just not suitable for the
discovery process. Arguments given were that
changes in research direction would create a
slowdown in productivity because the skill set
is not readily transferable, the fi nancial value
of projects could not properly be determined
so early and that serendipity would play a
major role anyway. 21
depend on the potential economic benefi t but
also on the needed capacities to reach the
goal (R & D effi ciency).
Portfolio management in different
organisational systems
As with all new management concepts the
organisational introduction of a portfolio
management function has to be seen in the
context of the overall organisational model
that the respective company applies.
The portfolio management process involves
the entire R & D organisation and all
commercial functions. In most organisations,
R & D and Marketing & Sales are represented
on the Board level by different individuals.
Therefore, the fi rst question companies need
to address is to which corporate body the
portfolio management function should report.
In principle, three organisational models are
possible and as a matter of fact are found in
certain companies.
Either the portfolio management function
reports to:
Head of R & D
Head of Commercial
CEO / Head of Strategy, etc
All models could be feasible, but they face
different challenges in practice.
As R & D and commercial functions are
equally involved in the portfolio management
process, the fi rst two organisational models
are complicated by the requirement that one
stakeholder reports into the other. This could
raise bias concerns given that very often
R & D and commercial are different in their
perspectives. This issue is avoided by a model
where the portfolio management function
reports either directly to the CEO or to
another Board member responsible for, for
example, corporate strategy or business
development.
Another aspect that needs consideration
is with which other functions portfolio
management needs to collaborate. Given the
very nature of the portfolio management
•
•
•
Bode-Greuel and Nickisch
© 2008 PALGRAVE MACMILLAN 1462-8732 J O U R N A L
O F C O M M E R C I A L B I OT E C H N O L O G Y. VOL
14. NO 4. 307–325 OCTOBER 2008320
Whereas past efforts focused mainly on
decreasing the time to reach the next
milestone and fi nally the time of launch it can
be questioned whether further reductions in
development time are still feasible with
reasonable efforts. The emphasis is shifting
towards infl uencing attrition rates favourably,
either by improving the quality of R & D
execution or at least by terminating projects as
early as possible by optimised decision
making. 13 Doing things right is no longer
enough, doing the right things becomes the
rule of the game.
This paradigm shift is currently increasing
the awareness that portfolio manage ment
techniques could contribute signifi cantly by
ensuring that:
Portfolio value increases – by killing low
value and unproductive projects early
Portfolio risk is well balanced – by
working on an appropriate ratio of
validated and non-validated targets
Research targets support the franchise
strategy – by defi ning a franchise
strategy
Prerequisites for portfolio
management in research and
early development
As for development, there is one very
important prerequisite for the successful
introduction of portfolio management in
research – a proper strategic framework.
Furthermore, tools applied in development
portfolio management, such as, for example,
the stage gate decision process, TPPs, and
time line, budget, and risk analysis are
increasingly used in early R & D.
TPPs in early R & D
TPPs in discovery research outline the
pharmacological, safety, and technical profi le
required for compounds to enter clinical
development. Fulfi lling such predefi ned
criteria would create reasonable confi dence
that the optimal drug has been selected and
•
•
•
that clinical trials can succeed. TPPs in
research and development that are well
aligned with each other and with strategic
objectives in a cross-functional process serve
as ideal tool to manage the interfaces
between discovery research, development,
and marketing.
Evaluation of individual projects along a
stage-gate decision process
For the drug research process the following
phases can be defi ned: target selection, assay
design, lead discovery, lead optimisation, and
candidate profi ling (also called preclinical
development, required for entry into man),
see Figure 5 .
Every project needs to be evaluated at the
end of each phase based on the achieved data.
A set of milestone criteria is defi ned according
to the TPP that must be fulfi lled to let the
project move into the next phase. Some of
the go / no-go criteria may be quantitative like
affi nity and selectivity of a compound for
particular receptors, others may be more
qualitative, like competitive edge versus
competitors or attributes for which no
validated animal models might be available. As
in advanced development, a stage-gate process
only for individual project decisions would,
however, fail. With the decision to move a
project into the next phase a certain amount
of resources, either internal or external, is to
be allocated. It has to be made sure that these
resources are not already utilised by other
projects the organisation is working on.
In case bottlenecks are determined,
debottlenecking strategies need to be
developed or clear prioritisation decisions
have to be made for the entire portfolio.
Regardless of the capacity issue,
what appears to emerge as best practice
in early R & D is that individual compounds
are considered from the perspective of
the selected pathway in comparison to
other targets under investigation for the
respective disease area. Trade-off decisions
are made to optimise the entire franchise
portfolio.
Value-driven project and portfolio management in the
pharmaceutical industry
© 2008 PALGRAVE MACMILLAN 1462-8732 J O U R N A L
O F C O M M E R C I A L B I OT E C H N O L O G Y. VOL
14. NO 4. 307–325 OCTOBER 2008 321
TPP risk : Risk that the compound will
not meet the specifi ed effi cacy and safety
targets of the TPP.
Competitive risk : Risk that the predefi ned
TPP will not create a differentiated
product with a unique selling proposition.
Companies may apply a scoring model that
provides an overall judgment of project risk.
Recently, some discovery organisations made
favourable experience with decision tree
analysis, allocating probabilities of success to
each milestone of the stage gate model based
on the criteria used for go / no-go decisions. 23
Probability assessments also enable the
establishment of a pipeline model for
discovery research, indicating the expected
number of compounds entering Phase I or
completing PoC per unit of time, related to a
defi ned budget and capacity. Pipeline models
in research have proven to be extremely
useful in managing and monitoring
productivity and performance in early R & D.
Financial evaluation
At present, there appears to be a general
agreement in the pharmaceutical industry that
it does not make sense to do detailed fi nancial
•
•
Project risk analysis
While there is a lot of experience with
project risk analysis in drug development,
systematic risk and probability analysis is less
established in drug discovery. It has been
particularly diffi cult for project teams in
discovery research when they worked on
innovative targets in the absence of any
reference data. Since recently, industry
benchmarks are also available for the drug
discovery stage, referring to the stage-gate
decision model. These benchmarks have
become particularly useful as many companies
adopted the stage-gate research process.
In some disease areas, commonly accepted
animal models are available that are to a
certain extent validated for their predictivity
of effi cacy in man.
To characterise the risk profi le of individual
projects, the following risk dimensions are
evaluated:
Compound risk : Risk that the compound
will fail due to defi ciencies of the specifi c
molecule.
Mechanism risk : Risk that the biochemical
mechanism does not work in
pharmacological models and in man
as expected.
•
•
Assay
design
go
stop
Lead
discovery
go
Candidate
profiling
(preclin. dev.)
go
stop
Phase I
go
stop
Lead
optimization
go
stop
stopTarget
selection
Figure 5 : Stage-gate decision process in discovery
research. Many companies have implemented a
stage-gate decision process in drug discovery and manage their
research along milestones such as those
indicated above. Some companies have recently implemented an
organisational model in which the
responsibility of discovery research extends up to PoC. As in
clinical development, go / no-go criteria are
defi ned for each milestone according to the TPP that must be
fulfi lled to continue research. Companies
usually set time lines for the achievement of milestones.
Discovery research is nowadays also covered
by benchmark initiatives which provide average success rates,
time lines, and resources used per
milestone.
Bode-Greuel and Nickisch
© 2008 PALGRAVE MACMILLAN 1462-8732 J O U R N A L
O F C O M M E R C I A L B I OT E C H N O L O G Y. VOL
14. NO 4. 307–325 OCTOBER 2008322
analyses in the research stage. The main
argument is that at this point effi cacy and
differentiability might not have been
established and that the effective dose in man
and the COGS are not known. What is
used instead is a kind of ranking based on
epidemiology and market data, leading to
an estimate of the sales potential:
High economic value >1bn US $
Moderate economic potential
>500m < 1,000m US $
Low economic potential < 500m US $
The resulting conclusions will depend
on the company ’ s commercial situation,
with larger organisations defi ning cut off
numbers under which a further development
does not appear to be appropriate, and
projects may be terminated only for
commercial reasons.
There are circumstances in which full
NPV analyses are performed in early R & D.
For example, companies establish detailed
fi nancial models in licensing situations.
Biotechnology companies benefi t signifi cantly
from quantitative fi nancial evaluation for early
stage projects, as these create a rational basis
for fund rising and licensing purposes,
especially if risk is explicitly addressed and
quantifi ed. Thus, biotechnology companies
often establish more detailed and precise
quantitative modelling for early projects than
pharmaceutical companies, which sometimes
even comprises primary market research.
NPV analyses are also applied during the
discovery to PoC stage in fully integrated
pharmaceutical companies. In research
portfolio management, such analyses allow
to quantify the contribution of early research
to the overall R & D value chain. In addition
to using the number of drugs entering
clinical development or completing PoC as
productivity measure, the value added by
completing individual preclinical milestones
can be quantifi ed based on the augmented
NPV model. 15 It is used to demonstrate the
fi nancial benefi t of investing in particular
•
•
•
projects and to identify the value drivers in
early R & D.
Research portfolio evaluation
Besides the gating decisions for individual
projects that should be done as soon as the
required data are available, it is common
practice to review all projects every 6 – 12
months. 19 In such reviews projects compete
with each other. The primary focus of review
meetings is to have a holistic view of the
whole portfolio. The number of projects in
the different phases of research is evaluated
in order to make sure that the overall
productivity targets are met. In addition, these
meetings serve to analyse whether the overall
portfolio risk profi le, for example, the ratio of
validated to unvalidated targets, is as intended
and whether the research projects are properly
aligned with the agreed company or business
unit or franchise strategy. It is very important
that if in such meetings the projects from
different research sites are compared, a
common understanding is established on how
to measure progress, how to set standards and
how to defi ne milestones.
Beyond evaluating individual projects,
an assessment of the status of the different
franchises can be done. Issues of
competitiveness, ways to improve strategically
and operationally need to be addressed
regularly.
Scoring methods
At present, most research organisations have
established scoring systems for portfolio
evaluation. Although it appears that every
company has developed a specifi c set of
criteria along which their projects are rated
there appears to be common sense that at the
following items should be covered:
Value : Scoring around market size,
attractiveness, and competitiveness; if
NPV models are established, parameters
such as NPV and the realised or future
expected value uptake upon successful
•
Value-driven project and portfolio management in the
pharmaceutical industry
© 2008 PALGRAVE MACMILLAN 1462-8732 J O U R N A L
O F C O M M E R C I A L B I OT E C H N O L O G Y. VOL
14. NO 4. 307–325 OCTOBER 2008 323
the highest number of priority ratings per
project. One inherent problem of scoring
systems but also of predefi ned milestone
decisions is that projects are compared
against a minimal acceptable standard to
move forward. These tools do not take into
account the overall capacity available.
Portfolio risk evaluation
One of the primary goals of portfolio
management is to ensure that the portfolio is
well balanced with respect to the potential
risks and rewards. Experience has shown that
focusing exclusively on ‘ me toos ’ is as
dangerous as only concentrating on very
exciting but unvalidated targets. There is
no single optimal portfolio throughout the
industry. Every organisation has to defi ne the
level of risk that optimally supports the
strategy. As the strategy gets reviewed from
time to time so has the risk profi le of the
research portfolio to be adapted from time
to time.
In order to characterise the overall portfolio
risk structure, research projects could be
classifi ed along the following groups:
Pioneer : No known competition.
Novel : Other companies work on the
same target but target is not validated in
man.
Back up : In-house programme exists in
development for same target.
Fast follower : Target has been validated
in the clinic by another company.
Me Better : Pursuing a target that other
companies have already successfully
launched.
It is quiet obvious that the more pioneer
projects a company pursues the more risky
the portfolio becomes. If probabilities of
success are determined for project milestones,
pipeline models as described above can serve
as highly educational tools to monitor project
and portfolio risk and past and expected
future productivity.
•
•
•
•
•
completion of milestones are included
as value indicators.
Cost : High, medium, low, either for
research cost alone, or including
development cost.
Timing : Time to entry into clinical
development / PoC / launch, expected time
per milestone.
Strategic fi t : Score against therapeutic area
strategy.
Risk / probability of success : Scoring against
TPP and milestone criteria.
Some other organisations apply a larger range
of criteria and rate every item with high,
medium and low. Potential meaningful
criteria are:
Innovation potential
Specifi city
Effi cacy
Tolerability
Appropriate early clinical PoC / availability
of biomarkers
Preclinical feasibility
Clinical feasibility
Degree of unmet medical need
Competitiveness
Number and categories of competitors
Patent status
Peak sale potential
Potential follow-on indications
Although good arguments can probably be
given for any of these criteria, the experience
speaks for using as little as possible items
because the likelihood that the scoring system
does not provide enough differentiation
between the projects increases with the
number of criteria used. This is particularly
true for the middle of the ranking. 19
If the scoring system were used for
prioritisation decisions, the so-called ‘ forced
ranking approach ’ should be applied. All
potential pairs of projects are compared
against each other and the higher prioritised
project is determined, respectively. At the end
the project portfolio is ranked according to
•
•
•
•
•
•
•
•
•
•
•
•
•
•
•
•
•
Bode-Greuel and Nickisch
© 2008 PALGRAVE MACMILLAN 1462-8732 J O U R N A L
O F C O M M E R C I A L B I OT E C H N O L O G Y. VOL
14. NO 4. 307–325 OCTOBER 2008324
SUMMARY
Modern portfolio management techniques can
play an instrumental role in enhancing the
overall productivity of pharmaceutical R & D.
The fact that portfolio management has been
applied for some time by the major
pharmaceutical companies while productivity
did not increase is no disproof for the
statement because the productivity crisis has
many facettes, and productivity might have
been even worse without portfolio
management. In addition, portfolio analysis
does not automatically result in objective
and rational management decisions.
The portfolio management process needs
to be cross-functional, involving the entire
organisation. It requires the discipline to
develop and constantly apply a set of tools in
order to allocate the scarce resources to the
most promising projects. Keeping portfolio
management alive and effective vis- à -vis
corporate reorganisations and scientifi c
paradigm shifts is a continuous organisational
effort.
Emphasis should be given to the following
items:
Defi ne the business strategy and align the
entire organisation behind it.
Develop and constantly update a TPP for
every project.
Defi ne clear go / no-go criteria for every
milestone.
Set up a tool to evaluate the potential
value of all projects either through in-
depth fi nancial analyses for later stage
projects or based on a semi-quantitative
scoring system for earlier projects; do
quantitative fi nancial modelling for early-
stage projects to investigate the expected
value uptake upon successful completion
of milestones and to facilitate licensing
negotiations.
Install a capacity management system
in order to avoid a disparity between
available resources and the number
of projects. In case there is a lack in
capacity, be ready to make tough choices
•
•
•
•
•
and terminate the projects with the lowest
value as early as possible.
The organisational embedment of the
portfolio management function needs special
consideration. An organisational model in
which the portfolio management function
could closely collaborate with the corporate /
business unit strategy function and the project
management function appears to be most
appropriate in the authors ’ experience to help
increasing effectiveness and effi ciency in the
overall drug development process.
References
1 . Cervantes, M. (2004)
www.AutomotiveForums.com,
12 August .
2 . USA Today (15th September, 2005) .
3 . Borman , S . ( 2006 ) . Improving effi ciency
. Chem. Eng.
News 84 (25) , 56 – 78 .
4 . Sharpe , P . & Keelin , T . ( 1998 ) .
How Smith Kline
and Beecham makes better research allocation
decisions . Harvard Bus. Rev. , March – April, 5 –
10 .
5 . Slater , S . & Zwirlein , T . ( 1992 ) .
Shareholder value
and investment strategy using the general portfolio
model . J. Manage. 16 , 717 – 732 .
6 . Seget , S . ( 2005 ) . Pharmaceutical project
and
portfolio management – Effective organization and
decision making . Business Insights , Business Insights
Ltd .
7 . Ahmed , N . ( 2005 ) . Effective portfolio,
project
management, and resource allocation for enhanced
competitiveness , presented at Drivers, Roles And
Challenges of Portfolio and Project Management in
Pharmaceutical Industry Conference , May 2005,
Brussels .
8 . Heaslip , R . ( 2005 ) . Pharmaceutical
portfolio
management – What’s working, what’s not? DIA
Annual Meeting, June 2005 .
9 . Townson , D . ( 2006 ) . Establishing
portfolio value
metrics , in , 7th Annual Rx and Biotech Portfolio
Management Conference , January 2006, Philadelphia .
10 . www.fda.gov/cder/meeting/riskmanagement.htm .
11 . Bode-Greuel , K . ( 2007 ) . The
management of risk in
pharmaceutical R & D , in , The R & D Management
Conference 2007 , July 2007, Bremen .
12 . www.fda.gov .
13 . Kennedy , T . ( 1997 ) . Managing the drug
discovery/
development interface: can the pharmaceutical
industry reduce attrition rates? Drug Discov. Today
2 (10) , 436 – 444 .
Value-driven project and portfolio management in the
pharmaceutical industry
© 2008 PALGRAVE MACMILLAN 1462-8732 J O U R N A L
O F C O M M E R C I A L B I OT E C H N O L O G Y. VOL
14. NO 4. 307–325 OCTOBER 2008 325
management more effective . Research-Technol.
Manage. , March – April, pp. 18 – 33 .
20 . Kirschbaum , B . ( 2007 ) . Drug discovery
at Merck
Serono – striving for best pharma , in , R & D Leaders ’
Forum , October 2007, Munich .
21 . Nakagaki , P . ( 2001 ) . presented at
Portfolio
Optimization for Pharmaceuticals Conference , November
2001, London .
22 . Zoche , M . ( 2007 ) . Risk assessment of
drug
discovery projects as an integral part of portfolio
management , Thesis for the Master of Science
in Pharmaceutical Medicine, University of
Duisburg-Essen, April 2007 .
23 . Artuso , A . ( 2005 ) . Using decision
analysis and portfolio
management to enhance R & D performance , presented
at Drivers, Roles and Challenges of Portfolio and Project
Management in Pharmaceutical Industry Conference , May
2005, Brussels .
14 . Kola , I . & Landis , J . ( 2004 ) .
Can the pharmaceutical
industry reduce attrition rates? Nat. Rev. , August,
pp. 711 – 715 .
15 . Bode-Greuel , K . & Greuel , J . (
2005 ) . Determining the
value of drug development candidates and technology
platforms . J. Comm. Biotechnol. 11 (2) , 155 – 170
.
16 . Kellogg , D . & Charnes , J . M . (
2000 ) . Real options
valuation for a biotechnology company . Assoc.
Investment Manage. Res. , May/June, 76 – 84 .
17 . Brach , M . A . & Paxson , D . A . (
2001 ) . A gene to
drug venture: Poisson options analysis . R & D
Manage. 31 (2) , 203 – 214 .
18 . Smith , J . E . & Nau , R . F . ( 1995
) . Valuing risky
projects: option pricing theory and decision analysis .
Manage. Sci. , May, 795 – 816 .
19 . Cooper , R . , Edgett , S . &
Kleinschmidt , E . ( 2000 ) .
New problems, new solutions: Making portfolio
Reproduced with permission of the copyright owner. Further
reproduction prohibited without permission.
I. Introduction
A business scorecard (or BSC) is a tool which can produce
many beneficial outputs, if utilized correctly. The BSC, by its
nature, serves as a frame by which firms can create a simple and
straight-forward presentation of multiple aspects of their firm’s
strategy. These components fall into four general categories:
Financial, Customers, Internal Processes and Learning &
Growth. BSC’s can lend a firm an easy to show tool which
illustrates how its strategic approach, implementation, as well
as procedural facets and processes all lay out and are intended
to function. As the card acts as something of a canvas, it lends
a clear “map” of sorts, which empowers both leaders and
employees a “line of sight,” into how the various pieces it
captures interplay with each other.
How? As the BSC is a comprehensive tool, those who use it can
decipher how the firm’s various strategic objectives are not only
constructed, but how they impact each other; this of course also
applies to the outputs tied to each objective as well as overall
productivity.
However, BSC’s are not without their drawbacks. For example,
the BSC, if it meant to operate at a maximum output, must have
buy-in from all members of leadership. A lack of such buy-in
can cause lack of alignment on how the BSC is built, how
effectively it is set up and can cause negative downstream
impacts due to lack of leadership cohesion. In that same vein,
if leadership lacks a clear, unified vision of how the BSC
should be leveraged, not only will the BSC itself not be “set up
for success,” so to speak, but the inevitable outcome will be the
firm will go in an unforeseen direction, this will foster risk
factors and other harmful facets to manifest while the new
strategy is being stood up. Ultimately, a tool intended to create
order and structure may foster chaos and disorder instead.
Ergo, unified vision is critical before a BSC can be properly
built.
A. Financial
In this Value-Driven Project the main objective is to reduce
product cost for the consumer while increasing productivity and
manufacturing. This can be a difficult task but can be done
while utilizing the Balanced Scorecard (BSC) method.
The financial component of the balanced scorecard is certainly
important. It is used as a budgeting tool as the company
forecasts their financials. The BSC requires the entire
management team to make plans beforehand in anticipation for
issues that may arise. Having a financial plan in place could
help mitigate costly mistakes and potentially increase revenue
for teams, such as in research and development, as well as the
costs of drug production. This method also incorporates
performance reviews of both short-term and long-term goals.
A disadvantage I believe would be the time and money it would
take crafting the BSC strategy. This is a value driven project,
and the market is looking for ways to cut cost on drugs for their
consumers as well increase productivity. While precision is key,
proper time management should be the focal point of this
project as well as a well-managed budget.
B. Customer
Who are we as companies and business leaders without our
customers and their perspectives? To discover the answer to this
question, this researcher is going to investigate the importance
of the customer perspective via the balanced scorecard in this
week’s research assignment. Among the critical concepts found
within the customer perspective in a balanced scorecard, this
research investigated the following critical elements as they tie
into the Customer Perspective within the Balanced Scorecard:
· Enhancing personal relationships with customers
· Customer satisfaction
· Customer loyalty – attaining and retaining customers
· Create value – brand, and reputation
Enhancing personal relationships with customers has become
key to the success of business globally as customers now desire
that their voices and opinions be counted. By focusing on
enhanced personal relationships with customers, companies will
create increased value, reduce risks, and find extensive
opportunities to gain and retain customer and brand loyalty
(Branded Customer Service: Implementing the Customer
Perspective of the Balanced Scorecard to the Ranching Industry,
2021). Businesses should carefully align their customer
strategies that are on target with their company goals and
mission statements to gain customers who will remain loyal to
their brand and image.
Customer satisfaction and loyalty go hand and hand in today’s
competitive global markets. Companies that understand their
customer’s perspectives will gain an edge over their competitors
in their ability to meet and often exceed at satisfying their
customers. Today’s customers want both value and timely
deliverance of expected value. The end goal is customer
satisfaction is to maintain a method in which time, quality,
customer experience, cost, and company performance be
measured. This may involve focusing on three key areas:
operations, excellence, and customer relations (Balanced
Scorecard (BSC) – A Strategic Management Tool, 2021).
Companies who focus on valuing their
customersanddeliveringcontinuous value will be successful in
meeting the Customer Perspective in this key element in the
Balanced Scorecard.
Creating Brand and Value comes from a continuous
focus on customer service and customer satisfaction. To
measure their ability to meet their branding and value goal
company’s today often turn to Key Performance Indicators
(KPI’s). These performance metrics were gathered via customer
surveys. And although the goal is to measure brand and value,
these surveys can often provide additional critical data which
can help companies improve their performance. Among the
results we may find the following customer results leading to
new objectives: Overall Satisfaction, Satisfaction Improvement,
Customer Service, Customer Retention, Active and Resolved
Issues, and Arranged Improvement Times (14 Key Performance
Indicators (KPIs) to Measure Customer Service, 2021). Focus
on any or, all the above KPI’s will promote success and
redirection of strategies as needed.
C. Internal Business Process
What processes and methods do we need to define to follow by
our customers and financial goals? That is the question to which
this perspective intends to respond. Here, we need to define the
internal operational objectives and targets or what does the
company needs to set up, and how does the company need to
perform well to enhance the efficiency and its productivity?
Internal operational goals might include like:
· Process enhancements (like reorganization an internal
endorsement process)
· Improving the quality (like lessening manufacturing waste)
· Keep usage to a minimum (utilizing innovation to help
effectiveness). (Agarwal, 2020)
D. Learning and Growth
Our goal is to increase the productivity of the drug
development process (while utilizing Portfolio management)
while making drugs that are cheaper and more affordable. Our
strategic objectives are developing in-house tools for project
efficiency, drive value driven project management and improve
our team members skills sets. Our KPIs (key performance
indicators) for these objectives will be implementing lessons we
have learned, a new learning management system, and we will
conduct quarterly skill set audits to ensure our team members
have gone through the necessary trainings to achieve the level
of success we are aiming for in present and future projects.
The initiatives our team will take are the following. We
will be creating and publishing a lesson learned chart available
to all team members. This will consist of past research projects
so we can use it as a resource for our new research projects. We
can look at this and use our past experiences knowing what
worked and did not work. This will help with delays and
setbacks in R&D. We will use a learning management system
from our in-house training team to ensure our team members are
going through all the same trainings and getting the same
information. We will also guarantee there is buy-in for the value
driven project management. By conducting continued education
of our skills for all team members will make sure we all have
the requirements to successfully achieve our goals of our
current projects and future ones. If there are ever any gaps of
our skills, we will have the continued ed. there to help us out as
well as for our future team members.
II. Conclusion
As the project moves forward into its next milestones, with the
BSC built out and other project documents in process of
crafting, it will be critical for the project teams to ensure the
BSC is created in a unified mindset, with buy-in from all key
stakeholders; further, that if any strategic changes must be
implemented further downstream, that the BSC is updated
accurately to reflect this. Finally, that all team members can
not only see the overall strategy as presented in the BSC, but
how they, themselves fit into the larger vision also.
References
Agarwal, R. (2020). Perspectives in Balanced Scorecard (4
Perspectives).
Retrieved from
https://www.yourarticlelibrary.com/accounting/performance-
measurement/perspectives-in-balanced-scorecard-4-
perspectives/53100
Hans-Ulrich Krause, Dayanand Arora. Key Performance
Indicators for Sustainable Management:
A Compendium Based on the “Balanced Scorecard
Approach.” De Gruyter Oldenbourg; 2019.
Accessed November 5, 2021. https://search-ebscohost-
com.ezproxy.snhu.edu/login.aspx?direct=true&db=nlebk&AN=2
317397&site=eds-live&scope=site
Nunn LG, Marshall T, Brown “Donald” Donnell. Branded
Customer Service: Implementing the Customer
Perspective of the Balanced Scorecard to the Ranching
Industry.Rangelands. 2007;29(2):28-32.
doi:10.2111/1551-501X(2007)29[28:BCSITC]2.0.CO;2
Pramudita, CD. The Balanced Scorecard as Strategic
Controlling Instrument. Introducing the Indicators-
Based BSC for Implementation of a Corporate Strategy from
Four Different Perspectives.
Anchor Academic Publishing; 2016. Accessed November 5,
2021. https://search-ebscohost-
com.ezproxy.snhu.edu/login.aspx?direct=true&db=nlebk&AN=1
412506&site=eds-live&scope=site
Repository.arizona.edu. 2021. Branded Customer Service:
Implementing the Customer Perspective of
the Balanced Scorecard to the Ranching Industry. [online]
Available at:
<https://repository.arizona.edu/bitstream/handle/10150/639694/
12251-11799-1-
PB.pdf?sequence=1&isAllowed=y> [Accessed 7 November
2021].
Small Business Trends. 2021. 14 Key Performance Indicators
(KPIs) to Measure Customer Service.
[online] Available at: <https://smallbiztrends.com/2015/03/how -
to-measure-customer-
service.html#:~:text=%2014%20Key%20Performance%20Indica
tors%20%28KPIs%29%20
to%20Measure,are%20happy%20with%20the%20service%20you
...%20More%2
0> [Accessed 7 November 2021].
Www-sciencedirect-com.ezproxy.snhu.edu. 2021. Sign into your
account. [online] Available at:
<https://www-sciencedirect-
com.ezproxy.snhu.edu/sdfe/pdf/download/eid/1-s2.0-
S0190052807500222/first-page-pdf> [Accessed 5 November
2021].
2 | Page

More Related Content

Similar to © 2008 PALGRAVE MACMILLAN 1462-8732 J O U R N A L O F C O M

Estimate The Impact of Time Savings on Your Drug Development Program
Estimate The Impact of Time Savings on Your Drug Development ProgramEstimate The Impact of Time Savings on Your Drug Development Program
Estimate The Impact of Time Savings on Your Drug Development ProgramCovance
 
final version dissertation
final version dissertationfinal version dissertation
final version dissertationInka Tiono
 
R&D leadership in crisis: rebuilding innovation through people
R&D leadership in crisis: rebuilding innovation through peopleR&D leadership in crisis: rebuilding innovation through people
R&D leadership in crisis: rebuilding innovation through peopleRung Jaismut
 
Pharmaceutical Lifecycle Management Challenges - Slides from Pharmaceutical P...
Pharmaceutical Lifecycle Management Challenges - Slides from Pharmaceutical P...Pharmaceutical Lifecycle Management Challenges - Slides from Pharmaceutical P...
Pharmaceutical Lifecycle Management Challenges - Slides from Pharmaceutical P...IHS
 
New Product Planning Strategies to Ensure Organizational Robustness for Launch
New Product Planning Strategies to Ensure Organizational Robustness for LaunchNew Product Planning Strategies to Ensure Organizational Robustness for Launch
New Product Planning Strategies to Ensure Organizational Robustness for LaunchAnthony Russell
 
Whitepaper-Maximizing-the-Success-of-Your-CRO-Partnerships
Whitepaper-Maximizing-the-Success-of-Your-CRO-PartnershipsWhitepaper-Maximizing-the-Success-of-Your-CRO-Partnerships
Whitepaper-Maximizing-the-Success-of-Your-CRO-PartnershipsTim Calvert
 
ValeriaPiras_NYUCapstone_PharmaM&AComm
ValeriaPiras_NYUCapstone_PharmaM&ACommValeriaPiras_NYUCapstone_PharmaM&AComm
ValeriaPiras_NYUCapstone_PharmaM&ACommValeria Piras
 
1st Riyadh Marketing Club (Introduction to Business Development Management) ...
1st  Riyadh Marketing Club (Introduction to Business Development Management) ...1st  Riyadh Marketing Club (Introduction to Business Development Management) ...
1st Riyadh Marketing Club (Introduction to Business Development Management) ...Mahmoud Bahgat
 
1) strategic planning process
1) strategic planning process1) strategic planning process
1) strategic planning processket0987
 
1) strategic planning process
1) strategic planning process1) strategic planning process
1) strategic planning processket0987
 
HTA and payment mechanisms for new drugs to tackle AMR
HTA and payment mechanisms for new drugs to tackle AMRHTA and payment mechanisms for new drugs to tackle AMR
HTA and payment mechanisms for new drugs to tackle AMROffice of Health Economics
 
Critical Path Initiative Challenges
Critical  Path  Initiative  ChallengesCritical  Path  Initiative  Challenges
Critical Path Initiative ChallengesLandmark
 
Portfolio Management for New Product Development
Portfolio Management for New Product DevelopmentPortfolio Management for New Product Development
Portfolio Management for New Product DevelopmentHiba shaikh & Varda shaikh
 
An Assessment of Project Portfolio Management Techniques on Product and Servi...
An Assessment of Project Portfolio Management Techniques on Product and Servi...An Assessment of Project Portfolio Management Techniques on Product and Servi...
An Assessment of Project Portfolio Management Techniques on Product and Servi...iosrjce
 
Emerging Pharma Business & Operational Models
Emerging Pharma Business & Operational ModelsEmerging Pharma Business & Operational Models
Emerging Pharma Business & Operational ModelsSurya Chitra,PhD MBA
 
Oi in sme's remarks
Oi in sme's remarksOi in sme's remarks
Oi in sme's remarkspsaradis
 
Roadmap to reimbursement and access
Roadmap to reimbursement and accessRoadmap to reimbursement and access
Roadmap to reimbursement and accessRhonda Greenapple
 
The study of scope and implementation of lean aspects
The study of scope and implementation of lean aspectsThe study of scope and implementation of lean aspects
The study of scope and implementation of lean aspectsprjpublications
 
The study of scope and implementation of lean aspects
The study of scope and implementation of lean aspectsThe study of scope and implementation of lean aspects
The study of scope and implementation of lean aspectsprj_publication
 

Similar to © 2008 PALGRAVE MACMILLAN 1462-8732 J O U R N A L O F C O M (20)

Estimate The Impact of Time Savings on Your Drug Development Program
Estimate The Impact of Time Savings on Your Drug Development ProgramEstimate The Impact of Time Savings on Your Drug Development Program
Estimate The Impact of Time Savings on Your Drug Development Program
 
final version dissertation
final version dissertationfinal version dissertation
final version dissertation
 
R&D leadership in crisis: rebuilding innovation through people
R&D leadership in crisis: rebuilding innovation through peopleR&D leadership in crisis: rebuilding innovation through people
R&D leadership in crisis: rebuilding innovation through people
 
Pharmaceutical Lifecycle Management Challenges - Slides from Pharmaceutical P...
Pharmaceutical Lifecycle Management Challenges - Slides from Pharmaceutical P...Pharmaceutical Lifecycle Management Challenges - Slides from Pharmaceutical P...
Pharmaceutical Lifecycle Management Challenges - Slides from Pharmaceutical P...
 
New Product Planning Strategies to Ensure Organizational Robustness for Launch
New Product Planning Strategies to Ensure Organizational Robustness for LaunchNew Product Planning Strategies to Ensure Organizational Robustness for Launch
New Product Planning Strategies to Ensure Organizational Robustness for Launch
 
Whitepaper-Maximizing-the-Success-of-Your-CRO-Partnerships
Whitepaper-Maximizing-the-Success-of-Your-CRO-PartnershipsWhitepaper-Maximizing-the-Success-of-Your-CRO-Partnerships
Whitepaper-Maximizing-the-Success-of-Your-CRO-Partnerships
 
ValeriaPiras_NYUCapstone_PharmaM&AComm
ValeriaPiras_NYUCapstone_PharmaM&ACommValeriaPiras_NYUCapstone_PharmaM&AComm
ValeriaPiras_NYUCapstone_PharmaM&AComm
 
1st Riyadh Marketing Club (Introduction to Business Development Management) ...
1st  Riyadh Marketing Club (Introduction to Business Development Management) ...1st  Riyadh Marketing Club (Introduction to Business Development Management) ...
1st Riyadh Marketing Club (Introduction to Business Development Management) ...
 
1) strategic planning process
1) strategic planning process1) strategic planning process
1) strategic planning process
 
1) strategic planning process
1) strategic planning process1) strategic planning process
1) strategic planning process
 
HTA and payment mechanisms for new drugs to tackle AMR
HTA and payment mechanisms for new drugs to tackle AMRHTA and payment mechanisms for new drugs to tackle AMR
HTA and payment mechanisms for new drugs to tackle AMR
 
Critical Path Initiative Challenges
Critical  Path  Initiative  ChallengesCritical  Path  Initiative  Challenges
Critical Path Initiative Challenges
 
Portfolio Management for New Product Development
Portfolio Management for New Product DevelopmentPortfolio Management for New Product Development
Portfolio Management for New Product Development
 
An Assessment of Project Portfolio Management Techniques on Product and Servi...
An Assessment of Project Portfolio Management Techniques on Product and Servi...An Assessment of Project Portfolio Management Techniques on Product and Servi...
An Assessment of Project Portfolio Management Techniques on Product and Servi...
 
Emerging Pharma Business & Operational Models
Emerging Pharma Business & Operational ModelsEmerging Pharma Business & Operational Models
Emerging Pharma Business & Operational Models
 
Oi in sme's remarks
Oi in sme's remarksOi in sme's remarks
Oi in sme's remarks
 
Roadmap to reimbursement and access
Roadmap to reimbursement and accessRoadmap to reimbursement and access
Roadmap to reimbursement and access
 
EIU Value Challenge
EIU Value ChallengeEIU Value Challenge
EIU Value Challenge
 
The study of scope and implementation of lean aspects
The study of scope and implementation of lean aspectsThe study of scope and implementation of lean aspects
The study of scope and implementation of lean aspects
 
The study of scope and implementation of lean aspects
The study of scope and implementation of lean aspectsThe study of scope and implementation of lean aspects
The study of scope and implementation of lean aspects
 

More from LesleyWhitesidefv

• • ELEVENTH EDITION BUSINESS DATA NETWORKS AND
• • ELEVENTH EDITION BUSINESS DATA NETWORKS AND • • ELEVENTH EDITION BUSINESS DATA NETWORKS AND
• • ELEVENTH EDITION BUSINESS DATA NETWORKS AND LesleyWhitesidefv
 
⁎ Corresponding author.E-mail addresses [email protected] (
⁎ Corresponding author.E-mail addresses [email protected] (⁎ Corresponding author.E-mail addresses [email protected] (
⁎ Corresponding author.E-mail addresses [email protected] (LesleyWhitesidefv
 
‘ICHAPTER TWOChapter Objectives• To define stakehold
‘ICHAPTER TWOChapter Objectives• To define stakehold‘ICHAPTER TWOChapter Objectives• To define stakehold
‘ICHAPTER TWOChapter Objectives• To define stakeholdLesleyWhitesidefv
 
– 272 –C H A P T E R T E Nk Introductionk Alber
– 272 –C H A P T E R  T E Nk  Introductionk  Alber– 272 –C H A P T E R  T E Nk  Introductionk  Alber
– 272 –C H A P T E R T E Nk Introductionk AlberLesleyWhitesidefv
 
‘Jm So when was the first time you realised you were using everyd
‘Jm So when was the first time you realised you were using everyd‘Jm So when was the first time you realised you were using everyd
‘Jm So when was the first time you realised you were using everydLesleyWhitesidefv
 
•2To begin with a definition Self-esteem is the disp
•2To begin with a definition Self-esteem is the disp•2To begin with a definition Self-esteem is the disp
•2To begin with a definition Self-esteem is the dispLesleyWhitesidefv
 
• Sultan Alalshaikh, Doctoral Student, Pepperdine University G
• Sultan Alalshaikh, Doctoral Student, Pepperdine University G• Sultan Alalshaikh, Doctoral Student, Pepperdine University G
• Sultan Alalshaikh, Doctoral Student, Pepperdine University GLesleyWhitesidefv
 
•2Notes for the professorMuch of the content on these
•2Notes for the professorMuch of the content on these•2Notes for the professorMuch of the content on these
•2Notes for the professorMuch of the content on theseLesleyWhitesidefv
 
· You must respond to at least two of your peers by extending, ref
· You must respond to at least two of your peers by extending, ref· You must respond to at least two of your peers by extending, ref
· You must respond to at least two of your peers by extending, refLesleyWhitesidefv
 
· You have choices. You should answer three of the four available
· You have choices. You should answer three of the four available · You have choices. You should answer three of the four available
· You have choices. You should answer three of the four available LesleyWhitesidefv
 
· You may choose one or more chapters from E.G. Whites, The Minist
· You may choose one or more chapters from E.G. Whites, The Minist· You may choose one or more chapters from E.G. Whites, The Minist
· You may choose one or more chapters from E.G. Whites, The MinistLesleyWhitesidefv
 
· · Prepare a 2-page interprofessional staff update on HIPAA and
· · Prepare a 2-page interprofessional staff update on HIPAA and· · Prepare a 2-page interprofessional staff update on HIPAA and
· · Prepare a 2-page interprofessional staff update on HIPAA andLesleyWhitesidefv
 
·  Review the case study and, based on the provided information,
·  Review the case study and, based on the provided information,·  Review the case study and, based on the provided information,
·  Review the case study and, based on the provided information,LesleyWhitesidefv
 
·   · Introduction· What is hyperpituitarism and hypopituitari
·   · Introduction· What is hyperpituitarism and hypopituitari·   · Introduction· What is hyperpituitarism and hypopituitari
·   · Introduction· What is hyperpituitarism and hypopituitariLesleyWhitesidefv
 
· · Write a 3 page paper in which you analyze why regulatory age
· · Write a 3 page paper in which you analyze why regulatory age· · Write a 3 page paper in which you analyze why regulatory age
· · Write a 3 page paper in which you analyze why regulatory ageLesleyWhitesidefv
 
· Write a response as directed to each of the three case studies a
· Write a response as directed to each of the three case studies a· Write a response as directed to each of the three case studies a
· Write a response as directed to each of the three case studies aLesleyWhitesidefv
 
· Write a brief (one paragraph) summary for each reading.· · R
· Write a brief (one paragraph) summary for each reading.· · R· Write a brief (one paragraph) summary for each reading.· · R
· Write a brief (one paragraph) summary for each reading.· · RLesleyWhitesidefv
 
· Write a 2-page single spaced (12 font Times New Roman) book repo
· Write a 2-page single spaced (12 font Times New Roman) book repo· Write a 2-page single spaced (12 font Times New Roman) book repo
· Write a 2-page single spaced (12 font Times New Roman) book repoLesleyWhitesidefv
 
· Weight 11 of course gradeInstructionsData Instrument and D
· Weight 11 of course gradeInstructionsData Instrument and D· Weight 11 of course gradeInstructionsData Instrument and D
· Weight 11 of course gradeInstructionsData Instrument and DLesleyWhitesidefv
 
· Week 3 Crime Analysis BurglaryRobbery· ReadCozens, P. M.
· Week 3 Crime Analysis BurglaryRobbery· ReadCozens, P. M.· Week 3 Crime Analysis BurglaryRobbery· ReadCozens, P. M.
· Week 3 Crime Analysis BurglaryRobbery· ReadCozens, P. M.LesleyWhitesidefv
 

More from LesleyWhitesidefv (20)

• • ELEVENTH EDITION BUSINESS DATA NETWORKS AND
• • ELEVENTH EDITION BUSINESS DATA NETWORKS AND • • ELEVENTH EDITION BUSINESS DATA NETWORKS AND
• • ELEVENTH EDITION BUSINESS DATA NETWORKS AND
 
⁎ Corresponding author.E-mail addresses [email protected] (
⁎ Corresponding author.E-mail addresses [email protected] (⁎ Corresponding author.E-mail addresses [email protected] (
⁎ Corresponding author.E-mail addresses [email protected] (
 
‘ICHAPTER TWOChapter Objectives• To define stakehold
‘ICHAPTER TWOChapter Objectives• To define stakehold‘ICHAPTER TWOChapter Objectives• To define stakehold
‘ICHAPTER TWOChapter Objectives• To define stakehold
 
– 272 –C H A P T E R T E Nk Introductionk Alber
– 272 –C H A P T E R  T E Nk  Introductionk  Alber– 272 –C H A P T E R  T E Nk  Introductionk  Alber
– 272 –C H A P T E R T E Nk Introductionk Alber
 
‘Jm So when was the first time you realised you were using everyd
‘Jm So when was the first time you realised you were using everyd‘Jm So when was the first time you realised you were using everyd
‘Jm So when was the first time you realised you were using everyd
 
•2To begin with a definition Self-esteem is the disp
•2To begin with a definition Self-esteem is the disp•2To begin with a definition Self-esteem is the disp
•2To begin with a definition Self-esteem is the disp
 
• Sultan Alalshaikh, Doctoral Student, Pepperdine University G
• Sultan Alalshaikh, Doctoral Student, Pepperdine University G• Sultan Alalshaikh, Doctoral Student, Pepperdine University G
• Sultan Alalshaikh, Doctoral Student, Pepperdine University G
 
•2Notes for the professorMuch of the content on these
•2Notes for the professorMuch of the content on these•2Notes for the professorMuch of the content on these
•2Notes for the professorMuch of the content on these
 
· You must respond to at least two of your peers by extending, ref
· You must respond to at least two of your peers by extending, ref· You must respond to at least two of your peers by extending, ref
· You must respond to at least two of your peers by extending, ref
 
· You have choices. You should answer three of the four available
· You have choices. You should answer three of the four available · You have choices. You should answer three of the four available
· You have choices. You should answer three of the four available
 
· You may choose one or more chapters from E.G. Whites, The Minist
· You may choose one or more chapters from E.G. Whites, The Minist· You may choose one or more chapters from E.G. Whites, The Minist
· You may choose one or more chapters from E.G. Whites, The Minist
 
· · Prepare a 2-page interprofessional staff update on HIPAA and
· · Prepare a 2-page interprofessional staff update on HIPAA and· · Prepare a 2-page interprofessional staff update on HIPAA and
· · Prepare a 2-page interprofessional staff update on HIPAA and
 
·  Review the case study and, based on the provided information,
·  Review the case study and, based on the provided information,·  Review the case study and, based on the provided information,
·  Review the case study and, based on the provided information,
 
·   · Introduction· What is hyperpituitarism and hypopituitari
·   · Introduction· What is hyperpituitarism and hypopituitari·   · Introduction· What is hyperpituitarism and hypopituitari
·   · Introduction· What is hyperpituitarism and hypopituitari
 
· · Write a 3 page paper in which you analyze why regulatory age
· · Write a 3 page paper in which you analyze why regulatory age· · Write a 3 page paper in which you analyze why regulatory age
· · Write a 3 page paper in which you analyze why regulatory age
 
· Write a response as directed to each of the three case studies a
· Write a response as directed to each of the three case studies a· Write a response as directed to each of the three case studies a
· Write a response as directed to each of the three case studies a
 
· Write a brief (one paragraph) summary for each reading.· · R
· Write a brief (one paragraph) summary for each reading.· · R· Write a brief (one paragraph) summary for each reading.· · R
· Write a brief (one paragraph) summary for each reading.· · R
 
· Write a 2-page single spaced (12 font Times New Roman) book repo
· Write a 2-page single spaced (12 font Times New Roman) book repo· Write a 2-page single spaced (12 font Times New Roman) book repo
· Write a 2-page single spaced (12 font Times New Roman) book repo
 
· Weight 11 of course gradeInstructionsData Instrument and D
· Weight 11 of course gradeInstructionsData Instrument and D· Weight 11 of course gradeInstructionsData Instrument and D
· Weight 11 of course gradeInstructionsData Instrument and D
 
· Week 3 Crime Analysis BurglaryRobbery· ReadCozens, P. M.
· Week 3 Crime Analysis BurglaryRobbery· ReadCozens, P. M.· Week 3 Crime Analysis BurglaryRobbery· ReadCozens, P. M.
· Week 3 Crime Analysis BurglaryRobbery· ReadCozens, P. M.
 

Recently uploaded

The basics of sentences session 2pptx copy.pptx
The basics of sentences session 2pptx copy.pptxThe basics of sentences session 2pptx copy.pptx
The basics of sentences session 2pptx copy.pptxheathfieldcps1
 
How to Give a Domain for a Field in Odoo 17
How to Give a Domain for a Field in Odoo 17How to Give a Domain for a Field in Odoo 17
How to Give a Domain for a Field in Odoo 17Celine George
 
Beyond the EU: DORA and NIS 2 Directive's Global Impact
Beyond the EU: DORA and NIS 2 Directive's Global ImpactBeyond the EU: DORA and NIS 2 Directive's Global Impact
Beyond the EU: DORA and NIS 2 Directive's Global ImpactPECB
 
1029 - Danh muc Sach Giao Khoa 10 . pdf
1029 -  Danh muc Sach Giao Khoa 10 . pdf1029 -  Danh muc Sach Giao Khoa 10 . pdf
1029 - Danh muc Sach Giao Khoa 10 . pdfQucHHunhnh
 
Seal of Good Local Governance (SGLG) 2024Final.pptx
Seal of Good Local Governance (SGLG) 2024Final.pptxSeal of Good Local Governance (SGLG) 2024Final.pptx
Seal of Good Local Governance (SGLG) 2024Final.pptxnegromaestrong
 
Gardella_PRCampaignConclusion Pitch Letter
Gardella_PRCampaignConclusion Pitch LetterGardella_PRCampaignConclusion Pitch Letter
Gardella_PRCampaignConclusion Pitch LetterMateoGardella
 
Explore beautiful and ugly buildings. Mathematics helps us create beautiful d...
Explore beautiful and ugly buildings. Mathematics helps us create beautiful d...Explore beautiful and ugly buildings. Mathematics helps us create beautiful d...
Explore beautiful and ugly buildings. Mathematics helps us create beautiful d...christianmathematics
 
APM Welcome, APM North West Network Conference, Synergies Across Sectors
APM Welcome, APM North West Network Conference, Synergies Across SectorsAPM Welcome, APM North West Network Conference, Synergies Across Sectors
APM Welcome, APM North West Network Conference, Synergies Across SectorsAssociation for Project Management
 
Introduction to Nonprofit Accounting: The Basics
Introduction to Nonprofit Accounting: The BasicsIntroduction to Nonprofit Accounting: The Basics
Introduction to Nonprofit Accounting: The BasicsTechSoup
 
Activity 01 - Artificial Culture (1).pdf
Activity 01 - Artificial Culture (1).pdfActivity 01 - Artificial Culture (1).pdf
Activity 01 - Artificial Culture (1).pdfciinovamais
 
Mixin Classes in Odoo 17 How to Extend Models Using Mixin Classes
Mixin Classes in Odoo 17  How to Extend Models Using Mixin ClassesMixin Classes in Odoo 17  How to Extend Models Using Mixin Classes
Mixin Classes in Odoo 17 How to Extend Models Using Mixin ClassesCeline George
 
Sports & Fitness Value Added Course FY..
Sports & Fitness Value Added Course FY..Sports & Fitness Value Added Course FY..
Sports & Fitness Value Added Course FY..Disha Kariya
 
Basic Civil Engineering first year Notes- Chapter 4 Building.pptx
Basic Civil Engineering first year Notes- Chapter 4 Building.pptxBasic Civil Engineering first year Notes- Chapter 4 Building.pptx
Basic Civil Engineering first year Notes- Chapter 4 Building.pptxDenish Jangid
 
Paris 2024 Olympic Geographies - an activity
Paris 2024 Olympic Geographies - an activityParis 2024 Olympic Geographies - an activity
Paris 2024 Olympic Geographies - an activityGeoBlogs
 
Application orientated numerical on hev.ppt
Application orientated numerical on hev.pptApplication orientated numerical on hev.ppt
Application orientated numerical on hev.pptRamjanShidvankar
 
Gardella_Mateo_IntellectualProperty.pdf.
Gardella_Mateo_IntellectualProperty.pdf.Gardella_Mateo_IntellectualProperty.pdf.
Gardella_Mateo_IntellectualProperty.pdf.MateoGardella
 
Z Score,T Score, Percential Rank and Box Plot Graph
Z Score,T Score, Percential Rank and Box Plot GraphZ Score,T Score, Percential Rank and Box Plot Graph
Z Score,T Score, Percential Rank and Box Plot GraphThiyagu K
 
Unit-IV- Pharma. Marketing Channels.pptx
Unit-IV- Pharma. Marketing Channels.pptxUnit-IV- Pharma. Marketing Channels.pptx
Unit-IV- Pharma. Marketing Channels.pptxVishalSingh1417
 

Recently uploaded (20)

The basics of sentences session 2pptx copy.pptx
The basics of sentences session 2pptx copy.pptxThe basics of sentences session 2pptx copy.pptx
The basics of sentences session 2pptx copy.pptx
 
How to Give a Domain for a Field in Odoo 17
How to Give a Domain for a Field in Odoo 17How to Give a Domain for a Field in Odoo 17
How to Give a Domain for a Field in Odoo 17
 
Beyond the EU: DORA and NIS 2 Directive's Global Impact
Beyond the EU: DORA and NIS 2 Directive's Global ImpactBeyond the EU: DORA and NIS 2 Directive's Global Impact
Beyond the EU: DORA and NIS 2 Directive's Global Impact
 
1029 - Danh muc Sach Giao Khoa 10 . pdf
1029 -  Danh muc Sach Giao Khoa 10 . pdf1029 -  Danh muc Sach Giao Khoa 10 . pdf
1029 - Danh muc Sach Giao Khoa 10 . pdf
 
Seal of Good Local Governance (SGLG) 2024Final.pptx
Seal of Good Local Governance (SGLG) 2024Final.pptxSeal of Good Local Governance (SGLG) 2024Final.pptx
Seal of Good Local Governance (SGLG) 2024Final.pptx
 
Mattingly "AI & Prompt Design: Structured Data, Assistants, & RAG"
Mattingly "AI & Prompt Design: Structured Data, Assistants, & RAG"Mattingly "AI & Prompt Design: Structured Data, Assistants, & RAG"
Mattingly "AI & Prompt Design: Structured Data, Assistants, & RAG"
 
Gardella_PRCampaignConclusion Pitch Letter
Gardella_PRCampaignConclusion Pitch LetterGardella_PRCampaignConclusion Pitch Letter
Gardella_PRCampaignConclusion Pitch Letter
 
Explore beautiful and ugly buildings. Mathematics helps us create beautiful d...
Explore beautiful and ugly buildings. Mathematics helps us create beautiful d...Explore beautiful and ugly buildings. Mathematics helps us create beautiful d...
Explore beautiful and ugly buildings. Mathematics helps us create beautiful d...
 
APM Welcome, APM North West Network Conference, Synergies Across Sectors
APM Welcome, APM North West Network Conference, Synergies Across SectorsAPM Welcome, APM North West Network Conference, Synergies Across Sectors
APM Welcome, APM North West Network Conference, Synergies Across Sectors
 
Introduction to Nonprofit Accounting: The Basics
Introduction to Nonprofit Accounting: The BasicsIntroduction to Nonprofit Accounting: The Basics
Introduction to Nonprofit Accounting: The Basics
 
Activity 01 - Artificial Culture (1).pdf
Activity 01 - Artificial Culture (1).pdfActivity 01 - Artificial Culture (1).pdf
Activity 01 - Artificial Culture (1).pdf
 
Mixin Classes in Odoo 17 How to Extend Models Using Mixin Classes
Mixin Classes in Odoo 17  How to Extend Models Using Mixin ClassesMixin Classes in Odoo 17  How to Extend Models Using Mixin Classes
Mixin Classes in Odoo 17 How to Extend Models Using Mixin Classes
 
Sports & Fitness Value Added Course FY..
Sports & Fitness Value Added Course FY..Sports & Fitness Value Added Course FY..
Sports & Fitness Value Added Course FY..
 
Basic Civil Engineering first year Notes- Chapter 4 Building.pptx
Basic Civil Engineering first year Notes- Chapter 4 Building.pptxBasic Civil Engineering first year Notes- Chapter 4 Building.pptx
Basic Civil Engineering first year Notes- Chapter 4 Building.pptx
 
Paris 2024 Olympic Geographies - an activity
Paris 2024 Olympic Geographies - an activityParis 2024 Olympic Geographies - an activity
Paris 2024 Olympic Geographies - an activity
 
Application orientated numerical on hev.ppt
Application orientated numerical on hev.pptApplication orientated numerical on hev.ppt
Application orientated numerical on hev.ppt
 
Gardella_Mateo_IntellectualProperty.pdf.
Gardella_Mateo_IntellectualProperty.pdf.Gardella_Mateo_IntellectualProperty.pdf.
Gardella_Mateo_IntellectualProperty.pdf.
 
Z Score,T Score, Percential Rank and Box Plot Graph
Z Score,T Score, Percential Rank and Box Plot GraphZ Score,T Score, Percential Rank and Box Plot Graph
Z Score,T Score, Percential Rank and Box Plot Graph
 
Unit-IV- Pharma. Marketing Channels.pptx
Unit-IV- Pharma. Marketing Channels.pptxUnit-IV- Pharma. Marketing Channels.pptx
Unit-IV- Pharma. Marketing Channels.pptx
 
Mehran University Newsletter Vol-X, Issue-I, 2024
Mehran University Newsletter Vol-X, Issue-I, 2024Mehran University Newsletter Vol-X, Issue-I, 2024
Mehran University Newsletter Vol-X, Issue-I, 2024
 

© 2008 PALGRAVE MACMILLAN 1462-8732 J O U R N A L O F C O M

  • 1. © 2008 PALGRAVE MACMILLAN 1462-8732 J O U R N A L O F C O M M E R C I A L B I OT E C H N O L O G Y. VOL 14. NO 4. 307–325 OCTOBER 2008 307 www.palgrave-journals.com/jcb INTRODUCTION The increasing discussion about rising healthcare cost is fuelled by reports that General Motors paid more for healthcare than Value-driven project and portfolio management in the pharmaceutical industry: Drug discovery versus drug development – Commonalities and differences in portfolio management practice Kerstin M. Bode-Greuel and Klaus J. Nickisch Date Received (in revised form): 31st January, 2008 Kerstin M. Bode-Greuel is founding and managing partner of Bioscience Valuation in Germany and USA, and of Bioscience Market Research, USA. Her 20-year experience covers virtually all therapy areas in pharmaceutical R & D and strategic marketing. She held senior positions at Bayer AG, and after fi ve years of independent management consultancy, co-founded Bioscience Valuation. Her publications include two expert
  • 2. SCRIP reports, professional journal articles and chapter of a textbook. She is Associate Lecturer at University of Essen ’ s Masterclass programme, as well as speaker / workshop leader in international conferences. Kerstin studied medicine in Germany and UK, and was educated in corporate fi nance at the Wharton School of the University of Pennsylvania. Klaus J. Nickisch received his PhD in Organic Chemistry from the Technical University Berlin in 1979. He then joined the Schering AG as a medicinal chemist doing research work in the endocrinology and cardiovascular fi eld for fi ve years. In 1985 he moved into development and fi nally led the chemical development department for many years. In 1999 he moved to project management and became head of project- and portfolio management of Specialized Therapeutics, a business unit of Schering AG located in the US. He fi nally got promoted to heading global project management. After the acquisition of Schering AG by Bayer AG, he joined the Berlin School of Economics where he is now in charge for building a new MBA programme for pharmaceutical management. Abstract The concept of portfolio management has been widely used in the pharmaceutical industry. It is used to evaluate the commercial value and the risk structure of development projects. The fi nal goal is to select a portfolio of projects that addresses the strategic objectives of the organisation optimally and that leads to the highest overall portfolio value. Companies
  • 3. now start to apply the portfolio management concept on their research portfolios. Although the basic principle remains the same, the methodology applied has to be adapted to the greater uncertainty that early research projects carry. Commonalities and differences of the portfolio management process in research and development are described and recommendations are given how to harmonise the two different approaches. Journal of Commercial Biotechnology (2008) 14, 307 – 325. doi: 10.1057/jcb.2008.6 ; published online 4 March 2008 Keywords: portfolio management , research , development , pharmaceutical industry , risk management Correspondence: Kerstin M. Bode-Greuel, Bioscience Valuation BSV GmbH, Am Zigeunerbergl 3, Grainau 82491, Germany Tel: + 49 8821 966979 0 Fax: + 49 8821 966979 29 E-mail: [email protected] Bode-Greuel and Nickisch © 2008 PALGRAVE MACMILLAN 1462-8732 J O U R N A L O F C O M M E R C I A L B I OT E C H N O L O G Y. VOL 14. NO 4. 307–325 OCTOBER 2008308 for steel per vehicle in 2004, 1 and Starbucks paid more for health insurance than for coffee in 2005. 2 The continuing rise in development costs for drugs has increased pressure on R & D organisations to contribute to higher effi ciency
  • 4. in the overall process of coming up with new drugs. In the last few years the industry has made signifi cant efforts to address these challenges 3 and to increase the productivity of the drug development process. Some of the initiatives have without doubt led to considerable improvements. Examples are the earlier determination of a drug ’ s toxicology profi le and early tests to investigate the suitability of a new drug candidate for oral administration or once a day dosing. The question is no longer how good we are in what we are doing but whether we are doing the right things. Further improvements of the overall process should shift from attempts of enhancing effectiveness to a greater emphasis on the effi ciency of the processes applied. In this context a lot of emphasis is put on portfolio management. In the broadest defi nition, portfolio management describes the process of maximising the value of R & D portfolios through proper resource allocation. This requires an alignment of portfolio management with strategic business objectives. Such objectives should not only be general (e.g., innovation) and quantitative (eg ROI or sales targets). They should also defi ne disease areas of interest, clearly outline the remaining medical needs, and specify the indications that are considered worth pursuing. This will enable decision makers and functional R & D managers to identify projects with both
  • 5. strategic fi t and a high value proposition. Depending on the size of the organisation, either a corporate or therapeutic area strategies need to be developed, approved, and endorsed by the entire organisation. Value-driven project and portfolio management implies quantitative fi nancial and risk analysis of individual projects and overall portfolios. Such analyses elucidate options for improving the value and risk structure of individual projects on the one hand and therapeutic areas or overall corporate portfolios on the other hand. They are applicable and relevant to companies of any size. Value-driven project and portfolio management is a methodology enabling the alignment of project decisions with corporate strategy and defi ned business objectives. Although portfolio management has been applied in the fi nancial industry for many years and Harry Markowitz was honoured with the Nobel Prize for outlining this concept it was only around the end of the last century that the application of value-driven portfolio management in the pharmaceutical industry was published. 4 Around the same time, an investigation across various industries provided evidence that portfolio manageme nt based on quantitative fi nancial analyses using the net present value (NPV) algorithm correlates well with value creation. Value destruction, however, was observed more frequently in companies that built their
  • 6. portfolio decisions only on simplifi ed scoring methods or semi-quantitative portfolio matrices such as those introduced in the 1980s. 5 Most pharmaceutical companies have implemented portfolio management in drug development. 6 – 9 An increasing number of companies is now making efforts to apply it to discovery research and early development. Not surprisingly, given the relatively short period of use, the inherent complexity of the issue has prevented the establishment of a broadly accepted best practice in R & D portfolio management. This review focuses on the entire portfolio management process with special emphasis on commonalities and differences in the research and development environment. For aspects where, based on the authors ’ experience, a best practice emerges this is clearly stated. Otherwise, different approaches are described and compared. We begin with the description of portfolio management in development because there it has a longer history than in Value-driven project and portfolio manage ment in the pharmaceutical industry © 2008 PALGRAVE MACMILLAN 1462-8732 J O U R N A L O F C O M M E R C I A L B I OT E C H N O L O G Y. VOL 14. NO 4. 307–325 OCTOBER 2008 309
  • 7. The four tools mentioned above provide information required to evaluate and prioritise projects, and to analyse whether the portfolio is aligned with corporate objectives. TPPs are generally applied, but not always in an effective way. The stage-gate decision process is related to the major preclinical and clinical development milestones and is also a well- established principle in the pharmaceutical industry. At each stage-gate, it is decided whether the achieved results support continuation of development, and the project may be reprioritised depending on other projects competing for resources. Time line and budget management has been the responsibility of project management for a long time. Sales forecasting and fi nancial project evaluation is undertaken to a variable extent and level of detail, depending on companies ’ policies at which development stage quantitative analyses should commence. In addition to the four tools mentioned above, risk analysis has become a particular point of concern for about fi ve years, both in project and in portfolio management. 10 In the context of the pharmaceutical and biotechnology industry, it is helpful to differentiate two different categories of risk as they are managed by different stakeholders: strategic and operative risk. 11 In brief, strategic risks typically affect go / no-go decisions and may have a signifi cant impact on value; therefore, they are matters of concern predominantly for project and portfolio management. Operative risks represent issues
  • 8. that may lead to deviations from the development plan and budget. They require particular attention by line functions and coordination by project management, as they are often cross-functional. Operative problems may eventually gain strategic relevance. Strategic risk analysis has been applied for some time in R & D portfolio management and is usually represented as estimates of the probability of achieving milestones. The systematic management of operative risk has been initiated more recently; here, risk is often not represented as probability but rather research. This has led to a signifi cant body of experience on which portfolio management in early R & D can build. CURRENT BEST PRACTICE OF PORTFOLIO MANAGEMENT IN DEVELOPMENT (BEYOND PROOF OF CONCEPT) There are two major tasks for implementation of value-driven portfolio management: evaluation methodology and metrics on the one hand, and the corporate evaluation and prioritisation process on the other hand. There is a general agreement in the pharmaceutical industry that the evaluation of projects entering ‘ full ’ development after successful proof of concept (PoC) should include quantitative fi nancial parameters. Furthermore, there appears to be a generally accepted set of portfolio management metrics. 6 – 9 The portfolio management process, however, differs, as well as the degree of
  • 9. implementation, refl ecting individual companies ’ corporate structure and culture. There are some prerequisites for successful portfolio management that apply to all systems: the evaluation of projects must be suffi ciently detailed, interdisciplinary, consistent, and embedded in a practicable corporate process. Value-driven project management in development The fi rst step towards value-driven portfolio management is the establishment of effective project management. Project management is the predominant operative instrument for the execution of portfolio decisions. Four common tools are applied to align project management with portfolio decisions: Target product profi le (TPP) A stage-gate decision process Timeline and budget management Sales forecast aligned with TPP and development plan • • • • Bode-Greuel and Nickisch © 2008 PALGRAVE MACMILLAN 1462-8732 J O U R N A L O F C O M M E R C I A L B I OT E C H N O L O G Y. VOL
  • 10. 14. NO 4. 307–325 OCTOBER 2008310 as semi-quantitative categorisation and plotted against categories of impact. In the following, ways towards effective application of TPPs and strategic risk analysis (in the format of decision trees) are described. In addition, sales forecasting procedures and fi nancial analyses adapted to the needs of portfolio management are outlined. Target product profi le (TPP) A TPP serves as a blueprint of the desired future product. It defi nes the disease category and targeted patient population, the requested effi cacy, safety and tolerability characteristics, and technical details such as, for example, formulation and mode of application of the product to be developed. The TPP describes features of the future marketed product that can realistically be expected based on the properties of the compound and the pathophysiology of the disease to be treated. It takes into account both regulatory and market requirements, as the profi le should refl ect both a registrable and a commercially viable product. Ideally, TPPs for individual projects and their respective targeted disease categories are well aligned across discovery research, development, and marketing functions. The FDA has recently defi ned a template for TPPs to facilitate communication with the agency. 12 This is an extensive document of several pages not only requesting target criteria but also a description of trial
  • 11. designs and obtained development results. As internal tool for value-driven management, focused TPPs are more suitable, summarising the features that drive development and marketing plans. Such TPPs do usually comprise not more than 1 – 2 pages. TPPs defi ne the desired label in the packet insert and therefore serve as outline for R & D with respect to the required clinical trials and development activities, that is, TPPs defi ne the scope of investment. In order to fulfi l this task, effi cacy and safety / tolerability parameters are defi ned in a commonly agreed and, as far as possible, quantitative way, as they will drive trial design and cost. The TPP outlines the development targets, but it does not always indicate to what extent results would be allowed to deviate from the target until further development is not worth while any more. Therefore, companies often defi ne a minimum product profi le (MPP) alongside the TPP to establish a common understanding of the minimum study results required for continuation of development. All of the MPP criteria must be achieved, and they must respect regulatory requirements. While the TPP outlines the scope of investment, the MPP represents stop / go criteria. TPPs can play a benefi cial role in aligning project activities between the development functions and marketing and sales. This is best achieved if they are established through an
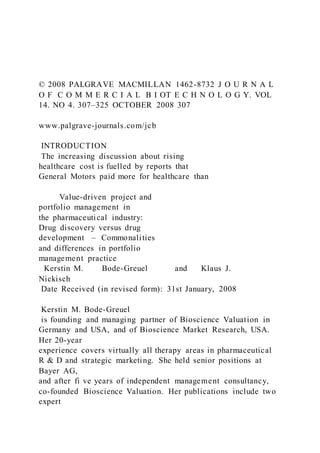
  • 12. interactive cross-functional process. TPPs also facilitate the communication of project issues and the alignment of senior management ’ s expectations. As such, they are an important element of value-driven management. Decision tree analysis Decision tree analysis is an effective tool to illustrate R & D decision points, the probabilities of uncertain outcomes at each milestone, and potentially resulting decision options ( Figure 1 ). It is well established in pharmaceutical development. 4,12 As investment decisions are made with respect to milestones, it is useful to examine the risk and cost of individual milestones and the value gained assuming successful completion. Decision trees serve as communication tool for portfolio management and for project management and line functions. They are also used for risk adjusted net present value analysis ( ‘ augmented NPV ’ ). Decision tree analysis focuses on those activities that are essential for successful development and for achievement of the TPP. If milestones are composed of several independent uncertain activities undertaken in parallel, individual probabilities are multiplied to provide the overall probability of success Value-driven project and portfolio management in the pharmaceutical industry
  • 13. © 2008 PALGRAVE MACMILLAN 1462-8732 J O U R N A L O F C O M M E R C I A L B I OT E C H N O L O G Y. VOL 14. NO 4. 307–325 OCTOBER 2008 311 circumstances of the individual case. An interactive and systematic discussion process has proven to be most effective as participants refl ect their opinions against others. This leads to a fruitful knowledge exchange among experts and in most cases to a common agreement. It is sometimes believed that the interactive process consumes too much time, there may not be access to professional moderation capabilities, or expert teams are considered overly optimistic. Therefore, some companies prefer simplifi ed procedures, for example, the distribution of templates that have to be fi lled, or they use published average success rates. However, this may result in overlooking critical project issues that arise from the interaction of functions and that would not be recognised by individuals for the respective milestone. Decision trees usually extend up to approval. Market scenarios and commercialisation uncertainties are often refl ected in probabilistic sales forecasts (see below). Best practice decision tree analysis is conducted with the project teams and additional experts when appropriate. The analysis benefi ts from a neutral moderator, often a representative of the portfolio management function. The development plan is evaluated along the TPP / MPP and its
  • 14. milestone structure. For those uncertain elements that affect go / no-go decisions, the probability of success is estimated. Benchmarks can be used as orientation to outline a plausible range to the team. Probabilities are assessed based on available knowledge and the 54% Phase III Carcinogenicity 46% Phase III: efficacy at least according to minimum profile (6 months treatment, p=80%), 12 months safety trial OK (p=80%), carcinogenicity study OK (p=85%) - GO TO Registration - Phase III and/or 12 months safety trial and/ or carcinogenicity study failed - STOP - 54% Phase III Carcinogenicity 46% Phase III: efficacy at least according to minimum
  • 15. profile (6 months treatment, p=80%), 12 months safety trial OK (p=80%), carcinogenicity study OK (p=85%) - GO TO Registration - Phase III and/or 12 months safety trial and/ or carcinogenicity study failed - STOP - 40% Phase I go 60% stop 65% Phase IIa (PoC) go 35% stop 46% Phase III L.T. Tox
  • 16. go stop 10% Registration go 90% stop Phase IIb CMC go stop 54% 72% 28% Figure 1 : Example of a decision tree. Decision trees are tools to illustrate the potential outcomes at development milestones and the risk structure of projects. Outcomes are differentiated according to available decision options. For use in portfolio management and for valuation purposes, the layout is usually simplifi ed as it assumes that development will be continued and the project will fi nd an investor if milestones are achieved. The Phase III milestone in the present example is comprised of three uncertain studies whose outcomes are considered independent,
  • 17. while all studies must be successful in order to proceed. Probability estimates can then be multiplied to achieve the overall probability of success of the milestone. If several studies are undertaken at a milestone, care must be taken to identify potential interdependencies between studies in order to avoid an overestimation of risk. 11 Decision trees may sometimes refl ect more than two decision options at a milestone. For example, a Phase II milestone may lead to more than one way forward: if effi cacy is as outlined in the TPP, it may be decided to go directly to Phase III; alternatively, Phase II results may suggest to investigate another treatment schedule before going to Phase III in order to maximise the chance of success of the latter. Bode-Greuel and Nickisch © 2008 PALGRAVE MACMILLAN 1462-8732 J O U R N A L O F C O M M E R C I A L B I OT E C H N O L O G Y. VOL 14. NO 4. 307–325 OCTOBER 2008312 alone. Furthermore, published benchmarks are averages across a sample of companies, and the method applied to generate them differs among sources. In addition, there is evidence that individual companies deviate signifi cantly from average success rates, indicating differences in R & D productivity within the industry. Finally, success rates differ across therapeutic fi elds, and the available statistics do not provide reliable data for individual disease entities.
  • 18. Very often, alternative options exist for the development of projects. These may comprise a broader or restricted target patient group, a fast and risky development to achieve earlier launch versus a step-wise, risk reduced development strategy, the cheapest possible way towards registration, or a more or less ambitious TPP with respect to effi cacy or safety. Such alternatives differ with respect to cost, risk and risk structure, timelines, and commercial value. Decision tree analysis is an ideal tool to facilitate the analysis of alternative options. The relevance of project risk structure . A project ’ s risk structure is defi ned as the resolution of risk per milestone. Risk structure may be front-loaded (low probability of success in early development), balanced, or back-loaded (high risk in late development). Alternative development plans usually differ in risk structure. Mostly, but not always, this is also associated with a difference in overall probability of development success. Risk structure affects the fi nancial value of projects because the relative weighting of outcomes is different. This applies even if overall probability of success is not different, in cases where the relative weighting of expensive versus cheap failure scenarios is changed. In essence, it would always be advisable to reduce risk as early and quickly as possible in order to put the signifi cant investments in the later stages at the lowest necessary risk.
  • 19. R & D projects can be classifi ed in different categories, such as, for example, fi rst-in-class highly innovative new products, ‘ fast followers ’ with validated mechanism of action, or added-value generics, that differ in risk structure. Highly uncertain innovative drugs undergo signifi cant risk resolution only after Phase II (PoC) or even Phase III, depending on the therapeutic category and clinical trial endpoints. Fast followers are projects of moderate risk in Phases II and III; risk will mostly be driven by the incremental benefi ts the sponsor wishes to establish to make the product competitive vis- à -vis the market leader. Added-value generics are copies of products with a commonly known benefi t / risk ratio, while effi cacy, safety, or convenience is enhanced, for example, through an innovative formulation. Such projects have a comparatively low development risk and often a shorter development time. The analysis of project risk and the proactive selection of projects with complementary risk structure offer opportunities to balance portfolio risk. A risk- balanced portfolio is more likely to meet productivity goals. Furthermore, projects with favourable risk structure may have a comparatively high fi nancial value in early development (with less pronounced incremental value increase upon completion of development milestones), thus balancing not only productivity but also portfolio value.
  • 20. The analysis of project risk structure facilitates the understanding of the impact of the chosen clinical trial plan and trial endpoints on risk ( Figure 2 ). Development risk is infl uenced by the reliability and validity of individual studies, and by the quality of development execution. Examples are the potentially low reliability of encouraging but small pilot studies that may carry forward risk into later stages of development, leading to unexpected late stage failures. If trial results remain unclear, development may be terminated because additional investments and further trials would delay launch to an extent that the value proposition is lost. If the expected knowledge gain of particular trials and its impact on the level of confi dence in Value-driven project and portfolio management in the pharmaceutical industry © 2008 PALGRAVE MACMILLAN 1462-8732 J O U R N A L O F C O M M E R C I A L B I OT E C H N O L O G Y. VOL 14. NO 4. 307–325 OCTOBER 2008 313 COST (EUR mill.)* ; probability of success discount rate: 10% tax rate: 40% Peak sales (EUR mill.)
  • 21. Years to peak Preclin Ph I Ph II Phase III Reg Phase IV CMC/ Product devel. Marketing (year of launch) % sales reduction in year of patent expiry Phase II/III Added value generic 250 5 3 6 44 39 - 5 38 - 90% 85% 85% 90% Standard product 500 5 7 9 22 98 66 5% of peak sales (years 1-5 after launch) 13 125 75% 70% 75% 60% 80% 95% Blockbuster product 3,000 7 7 10 32 258 452 5% of peak sales (years 1-5 after
  • 22. launch) 13 450 90% 45% 60% 35% 65% 90% Launch Value (EUR million) 103 163 272 577 1,001 214 261 376 635 145 357 734 2,608 5,664
  • 24. 80% 90% 100% Development Stage P ro b a b il it y o f L a u n c h Preclin Phase I Phase II Phase III Reg Cost per stage (EUR million)
  • 26. 6 44 7 9 22 98 7 10 32 258 Added value generic ‘Standard’ product (validated MoA, incremental innovation) 1st in class (blockbuster, breakthrough innovation) Figure 2 : Portfolio risk structure. R & D projects can be classifi ed according to risk / cost / value characteristics. For the three examples shown, both overall probability of success and risk structure is different. (a) shows three examples of development projects with different risk structures: (1) Innovative NCE ( ‘ breakthrough innovation ’ ): high risk, high cost, blockbuster potential; (2) ‘ Standard ’ product
  • 27. ( ‘ incremental innovation ’ ): for example, a product of a class with clinical PoC; moderate development risk, moderate development cost, moderate sales potential; (3) Added value generic (generic with added benefi ts through, eg, innovative formulation): low risk and cost, low to moderate sales, faster development. (b) illustrates the expected fi nancial value, the probability of launch, and the cost per stage of the projects at particular development milestones. For example, a project with low risk and fast development may have a higher fi nancial value in early development than a highly innovative project, emphasising the impact of risk structure on value. The expected value uptake of the latter is, however, much more pronounced when risk is resolved through the completion of milestones. Innovative projects usually experience their highest relative value uptake after successful PoC, whereas the value uptake of clinically validated development candidates or value-added generics is less pronounced at PoC. Value uptake profi les may also vary depending on the chosen clinical development strategy and the unique selling proposition to be established. Taking into account the effects of projects with different risk structures, R & D portfolios may be designed to achieve optimum productivity and diversifi cation. Analysis of the risk / cost / value structure of individual projects facilitates proactive portfolio planning with respect to overall portfolio value, effi cient resource allocation, and sustained growth. Bode-Greuel and Nickisch © 2008 PALGRAVE MACMILLAN 1462-8732 J O U R N A L
  • 28. O F C O M M E R C I A L B I OT E C H N O L O G Y. VOL 14. NO 4. 307–325 OCTOBER 2008314 forthcoming development stages is analysed, the understanding of risk along the sequence of clinical trials will be enhanced. Commercial analysis and sales forecast In fully integrated corporations, commercial analyses and sales forecasts are usually provided by (strategic) marketing. Representatives of the portfolio management function sometimes generate sales forecasts for projects that have not yet passed PoC or that are of low priority. In such cases, it is advisable to seek alignment of the key assumptions with marketing to ensure their buy-in. Assuming contemporary forecasting capabilities (see below), the major issue of value-driven management is the proper alignment of commercial expectations with the planned R & D activities and clinical trials. Furthermore, project managers and decision makers benefi t from investigations how product sales may change if uncertain trial outcomes move to the optimistic or pessimistic direction, related to the likelihood of the respective scenarios. As outlined above, the TPP / MPP is a valuable tool to facilitate the establishment of trustworthy forecasts and expected sales scenarios. As a consequence of the translational medicine approach, more and more
  • 29. companies choose an organisational model that separates research and early development until POC from full development. As a consequence this leads also to a split of the portfolio management function. In such cases there is a tendency of initiating quantitative fi nancial project evaluation only after PoC. This is different from portfolio management practice in the 1990s, when a development project was nominated with the start of preclinical development and its fi nancial value analysed. Signifi cant decisions with respect to the therapeutic indication and the development strategy are sometimes already made before the defi nition of the PoC programme, as they infl uence its objectives and design. If TPPs and quantitative analyses are established only thereafter as prerequisite for the ‘ full ’ development decision, it may turn out that data generated earlier do not support a competitive value proposition. However, with a longstanding business experience of the company in the targeted disease areas, marketing input to early R & D, and a broader set of clinical options tested, it may be adequate to initiate market analyses and fi nancial evaluation only after PoC. Productivity analyses of the biopharmaceutical industry indicate that approximately 20 % of project terminations in Phases II, III, and registration are based on commercial and strategic considerations. 13,14 A signifi cant fraction of these late terminations could potentially be avoided by conducting
  • 30. quantitative evaluation and market research earlier. The value of sales forecasting before PoC is sometimes questioned, as it is entirely based on assumptions. If, however, TPPs and MPPs are suffi ciently detailed and respected in development, they represent blueprints of the future product, because R & D will be directed towards proving the claims. In essence, uncertainty would only materialise as more positive product and market scenarios, as outcomes below MPP level should lead to a termination of development. The uncertainty of assumptions and their impact on overall results can be quantifi ed and illustrated by various techniques. Companies who apply forecasting to early projects also appreciate its educational effect, because the relation between criteria defi ned in TPPs and their expected impact on sales becomes transparent. The following three approaches to the evaluation of the market potential can be applied in early R & D at a moderate cost: i. Sales forecasts based on desk research : Commercially available reports on disease prevalence and incidence and market segmentation enable an estimate of patients available for treatment. Data- bases provide information about pipeline products and facilitate a judgment of Value-driven project and portfolio management in the pharmaceutical industry
  • 31. © 2008 PALGRAVE MACMILLAN 1462-8732 J O U R N A L O F C O M M E R C I A L B I OT E C H N O L O G Y. VOL 14. NO 4. 307–325 OCTOBER 2008 315 forecast by market research reduces the risk of pursuing development strategies that prove to be commercially unattractive in late development. Financial project evaluation The NPV algorithm is a generally accepted approach to the fi nancial evaluation of investments in the pharmaceutical industry, and it is also used in R & D portfolio management. 6 – 8,15 Originally, the NPV algorithm has been developed for ‘ static ’ investments where managerial actions have virtually no impact on value. As described above, the situation is different for the development of new drugs. Investment decisions are made stepwise along development milestones, while assumptions are made about the cost, duration, and probability of success of individual milestones. NPV calculations that refl ect the milestone and risk structure of projects are therefore more useful. Many companies report to apply ‘ risk-adjusted ’ or ‘ expected ’ NPV models, while it is not always disclosed whether such models include the probabilities per individual milestone or only the overall probability of launch. The ‘ augmented NPV ’ model 15 incorporates the probability of success at individual milestones and the option to minimise losses by terminating development if
  • 32. unfavourable results occur. While being built on the decision tree, the evaluation does not only include the overall probability of success but also adequately refl ects the risk structure of projects. Therefore, the augmented NPV is sensitive to changes in the development plan if they affect the project ’ s risk structure. Augmented NPV refl ects the present value of the project. In addition, this fi nancial algorithm can be used to determine the potential future value of projects and portfolios assuming that subsequent milestones would be completed successfully. Project prioritisation decisions could refer to the relative and absolute value gain that the completion of a milestone of a particular their competitiveness. Information of the pricing environment and dynamics enable an assessment of a potential price range for the new drug. The uncertainty of assumptions can be analysed using Monte Carlo simulation which, however, is not regularly applied in pharmaceutical companies at present. Tornado diagrams illustrating the results of one-way sensitivity analysis are often preferred over simulations as they are more illustrative. ii. Focused market research : Interviews with key opinion leaders, experts, and health- care providers yield valuable informa- tion in early development, as physicians and insurances may adopt a much more
  • 33. pragmatic perspective towards drugs that scientists consider highly innovative. In addition, opinions may signifi cantly differ across the countries. Such information is used to refi ne the desk research-based forecast. iii. TPP conjoint analysis : In early R & D, conjoint analysis is an ideal tool to investigate physicians ’ attitudes towards (potential alternative) TPPs. Conjoint analyses are statistically relevant trade-off analyses in which physicians weight the relative importance of particular product attributes including price (if information on a feasible price range is particularly relevant, the conjoint analysis could include further customers, such as, eg insurers, formulary com- mittees, or HMOs). In early R & D, this analysis allows investigating whether a TPP or MPP is competitive and focuses on attributes that drive the choice of products. The analysis provides pref- erence shares for alternative TPPs or products. Thus, TPP conjoint analyses facilitate the defi nition of robust TPPs. In summary, building a desk research-based sales forecast reveals the relevant issues that may lead a product to market success or failure. Further enhancing the reliability of the Bode-Greuel and Nickisch
  • 34. © 2008 PALGRAVE MACMILLAN 1462-8732 J O U R N A L O F C O M M E R C I A L B I OT E C H N O L O G Y. VOL 14. NO 4. 307–325 OCTOBER 2008316 project would yield, in relation to its respective cost and probability of success. Furthermore, such analyses provide an optimum basis for license contracts with option elements, and for investors ’ decisions regarding exit strategies. Option pricing algorithms based on risk- neutral valuation are also investigated for their applicability to R & D projects. 16,17 The major argument is that it can be concluded from fi nancial theory that discounting in option pricing models would better refl ect the optionality of such projects. So far, there is no fi nal consensus among scientists and practitioners about the validity and advantages of option pricing methods compared to augmented NPV, and there is evidence that the results of both approaches converge and lead to similar conclusions if private risk is refl ected adequately. 17,18 This and the absence of experience with this abstract valuation algorithm have prevented its widespread implementation. Development portfolio management Most pharmaceutical companies apply a regular and systematic approach to review their portfolio of development projects. This
  • 35. is undertaken once or twice per year. The portfolio review usually comprises both qualitative and quantitative evaluations of individual projects ( Figure 3 ). Common qualitative parameters are strategic fi t and degree of innovation, while quantitative parameters include NPV and expected value uptake, project productivity (ie augmented NPV divided by risk-adjusted costs), (risk-adjusted) sales, probability of launch, time to launch, and (risk-adjusted) cost. Strategic fit Augmented (risk-adjusted, probabilistic) NPV Probability of develop- ment success Expected value uptake by development milestone Project productivity Expected near term and overall sales growth Budget and capacity Portfolio value and productivity
  • 36. Portfolio risk structure Project analysis Portfolio analysis Feasibility Optimize Value per investment Value at a comfortable level of portfolio risk Pipeline Degree of Innovation Pipeline characteristics Figure 3 : Commonly applied portfolio management metrics and criteria. Portfolio decisions in pharmaceutical R & D are usually built on both quantitative and qualitative criteria such as those shown above. From a purely fi nancial perspective, one would rank projects according to expected NPV and optimum productivity. This, however, ignores that future corporate growth requires a balanced pipeline which also includes early stage projects with lower expected NPVs. Furthermore, capacities need to be available and can usually not be allocated freely. Another issue is balancing portfolio risk to ensure that
  • 37. productivity goals are met. A proper strategic framework outlining growth and productivity goals and the therapeutic area focus serves as guidance for portfolio decisions. Effective data analysis tools facilitate the evaluation which combinations of projects would maximise value, sales growth, or the number of new launches. In addition, companies are currently establishing tools for capacity management to investigate more thoroughly which portfolio scenarios would be practically feasible. Value-driven project and portfolio managemen t in the pharmaceutical industry © 2008 PALGRAVE MACMILLAN 1462-8732 J O U R N A L O F C O M M E R C I A L B I OT E C H N O L O G Y. VOL 14. NO 4. 307–325 OCTOBER 2008 317 Data quality can be further enhanced by a comparative look across projects at the assumptions made in the evaluation. In larger companies, this may be most practical for projects within therapeutic areas. The major focus should be on validity and consistency among the probability estimates in development and on the assumptions underlying the sales forecasts. Ideally, the review process would involve senior function managers. This has two advantages: 1. input of senior expertise may improve the quality of the data and cross-project consistency and
  • 38. 2. the involvement of senior management in the portfolio evaluation process builds the basis for acceptance of valuation results in the prioritisation discussion. Interactive decision making as prerequisite for proper prioritisation decisions There is no single optimal portfolio, alternative solutions are usually feasible. Project scoring methods leading to While there is common agreement on portfolio management metrics in development, there are differences in the portfolio management process and in the preferences for particular project value indicators. For example, some companies establish quantitative project analyses only after PoC, while others start earlier. Furthermore, some perform a project-per- project review with little emphasis on cross-project comparisons, while many use templates displaying two or three value dimensions across projects in order to facilitate project prioritisation decisions. Data validation and buy-in of senior management If experts and project teams evaluate their own projects they may be subjective and sometimes overly optimistic. Subjectivity can be balanced effectively when the project evaluation meetings are moderated by an experienced individual, for example, a representative of the portfolio management function who has no stake in particular
  • 39. projects ( Figure 4 ). Senior Management Review of Key Assumptions Portfolio Management Workshop Communication to Functions Capacity Allocation Project Prioritization Portfolio Optimization Decision Tree Meetings Marketing Meetings DRAFT Project Evaluation Finalization of Project and Portfolio Models Potential re-iterations depending on senior management input Potential re-iteration if capacity constraints become apparent Figure 4 : Portfolio management process in fully integrated companies. The evaluation of development milestones and probabilities ( ‘ decision tree meetings ’ ) and the commercial analysis ( ‘ marketing meetings ’ ) of individual projects is usually performed on the project team level. A senior management review of the key assumptions across projects facilitates the establishment
  • 40. of valid and consistent assumptions. As capacity constraints may limit the operational execution of portfolio decisions, effective communication and interaction with functions facilitates the translation of project prioritisation decisions into feasible actions. Bode-Greuel and Nickisch © 2008 PALGRAVE MACMILLAN 1462-8732 J O U R N A L O F C O M M E R C I A L B I OT E C H N O L O G Y. VOL 14. NO 4. 307–325 OCTOBER 2008318 computated project ranking lists have therefore not found general acceptance. Instead, portfolio review meetings benefi t from thorough interactive discussion and the consideration of alternative prioritisation solutions. Corporate strategy leaves room for interpretation, decision makers ’ risk preferences may differ, and keeping the balance between short- versus long-term value propositions or new project versus lifecycle management investments is often a matter of diverging opinions. Therefore, robust portfolio decisions are best achieved in an interactive way. Individual opinions and attitudes of the participants become transparent. This paves the way for consensus and compromise that increases the chance that decisions are respected and translated into action on the operational level. Understanding evaluation results that
  • 41. comprise a set of parameters related to a set of projects is a complex pattern recognition task. The discussion strongly benefi ts from moderation by a representative of portfolio management who supports the participants to achieve a balanced view. Analysing an existing portfolio is a bottom- up approach that usually comprises the elements described below: i. Evaluation of the overall pipeline with respect to the distribution of projects across development stages and the frequency of expected future launches; identifi cation of gaps. ii. Prioritisation of projects based on multiple criteria: In a fi rst step, par- ticipants may agree on the ranking of projects with respect to individual criteria. Projects may rank high or low for different reasons, such as, for exam- ple, value, risk profi le, time to market, or sales volume. In a subsequent step, overall project priorities are defi ned. In addition to the criteria representing value, strate- gic and operative aspects may be relevant for the prioritisation of projects. Care is taken that not only late stage / high value projects are assigned high priority, because a systematic under-resourcing of early stage projects would result in late stage projects with short patent life and unfavourable profi le. Effi cient software
  • 42. tools can facilitate the investigation of alternative project prioritisation options that may, for example, differ with respect to maximising productivity, maximising near or mid-term sales growth, or minimising portfolio risk. iii. Identifi cation of projects with fi rmly assigned resources, identifi cation of remaining budget and capacities that will potentially be subject to reallocation. Depending on the size of the corporation, prioritisation decisions are either made across the whole portfolio or within business units or therapeutic areas. The latter model would require a corporate body that assigns resources to individual business units according to their relevance for the entire corporation. Preference for a ‘ fractionated ’ approach to project prioritisation usually depends on the overall number of projects and the corporate culture. An effective portfolio management process also requires reporting procedures to follow up actions taken upon decisions at the operational level. This facilitates establishing a culture of value-driven management. Capacity management An often underestimated prerequisite of successful portfolio management is appropriate capacity management. 19 The best portfolio management system cannot prevail if there is a signifi cant gap between available and needed
  • 43. capacities. The consequence of a lack of a capacity management system is not only that more or less all projects get delayed but also that the priority decisions are made on the working level, based on individual judgment and personal relationships. In prioritisation decisions in portfolio review meetings, the ranking should not just Value-driven project and portfolio management in the pharmaceutical industry © 2008 PALGRAVE MACMILLAN 1462-8732 J O U R N A L O F C O M M E R C I A L B I OT E C H N O L O G Y. VOL 14. NO 4. 307–325 OCTOBER 2008 319 process as an iterative business process, the links to corporate strategy for getting strategic directions and with project management for appropriate execution appear to be most important. Furthermore, an effective organisational link to business development would also be relevant as portfolio analysis indicates which in-licensing candidates and R & D partnerships would ideally complement the internal assets. In larger multinational organisations composed of strong and relatively autonomous business units covering particular therapeutic areas, the portfolio management process might
  • 44. be broken down in an inner business unit and a corporate portfolio management process. Observational evidence suggests that the most effective organisational model is one in which the portfolio management function is closely linked to the strategy and project management function, jointly reporting to either the CEO or another Board member that is neither responsible for R & D nor for commercial. Merck Serono is currently implementing such a model in order to enhance the cross-functional management of R & D and to improve alignment of portfolio decisions with strategic goals: all functions, along with portfolio management and business development, are represented in the new Executive Management Board reporting to the CEO. 20 PORTFOLIO MANAGEMENT IN RESEARCH AND EARLY DEVELOPMENT Not so long ago there was the general belief in the industry that research was hardly manageable and that portfolio management techniques were just not suitable for the discovery process. Arguments given were that changes in research direction would create a slowdown in productivity because the skill set is not readily transferable, the fi nancial value of projects could not properly be determined so early and that serendipity would play a major role anyway. 21 depend on the potential economic benefi t but
  • 45. also on the needed capacities to reach the goal (R & D effi ciency). Portfolio management in different organisational systems As with all new management concepts the organisational introduction of a portfolio management function has to be seen in the context of the overall organisational model that the respective company applies. The portfolio management process involves the entire R & D organisation and all commercial functions. In most organisations, R & D and Marketing & Sales are represented on the Board level by different individuals. Therefore, the fi rst question companies need to address is to which corporate body the portfolio management function should report. In principle, three organisational models are possible and as a matter of fact are found in certain companies. Either the portfolio management function reports to: Head of R & D Head of Commercial CEO / Head of Strategy, etc All models could be feasible, but they face different challenges in practice. As R & D and commercial functions are equally involved in the portfolio management
  • 46. process, the fi rst two organisational models are complicated by the requirement that one stakeholder reports into the other. This could raise bias concerns given that very often R & D and commercial are different in their perspectives. This issue is avoided by a model where the portfolio management function reports either directly to the CEO or to another Board member responsible for, for example, corporate strategy or business development. Another aspect that needs consideration is with which other functions portfolio management needs to collaborate. Given the very nature of the portfolio management • • • Bode-Greuel and Nickisch © 2008 PALGRAVE MACMILLAN 1462-8732 J O U R N A L O F C O M M E R C I A L B I OT E C H N O L O G Y. VOL 14. NO 4. 307–325 OCTOBER 2008320 Whereas past efforts focused mainly on decreasing the time to reach the next milestone and fi nally the time of launch it can be questioned whether further reductions in development time are still feasible with reasonable efforts. The emphasis is shifting towards infl uencing attrition rates favourably,
  • 47. either by improving the quality of R & D execution or at least by terminating projects as early as possible by optimised decision making. 13 Doing things right is no longer enough, doing the right things becomes the rule of the game. This paradigm shift is currently increasing the awareness that portfolio manage ment techniques could contribute signifi cantly by ensuring that: Portfolio value increases – by killing low value and unproductive projects early Portfolio risk is well balanced – by working on an appropriate ratio of validated and non-validated targets Research targets support the franchise strategy – by defi ning a franchise strategy Prerequisites for portfolio management in research and early development As for development, there is one very important prerequisite for the successful introduction of portfolio management in research – a proper strategic framework. Furthermore, tools applied in development portfolio management, such as, for example, the stage gate decision process, TPPs, and time line, budget, and risk analysis are increasingly used in early R & D. TPPs in early R & D
  • 48. TPPs in discovery research outline the pharmacological, safety, and technical profi le required for compounds to enter clinical development. Fulfi lling such predefi ned criteria would create reasonable confi dence that the optimal drug has been selected and • • • that clinical trials can succeed. TPPs in research and development that are well aligned with each other and with strategic objectives in a cross-functional process serve as ideal tool to manage the interfaces between discovery research, development, and marketing. Evaluation of individual projects along a stage-gate decision process For the drug research process the following phases can be defi ned: target selection, assay design, lead discovery, lead optimisation, and candidate profi ling (also called preclinical development, required for entry into man), see Figure 5 . Every project needs to be evaluated at the end of each phase based on the achieved data. A set of milestone criteria is defi ned according to the TPP that must be fulfi lled to let the project move into the next phase. Some of the go / no-go criteria may be quantitative like
  • 49. affi nity and selectivity of a compound for particular receptors, others may be more qualitative, like competitive edge versus competitors or attributes for which no validated animal models might be available. As in advanced development, a stage-gate process only for individual project decisions would, however, fail. With the decision to move a project into the next phase a certain amount of resources, either internal or external, is to be allocated. It has to be made sure that these resources are not already utilised by other projects the organisation is working on. In case bottlenecks are determined, debottlenecking strategies need to be developed or clear prioritisation decisions have to be made for the entire portfolio. Regardless of the capacity issue, what appears to emerge as best practice in early R & D is that individual compounds are considered from the perspective of the selected pathway in comparison to other targets under investigation for the respective disease area. Trade-off decisions are made to optimise the entire franchise portfolio. Value-driven project and portfolio management in the pharmaceutical industry © 2008 PALGRAVE MACMILLAN 1462-8732 J O U R N A L O F C O M M E R C I A L B I OT E C H N O L O G Y. VOL 14. NO 4. 307–325 OCTOBER 2008 321
  • 50. TPP risk : Risk that the compound will not meet the specifi ed effi cacy and safety targets of the TPP. Competitive risk : Risk that the predefi ned TPP will not create a differentiated product with a unique selling proposition. Companies may apply a scoring model that provides an overall judgment of project risk. Recently, some discovery organisations made favourable experience with decision tree analysis, allocating probabilities of success to each milestone of the stage gate model based on the criteria used for go / no-go decisions. 23 Probability assessments also enable the establishment of a pipeline model for discovery research, indicating the expected number of compounds entering Phase I or completing PoC per unit of time, related to a defi ned budget and capacity. Pipeline models in research have proven to be extremely useful in managing and monitoring productivity and performance in early R & D. Financial evaluation At present, there appears to be a general agreement in the pharmaceutical industry that it does not make sense to do detailed fi nancial • • Project risk analysis While there is a lot of experience with
  • 51. project risk analysis in drug development, systematic risk and probability analysis is less established in drug discovery. It has been particularly diffi cult for project teams in discovery research when they worked on innovative targets in the absence of any reference data. Since recently, industry benchmarks are also available for the drug discovery stage, referring to the stage-gate decision model. These benchmarks have become particularly useful as many companies adopted the stage-gate research process. In some disease areas, commonly accepted animal models are available that are to a certain extent validated for their predictivity of effi cacy in man. To characterise the risk profi le of individual projects, the following risk dimensions are evaluated: Compound risk : Risk that the compound will fail due to defi ciencies of the specifi c molecule. Mechanism risk : Risk that the biochemical mechanism does not work in pharmacological models and in man as expected. • • Assay design
  • 52. go stop Lead discovery go Candidate profiling (preclin. dev.) go stop Phase I go stop Lead optimization go stop stopTarget selection Figure 5 : Stage-gate decision process in discovery research. Many companies have implemented a stage-gate decision process in drug discovery and manage their
  • 53. research along milestones such as those indicated above. Some companies have recently implemented an organisational model in which the responsibility of discovery research extends up to PoC. As in clinical development, go / no-go criteria are defi ned for each milestone according to the TPP that must be fulfi lled to continue research. Companies usually set time lines for the achievement of milestones. Discovery research is nowadays also covered by benchmark initiatives which provide average success rates, time lines, and resources used per milestone. Bode-Greuel and Nickisch © 2008 PALGRAVE MACMILLAN 1462-8732 J O U R N A L O F C O M M E R C I A L B I OT E C H N O L O G Y. VOL 14. NO 4. 307–325 OCTOBER 2008322 analyses in the research stage. The main argument is that at this point effi cacy and differentiability might not have been established and that the effective dose in man and the COGS are not known. What is used instead is a kind of ranking based on epidemiology and market data, leading to an estimate of the sales potential: High economic value >1bn US $ Moderate economic potential >500m < 1,000m US $ Low economic potential < 500m US $ The resulting conclusions will depend
  • 54. on the company ’ s commercial situation, with larger organisations defi ning cut off numbers under which a further development does not appear to be appropriate, and projects may be terminated only for commercial reasons. There are circumstances in which full NPV analyses are performed in early R & D. For example, companies establish detailed fi nancial models in licensing situations. Biotechnology companies benefi t signifi cantly from quantitative fi nancial evaluation for early stage projects, as these create a rational basis for fund rising and licensing purposes, especially if risk is explicitly addressed and quantifi ed. Thus, biotechnology companies often establish more detailed and precise quantitative modelling for early projects than pharmaceutical companies, which sometimes even comprises primary market research. NPV analyses are also applied during the discovery to PoC stage in fully integrated pharmaceutical companies. In research portfolio management, such analyses allow to quantify the contribution of early research to the overall R & D value chain. In addition to using the number of drugs entering clinical development or completing PoC as productivity measure, the value added by completing individual preclinical milestones can be quantifi ed based on the augmented NPV model. 15 It is used to demonstrate the fi nancial benefi t of investing in particular •
  • 55. • • projects and to identify the value drivers in early R & D. Research portfolio evaluation Besides the gating decisions for individual projects that should be done as soon as the required data are available, it is common practice to review all projects every 6 – 12 months. 19 In such reviews projects compete with each other. The primary focus of review meetings is to have a holistic view of the whole portfolio. The number of projects in the different phases of research is evaluated in order to make sure that the overall productivity targets are met. In addition, these meetings serve to analyse whether the overall portfolio risk profi le, for example, the ratio of validated to unvalidated targets, is as intended and whether the research projects are properly aligned with the agreed company or business unit or franchise strategy. It is very important that if in such meetings the projects from different research sites are compared, a common understanding is established on how to measure progress, how to set standards and how to defi ne milestones. Beyond evaluating individual projects, an assessment of the status of the different franchises can be done. Issues of competitiveness, ways to improve strategically and operationally need to be addressed
  • 56. regularly. Scoring methods At present, most research organisations have established scoring systems for portfolio evaluation. Although it appears that every company has developed a specifi c set of criteria along which their projects are rated there appears to be common sense that at the following items should be covered: Value : Scoring around market size, attractiveness, and competitiveness; if NPV models are established, parameters such as NPV and the realised or future expected value uptake upon successful • Value-driven project and portfolio management in the pharmaceutical industry © 2008 PALGRAVE MACMILLAN 1462-8732 J O U R N A L O F C O M M E R C I A L B I OT E C H N O L O G Y. VOL 14. NO 4. 307–325 OCTOBER 2008 323 the highest number of priority ratings per project. One inherent problem of scoring systems but also of predefi ned milestone decisions is that projects are compared against a minimal acceptable standard to move forward. These tools do not take into account the overall capacity available.
  • 57. Portfolio risk evaluation One of the primary goals of portfolio management is to ensure that the portfolio is well balanced with respect to the potential risks and rewards. Experience has shown that focusing exclusively on ‘ me toos ’ is as dangerous as only concentrating on very exciting but unvalidated targets. There is no single optimal portfolio throughout the industry. Every organisation has to defi ne the level of risk that optimally supports the strategy. As the strategy gets reviewed from time to time so has the risk profi le of the research portfolio to be adapted from time to time. In order to characterise the overall portfolio risk structure, research projects could be classifi ed along the following groups: Pioneer : No known competition. Novel : Other companies work on the same target but target is not validated in man. Back up : In-house programme exists in development for same target. Fast follower : Target has been validated in the clinic by another company. Me Better : Pursuing a target that other companies have already successfully launched. It is quiet obvious that the more pioneer projects a company pursues the more risky the portfolio becomes. If probabilities of success are determined for project milestones,
  • 58. pipeline models as described above can serve as highly educational tools to monitor project and portfolio risk and past and expected future productivity. • • • • • completion of milestones are included as value indicators. Cost : High, medium, low, either for research cost alone, or including development cost. Timing : Time to entry into clinical development / PoC / launch, expected time per milestone. Strategic fi t : Score against therapeutic area strategy. Risk / probability of success : Scoring against TPP and milestone criteria. Some other organisations apply a larger range of criteria and rate every item with high, medium and low. Potential meaningful criteria are: Innovation potential Specifi city Effi cacy Tolerability
  • 59. Appropriate early clinical PoC / availability of biomarkers Preclinical feasibility Clinical feasibility Degree of unmet medical need Competitiveness Number and categories of competitors Patent status Peak sale potential Potential follow-on indications Although good arguments can probably be given for any of these criteria, the experience speaks for using as little as possible items because the likelihood that the scoring system does not provide enough differentiation between the projects increases with the number of criteria used. This is particularly true for the middle of the ranking. 19 If the scoring system were used for prioritisation decisions, the so-called ‘ forced ranking approach ’ should be applied. All potential pairs of projects are compared against each other and the higher prioritised project is determined, respectively. At the end the project portfolio is ranked according to • • • •
  • 60. • • • • • • • • • • • • • Bode-Greuel and Nickisch © 2008 PALGRAVE MACMILLAN 1462-8732 J O U R N A L O F C O M M E R C I A L B I OT E C H N O L O G Y. VOL 14. NO 4. 307–325 OCTOBER 2008324 SUMMARY Modern portfolio management techniques can play an instrumental role in enhancing the overall productivity of pharmaceutical R & D. The fact that portfolio management has been applied for some time by the major pharmaceutical companies while productivity did not increase is no disproof for the statement because the productivity crisis has many facettes, and productivity might have been even worse without portfolio management. In addition, portfolio analysis does not automatically result in objective
  • 61. and rational management decisions. The portfolio management process needs to be cross-functional, involving the entire organisation. It requires the discipline to develop and constantly apply a set of tools in order to allocate the scarce resources to the most promising projects. Keeping portfolio management alive and effective vis- à -vis corporate reorganisations and scientifi c paradigm shifts is a continuous organisational effort. Emphasis should be given to the following items: Defi ne the business strategy and align the entire organisation behind it. Develop and constantly update a TPP for every project. Defi ne clear go / no-go criteria for every milestone. Set up a tool to evaluate the potential value of all projects either through in- depth fi nancial analyses for later stage projects or based on a semi-quantitative scoring system for earlier projects; do quantitative fi nancial modelling for early- stage projects to investigate the expected value uptake upon successful completion of milestones and to facilitate licensing negotiations. Install a capacity management system in order to avoid a disparity between available resources and the number of projects. In case there is a lack in
  • 62. capacity, be ready to make tough choices • • • • • and terminate the projects with the lowest value as early as possible. The organisational embedment of the portfolio management function needs special consideration. An organisational model in which the portfolio management function could closely collaborate with the corporate / business unit strategy function and the project management function appears to be most appropriate in the authors ’ experience to help increasing effectiveness and effi ciency in the overall drug development process. References 1 . Cervantes, M. (2004) www.AutomotiveForums.com, 12 August . 2 . USA Today (15th September, 2005) . 3 . Borman , S . ( 2006 ) . Improving effi ciency . Chem. Eng.
  • 63. News 84 (25) , 56 – 78 . 4 . Sharpe , P . & Keelin , T . ( 1998 ) . How Smith Kline and Beecham makes better research allocation decisions . Harvard Bus. Rev. , March – April, 5 – 10 . 5 . Slater , S . & Zwirlein , T . ( 1992 ) . Shareholder value and investment strategy using the general portfolio model . J. Manage. 16 , 717 – 732 . 6 . Seget , S . ( 2005 ) . Pharmaceutical project and portfolio management – Effective organization and decision making . Business Insights , Business Insights Ltd . 7 . Ahmed , N . ( 2005 ) . Effective portfolio, project management, and resource allocation for enhanced competitiveness , presented at Drivers, Roles And Challenges of Portfolio and Project Management in Pharmaceutical Industry Conference , May 2005, Brussels . 8 . Heaslip , R . ( 2005 ) . Pharmaceutical portfolio management – What’s working, what’s not? DIA Annual Meeting, June 2005 . 9 . Townson , D . ( 2006 ) . Establishing portfolio value metrics , in , 7th Annual Rx and Biotech Portfolio Management Conference , January 2006, Philadelphia .
  • 64. 10 . www.fda.gov/cder/meeting/riskmanagement.htm . 11 . Bode-Greuel , K . ( 2007 ) . The management of risk in pharmaceutical R & D , in , The R & D Management Conference 2007 , July 2007, Bremen . 12 . www.fda.gov . 13 . Kennedy , T . ( 1997 ) . Managing the drug discovery/ development interface: can the pharmaceutical industry reduce attrition rates? Drug Discov. Today 2 (10) , 436 – 444 . Value-driven project and portfolio management in the pharmaceutical industry © 2008 PALGRAVE MACMILLAN 1462-8732 J O U R N A L O F C O M M E R C I A L B I OT E C H N O L O G Y. VOL 14. NO 4. 307–325 OCTOBER 2008 325 management more effective . Research-Technol. Manage. , March – April, pp. 18 – 33 . 20 . Kirschbaum , B . ( 2007 ) . Drug discovery at Merck Serono – striving for best pharma , in , R & D Leaders ’ Forum , October 2007, Munich . 21 . Nakagaki , P . ( 2001 ) . presented at Portfolio Optimization for Pharmaceuticals Conference , November
  • 65. 2001, London . 22 . Zoche , M . ( 2007 ) . Risk assessment of drug discovery projects as an integral part of portfolio management , Thesis for the Master of Science in Pharmaceutical Medicine, University of Duisburg-Essen, April 2007 . 23 . Artuso , A . ( 2005 ) . Using decision analysis and portfolio management to enhance R & D performance , presented at Drivers, Roles and Challenges of Portfolio and Project Management in Pharmaceutical Industry Conference , May 2005, Brussels . 14 . Kola , I . & Landis , J . ( 2004 ) . Can the pharmaceutical industry reduce attrition rates? Nat. Rev. , August, pp. 711 – 715 . 15 . Bode-Greuel , K . & Greuel , J . ( 2005 ) . Determining the value of drug development candidates and technology platforms . J. Comm. Biotechnol. 11 (2) , 155 – 170 . 16 . Kellogg , D . & Charnes , J . M . ( 2000 ) . Real options valuation for a biotechnology company . Assoc. Investment Manage. Res. , May/June, 76 – 84 . 17 . Brach , M . A . & Paxson , D . A . ( 2001 ) . A gene to drug venture: Poisson options analysis . R & D Manage. 31 (2) , 203 – 214 .
  • 66. 18 . Smith , J . E . & Nau , R . F . ( 1995 ) . Valuing risky projects: option pricing theory and decision analysis . Manage. Sci. , May, 795 – 816 . 19 . Cooper , R . , Edgett , S . & Kleinschmidt , E . ( 2000 ) . New problems, new solutions: Making portfolio Reproduced with permission of the copyright owner. Further reproduction prohibited without permission. I. Introduction A business scorecard (or BSC) is a tool which can produce many beneficial outputs, if utilized correctly. The BSC, by its nature, serves as a frame by which firms can create a simple and straight-forward presentation of multiple aspects of their firm’s strategy. These components fall into four general categories: Financial, Customers, Internal Processes and Learning & Growth. BSC’s can lend a firm an easy to show tool which illustrates how its strategic approach, implementation, as well as procedural facets and processes all lay out and are intended to function. As the card acts as something of a canvas, it lends a clear “map” of sorts, which empowers both leaders and employees a “line of sight,” into how the various pieces it captures interplay with each other. How? As the BSC is a comprehensive tool, those who use it can decipher how the firm’s various strategic objectives are not only constructed, but how they impact each other; this of course also applies to the outputs tied to each objective as well as overall productivity.
  • 67. However, BSC’s are not without their drawbacks. For example, the BSC, if it meant to operate at a maximum output, must have buy-in from all members of leadership. A lack of such buy-in can cause lack of alignment on how the BSC is built, how effectively it is set up and can cause negative downstream impacts due to lack of leadership cohesion. In that same vein, if leadership lacks a clear, unified vision of how the BSC should be leveraged, not only will the BSC itself not be “set up for success,” so to speak, but the inevitable outcome will be the firm will go in an unforeseen direction, this will foster risk factors and other harmful facets to manifest while the new strategy is being stood up. Ultimately, a tool intended to create order and structure may foster chaos and disorder instead. Ergo, unified vision is critical before a BSC can be properly built. A. Financial In this Value-Driven Project the main objective is to reduce product cost for the consumer while increasing productivity and manufacturing. This can be a difficult task but can be done while utilizing the Balanced Scorecard (BSC) method. The financial component of the balanced scorecard is certainly important. It is used as a budgeting tool as the company forecasts their financials. The BSC requires the entire management team to make plans beforehand in anticipation for issues that may arise. Having a financial plan in place could help mitigate costly mistakes and potentially increase revenue for teams, such as in research and development, as well as the costs of drug production. This method also incorporates performance reviews of both short-term and long-term goals. A disadvantage I believe would be the time and money it would take crafting the BSC strategy. This is a value driven project, and the market is looking for ways to cut cost on drugs for their consumers as well increase productivity. While precision is key, proper time management should be the focal point of this project as well as a well-managed budget. B. Customer
  • 68. Who are we as companies and business leaders without our customers and their perspectives? To discover the answer to this question, this researcher is going to investigate the importance of the customer perspective via the balanced scorecard in this week’s research assignment. Among the critical concepts found within the customer perspective in a balanced scorecard, this research investigated the following critical elements as they tie into the Customer Perspective within the Balanced Scorecard: · Enhancing personal relationships with customers · Customer satisfaction · Customer loyalty – attaining and retaining customers · Create value – brand, and reputation Enhancing personal relationships with customers has become key to the success of business globally as customers now desire that their voices and opinions be counted. By focusing on enhanced personal relationships with customers, companies will create increased value, reduce risks, and find extensive opportunities to gain and retain customer and brand loyalty (Branded Customer Service: Implementing the Customer Perspective of the Balanced Scorecard to the Ranching Industry, 2021). Businesses should carefully align their customer strategies that are on target with their company goals and mission statements to gain customers who will remain loyal to their brand and image. Customer satisfaction and loyalty go hand and hand in today’s competitive global markets. Companies that understand their customer’s perspectives will gain an edge over their competitors in their ability to meet and often exceed at satisfying their customers. Today’s customers want both value and timely deliverance of expected value. The end goal is customer satisfaction is to maintain a method in which time, quality, customer experience, cost, and company performance be measured. This may involve focusing on three key areas: operations, excellence, and customer relations (Balanced Scorecard (BSC) – A Strategic Management Tool, 2021). Companies who focus on valuing their
  • 69. customersanddeliveringcontinuous value will be successful in meeting the Customer Perspective in this key element in the Balanced Scorecard. Creating Brand and Value comes from a continuous focus on customer service and customer satisfaction. To measure their ability to meet their branding and value goal company’s today often turn to Key Performance Indicators (KPI’s). These performance metrics were gathered via customer surveys. And although the goal is to measure brand and value, these surveys can often provide additional critical data which can help companies improve their performance. Among the results we may find the following customer results leading to new objectives: Overall Satisfaction, Satisfaction Improvement, Customer Service, Customer Retention, Active and Resolved Issues, and Arranged Improvement Times (14 Key Performance Indicators (KPIs) to Measure Customer Service, 2021). Focus on any or, all the above KPI’s will promote success and redirection of strategies as needed. C. Internal Business Process What processes and methods do we need to define to follow by our customers and financial goals? That is the question to which this perspective intends to respond. Here, we need to define the internal operational objectives and targets or what does the company needs to set up, and how does the company need to perform well to enhance the efficiency and its productivity? Internal operational goals might include like: · Process enhancements (like reorganization an internal endorsement process) · Improving the quality (like lessening manufacturing waste) · Keep usage to a minimum (utilizing innovation to help effectiveness). (Agarwal, 2020) D. Learning and Growth Our goal is to increase the productivity of the drug development process (while utilizing Portfolio management)
  • 70. while making drugs that are cheaper and more affordable. Our strategic objectives are developing in-house tools for project efficiency, drive value driven project management and improve our team members skills sets. Our KPIs (key performance indicators) for these objectives will be implementing lessons we have learned, a new learning management system, and we will conduct quarterly skill set audits to ensure our team members have gone through the necessary trainings to achieve the level of success we are aiming for in present and future projects. The initiatives our team will take are the following. We will be creating and publishing a lesson learned chart available to all team members. This will consist of past research projects so we can use it as a resource for our new research projects. We can look at this and use our past experiences knowing what worked and did not work. This will help with delays and setbacks in R&D. We will use a learning management system from our in-house training team to ensure our team members are going through all the same trainings and getting the same information. We will also guarantee there is buy-in for the value driven project management. By conducting continued education of our skills for all team members will make sure we all have the requirements to successfully achieve our goals of our current projects and future ones. If there are ever any gaps of our skills, we will have the continued ed. there to help us out as well as for our future team members. II. Conclusion As the project moves forward into its next milestones, with the BSC built out and other project documents in process of crafting, it will be critical for the project teams to ensure the BSC is created in a unified mindset, with buy-in from all key stakeholders; further, that if any strategic changes must be implemented further downstream, that the BSC is updated accurately to reflect this. Finally, that all team members can not only see the overall strategy as presented in the BSC, but how they, themselves fit into the larger vision also.
  • 71. References Agarwal, R. (2020). Perspectives in Balanced Scorecard (4 Perspectives). Retrieved from https://www.yourarticlelibrary.com/accounting/performance- measurement/perspectives-in-balanced-scorecard-4- perspectives/53100 Hans-Ulrich Krause, Dayanand Arora. Key Performance Indicators for Sustainable Management: A Compendium Based on the “Balanced Scorecard Approach.” De Gruyter Oldenbourg; 2019. Accessed November 5, 2021. https://search-ebscohost- com.ezproxy.snhu.edu/login.aspx?direct=true&db=nlebk&AN=2 317397&site=eds-live&scope=site Nunn LG, Marshall T, Brown “Donald” Donnell. Branded Customer Service: Implementing the Customer Perspective of the Balanced Scorecard to the Ranching Industry.Rangelands. 2007;29(2):28-32. doi:10.2111/1551-501X(2007)29[28:BCSITC]2.0.CO;2 Pramudita, CD. The Balanced Scorecard as Strategic Controlling Instrument. Introducing the Indicators- Based BSC for Implementation of a Corporate Strategy from Four Different Perspectives. Anchor Academic Publishing; 2016. Accessed November 5, 2021. https://search-ebscohost- com.ezproxy.snhu.edu/login.aspx?direct=true&db=nlebk&AN=1 412506&site=eds-live&scope=site Repository.arizona.edu. 2021. Branded Customer Service: Implementing the Customer Perspective of the Balanced Scorecard to the Ranching Industry. [online] Available at: <https://repository.arizona.edu/bitstream/handle/10150/639694/ 12251-11799-1-
  • 72. PB.pdf?sequence=1&isAllowed=y> [Accessed 7 November 2021]. Small Business Trends. 2021. 14 Key Performance Indicators (KPIs) to Measure Customer Service. [online] Available at: <https://smallbiztrends.com/2015/03/how - to-measure-customer- service.html#:~:text=%2014%20Key%20Performance%20Indica tors%20%28KPIs%29%20 to%20Measure,are%20happy%20with%20the%20service%20you ...%20More%2 0> [Accessed 7 November 2021]. Www-sciencedirect-com.ezproxy.snhu.edu. 2021. Sign into your account. [online] Available at: <https://www-sciencedirect- com.ezproxy.snhu.edu/sdfe/pdf/download/eid/1-s2.0- S0190052807500222/first-page-pdf> [Accessed 5 November 2021]. 2 | Page