Suppress lung cancer progression via up regulation of linc rna-p21
CoH Summer Academy 2016 Poster (Lauren)
1. Glioblastoma multiforme (GBM), one of the most aggressive and deadly of
human cancers, is notable for the wide variation seen between patient
tumors. Patient tumors have been stratified by expression profiling or overall
survival. While the tumor subtype classifications that have emerged vary,
there is a consensus that two ends of the spectrum are anchored by the
proneural (PN) and mesenchymal (Mes) subtypes. PN tumors are associated
with preferential expression of neural stem and progenitor cell markers, and
Mes tumors with mesenchymal markers and markers of epithelial-to-
mesenchymal transition (EMT) (Verhaak, Roel et al., Cancer Cell; 2010).
Substantial heterogeneity is also observed within individual tumors; different
regions of a single tumor can be classified as PN or Mes (or other subtype),
and within regions cells can differ markedly in expression of tumor antigens
(such as those potentially serving as immunotherapy targets). Additionally,
many of the cells within a tumor focus are non-tumor; for GBM up to one-
third of total cells may be microglia and tumor associated macrophages.
We are interested in understanding how microglia and macrophages influence
tumor cell dissemination and tumor progression. In this study we examined
how GBM molecular subtype and differentiation status influence its ability to
bind chlorotoxin. Chlorotoxin is a toxin derived from the deathstalker scorpion
(Leiurus quinquestriatus) and has been shown to inhibit the ability of GBM to
migrate (Mcferrin, Sontheimer et al., Neuron Glia Biol; 2006). The conjugate
of Cltx-Cy5.5 has been used successfully in tumor resection to identify
malignant GBM (Butte et al., Neurosurg Focus; 2014).
Tumor associated machrophages (TAM) secrete a number of proinflammatory
cytokines including tumor necrosis factor (TNF). In previous studies, we have
reported that in vitro, TNF upregulates GBM cell expression of the adhesion
molecule VCAM-1 (Mahadev et al., PLoS One; 2014). To compare GBM cells of
varying molecular subtype and differentiation status, we used patient-derived
primary glioma cell lines characterized by TCGA signature gene expression as
PN or Mes (Brown et al., PLoS One; 2013).
We utilize a novel “dot migration assay” designed to recapitulate in vivo brain
tumor dissemination along blood vessels and associated ECM (Baghdadchi et
al., in preparation). We measure radial spatial dependence of migration
distance, expression of tumor adhesion molecules (and other proteins) by
immunofluorescence, expression of physiological markers such as CD44 for
proliferation, tumor cell morphology and physical interactions with other
tumor cells, and other properties of interest.
In this series of experiments we are examining the invasive and proliferative
properties of patient-derived proneural (PBT003) and mesenchymal (PBT030)
GBM cell lines in relation to exposure to TNF over a period of six days (as
would be seen with chronic exposure in vivo).
While this study is on-going, these observations suggest that patient tumor
responses to activated microglia and macrophages may be regionally
disparate depending on local molecular subtype. Whether local monocyte
polarization is also heterogeneous remains to be determined.
METHOD OF DOT MIGRATION ASSAY VISUALIZATION OF RELATIVE ANTIGEN EXPRESSION AT THE SINGLE CELL LEVEL
CONCLUSIONS
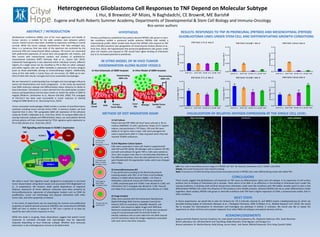
These results suggest that glioblastoma cell responses to TNF varies by differentiation status and cell subtype, in its expression of cell surface
proteins and its binding of chlorotoxin-Cy5.5 complex. There seems to be little to no difference in the binding of chlorotoxin-Cy5.5 under the
varying conditions; if anything, both cell lines bound more chlorotoxin under stem-like conditions with TNF added. Another point to note is that
differentiated PBT003 cells under the influence of TNF produces more VCAM1 proteins, whereas PBT030 cells do so under differentiation media
regardless. Most notably, PBT030 cells grown in stem-like conditions with TNF have a higher expression of CD44, a mesenchymal marker, than in
other conditions.
Heterogeneous Glioblastoma Cell Responses to TNF Depend on Molecular Subtype
L Hui, B Brewster, AP Mizes, N Baghdadchi, CE Brown#, ME Barish#
Eugene and Ruth Roberts Summer Academy, Departments of Developmental & Stem Cell Biology and Immuno-Oncology
#co-senior authors
IN VITRO MODEL OF IN VIVO TUMOR
DISSEMINATION ALONG BLOOD VESSELS
In Vivo Schematic of GBM Invasion In Vitro Model of GBM Invasion
Blood
Vessel
ECM Primary
Tumor Mass
Disseminating
GBM cells
Cover
Slip
Matrigel Seeded Tumor
Cells
Disseminating
GBM cells
MAPK
NFκB
VCAM-1
TNF
TNFR
VCAM-1 TAM
TF
VLA-4
Ki-67
TNF Signaling and Increase in VCAM-1 Expression
1) Plated 10µL
dot of cells;
Incubated 4-5 hours
2) Flooded with
500µL of media;
Incubated 3 days
3) Changed to
fresh media;
Incubated 3 days
4) Fixed cells and
performed IF
1) Cell Culture
Patient-derived PBT GBM cell lines8 were cultured in 30 mL
medium (DMEM/F-12 with L-glutamine, Hepes, B-27, heparin
sodium, and pen/strep) in T75 flasks; EGF and FGF were
added at 10 ng/mL every 3 days. Cells were passaged and
used in experiments after 5-7 days of growth when they had
reached 70-80% confluence.
2) Dot Migration Culture System
Cells were suspended in stem-cell medium supplemented
with EGF and FGF (SCM), 3% Matrigel, with or without 2% FBS
and with and without 10 ng/mL TNF-α. Cells were seeded as
10 μL dots on glass cover slips in a 24-well plate (therefore at
five different densities). Once the cells adhered (4-6 hr), wells
were flooded with the appropriate media, which was changed
after 3 days.
4) Image Analysis
Slides were scanned with the Hamamatsu NanoZoomer
Digital Pathology Slide Scanner separate channels for
Hoescht (350 nm excitation), Alexa488, Alexa555, and
Alexa647, and viewed as digital images with NDP.view.
Maximum amplitude projections of Z-stacks were produced
using ICY and processed with FIJI and Cell Profiler to
identify individual cells on each slide from the DAPI channel
and the luminance values for antigen expression associated
with each cell on the other channels.
ACKNOWLEDGEMENTS
Eugene and Ruth Roberts Summer Academy: Drs. Kate Sleeth and Paul Salvaterra, Ms. Stephanie Patterson, Mrs. Sarah Bannister
Barish Laboratory: Drs. Michael Barish and Ying Wang, Blake Brewster, Cindy Nguyen, and Dongyu Cui
Bosma Laboratory: Dr. Martha Bosma, Kelly Duong, Lauren Hood, Josh Swore, Mitchell Krawczyk, Chris Vong, Garrett Collett
Left: Four-color immunofluorescence image of a PBT003 cell “dot” for Hoescht, Chlorotoxin-Cy5.5, VCAM-1 and CD44.
Middle: Cell nuclei fluorescence from Hoescht staining.
Right: Fluorescence of CD44 denoting mesenchymal-associated activity in PBT003 cells under differentiating media with added TNF.
CD44 LuminanceCell NucleiSlide Scan Image
RESULTS: RESPONSES TO TNF IN PRONEURAL (PBT003) AND MESENCHYMAL (PBT030)
GLIOBLASTOMA LINES UNDER STEM CELL AND DIFFERENTIATING GROWTH CONDITIONS
CD44
NEXT STEPS
In future experiments, we would like to stain for Annexin-A2, ClC-3 (chloride channel-3), and MMP2 (matrix metalloproteinase-2), which are
plausible binding targets of chlorotoxin (Kevasan et al., J Biological Chemistry; 2009; El-Ghlban et al., BioMed Research Int’l; 2014). We would
like to visualize the internalization of chlorotoxin and investigate any pathways it inhibits or activates. We would also like to repeat the
experiment on other cell lines and compare responses from other GBM cell subtypes and patient derived cell lines.
P B T 0 0 3 C T L X 5 0 L V
Average50LV
D iff C T L D iff T N F S C M C T L S C M T N F
0 .0 0
0 .0 5
0 .1 0
0 .1 5
P B T 0 0 3 V C A M 1 5 0 L V
Average50LV
D iff C T L D iff T N F S C M C T L S C M T N F
0 .0 0
0 .0 5
0 .1 0
0 .1 5
P B T 0 0 3 C D 4 4 5 0 L V
Average50LV
D iff C T L D iff T N F S C M C T L S C M T N F
0 .0
0 .1
0 .2
0 .3
0 .4
P B T 0 3 0 C T L X 5 0 L V
Average50LV
D iff C T L D iff T N F S C M C T L S C M T N F
0 .0 0
0 .0 5
0 .1 0
0 .1 5
P B T 0 3 0 V C A M 1 5 0 L V
Average50LV
D iff C T L D iff T N F S C M C T L S C M T N F
0 .0 0
0 .0 5
0 .1 0
0 .1 5
P B T 0 3 0 C D 4 4 5 0 L V
Average50LV
D iff C T L D iff T N F S C M C T L S C M T N F
0 .0
0 .1
0 .2
0 .3
0 .4
3) Immunofluorescence (IF)
IF was performed according to the Barish lab protocol
involving washes with TBS + 0.1% Triton X and antibody
dilutions in Mike’s Block Solution (MBS) + 1% Triton X.
Antibodies: polyclonal mouse anti-CD44 was diluted at
1:1000, polyclonal goat anti-VCAM-1 was diluted at 1:200, and
Chlorotoxin-Cy5.5 conjugate was diluted at 1:100. Hoescht
and Alexa-Fluor secondary antibodies were diluted at 1:1000.
Previous profiling has established that patient-derived PBT003 cells grown in stem-
like conditions exhibit a proneural profile whereas PBT030 cells exhibit a
mesenchymal profile. Other studies have found that PBT003 cells respond to TNF
with a PN-MES transition and upregulation of mesenchymal markers (Brown et al.,
PLoS One; 2013). We hypothesized that proneural glioblastoma cells grown under
stem cell medium and exposed to TNF would have higher binding of chlorotoxin
due to its increased potential to proliferate.
HYPOTHESISABSTRACT / INTRODUCTION