Mattingly "AI & Prompt Design: Named Entity Recognition"
FISM13 - 21112021.pdf
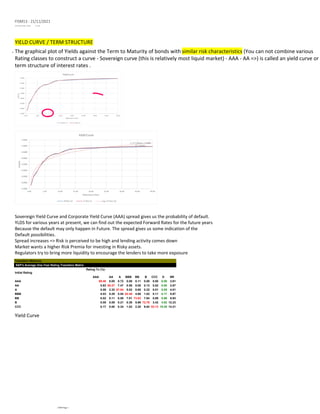
1. YIELD CURVE / TERM STRUCTURE
The graphical plot of Yields against the Term to Maturity of bonds with similar risk characteristics (You can not combine various
Rating classes to construct a curve - Sovereign curve (this is relatively most liquid market) - AAA - AA =>) is called an yield curve or
term structure of interest rates .
•
Sovereign Yield Curve and Corporate Yield Curve (AAA) spread gives us the probability of default.
YLDS for various years at present, we can find out the expected Forward Rates for the future years
Because the default may only happen in Future. The spread gives us some indication of the
Default possibilities.
Spread increases => Risk is perceived to be high and lending activity comes down
Market wants a higher Risk Premia for investing in Risky assets.
Regulators try to bring more liquidity to encourage the lenders to take more exposure
Transition Matrices
S&P's Average One-Year Rating Transition Matrix
Initial Rating
Rating To (%):
AAA AA A BBB BB B CCC D NR
AAA 88.46 8.05 0.72 0.06 0.11 0.00 0.00 0.00 2.61
AA 0.63 88.27 7.47 0.56 0.05 0.13 0.02 0.00 2.87
A 0.08 2.32 87.64 5.02 0.65 0.22 0.01 0.05 4.01
BBB 0.03 0.29 5.54 82.49 4.68 1.02 0.11 0.17 5.67
BB 0.02 0.11 0.58 7.01 73.83 7.64 0.89 0.98 8.93
B 0.00 0.09 0.21 0.39 5.98 72.76 3.42 4.92 12.23
CCC 0.17 0.00 0.34 1.02 2.20 9.64 53.13 19.29 14.21
Yield Curve
FISM13 - 21/11/2021
20 November 2021 17:28
FISM Page 1