Nepse technical analysis feb 15 feb 18, 2015 (eng & nep)
•
0 likes•333 views

Technical analysis of Nepal Stock Exchange (Nepse) index for the week from Feb 15, 2015 to Feb 18, 2015. The technical analysis includes summary, RSI, MACD and Bollinger band analysis. The analysis is done by Kriti Capital & Investments Ltd.

Recommended
Recommended
More Related Content
More from Kriti Capital & Investments Ltd.
More from Kriti Capital & Investments Ltd. (20)
Recently uploaded
Recently uploaded (20)
Nepse technical analysis feb 15 feb 18, 2015 (eng & nep)
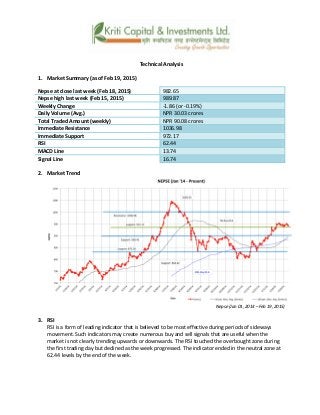
- 1. Technical Analysis 1. Market Summary (as of Feb 19, 2015) Nepse at close last week (Feb 18, 2015) 982.65 Nepse high last week (Feb 15, 2015) 989.87 Weekly Change -1.86 (or -0.19%) Daily Volume (Avg.) NPR 30.03 crores Total Traded Amount (weekly) NPR 90.08 crores Immediate Resistance 1036.98 Immediate Support 972.17 RSI 62.44 MACD Line 13.74 Signal Line 16.74 2. Market Trend Nepse (Jan 01, 2014 – Feb 19, 2015) 3. RSI RSI is a form of leading indicator that is believed to be most effective during periods of sideways movement. Such indicators may create numerous buy and sell signals that are useful when the market is not clearly trending upwards or downwards. The RSI touched the overbought zone during the first trading day but declined as the week progressed. The indicator ended in the neutral zone at 62.44 levels by the end of the week.
- 2. RSI (Jan 02, 2014 – Feb 19, 2015) 4. MACD The MACD is a momentum oscillator formed by using two different types of moving averages, which provides specific buying or selling signals. When a MACD line crosses above the signal line, it is considered to be a positive sign and indicates a time to buy, and vice-versa. The MACD line slid further below the Signal line this week as a result of low buying pressure in the market. Once again this week, the market momentum is in the downward direction. MACD (Jan 02, 2014 – Feb 19, 2015) 5. Bollinger Bands The Bollinger Band is a technical indicator that consists of a moving average (21-day) along with two trading bands above (upper band) and below it (lower band). The bands are an indication of volatility, which are represented by calculating standard deviation. Due to the decline in the market, Nepse has touched the mid-band this week, which currently acts as a support level. The tightening of the upper and lower bands suggest that there may be a sharp rise in volatility in the near future.
- 3. Bollinger Bands (Jan 02, 2014 – Feb 19, 2015) Overview: Similar to the previous week, Nepse has remained relatively stable this week as well. However, the market witnessed a minor decline of 1.86 points (or -0.19%) to close at 982.65 points during the 3- day trading week. The average daily market volume saw minor improvements to NPR 30.03 crores from NPR 28.63 crores the prior week. As a result of the sideways movement, Nepse was able to maintain above its support level of 972.17 points. During the shortened week, the RSI indicator, which had closed at 67.41 levels, fell further to 62.44 levels this week within the neutral zone. Since the MACD line crossed below the Signal line the week prior, the momentum continued on a downward trend this week as well. The Bollinger Bands indicate possibility of sharp rise in market volatility in the near future. Though there may be short term selling pressure in the near term, the 50-day moving average crossing above the 200-day moving average suggests the long-term market scenario remains positive.
- 4. k|fljlws ljZn]if0f ahf/ ;f/f+z -kmfNu'0f )&, @)&! ;Ddsf]_ aGb cªs -kmfNu'0f ^_ (*@=^% pRr cªs - kmfNu'0f #_ (*(=*& ;fKtflxs kl/jt{g –!=*^( –)=!( k|ltzt) b}lgs cf};t Jofkf/ ¿=#)=)# s/f]8 s'n ;fKtflxs Jofkf/ ¿= ()=)* ca{ tTsflng 6]jf !)#^=(* tTsflng k|lt/f]w (&@=!& cf/P;cfO{ ^@=$$ PdP;L8L !#=&$ l;Ugn nfO{g !^=&$ Nepse (Jan 01, 2014 – Feb 19, 2015)
- 5. l/n]l6j :6«]Gy OG8]S; -cf/P;cfO{_ cf/P;cfO{ k|fljlws ljZn]if0fsf] o:tf] cf}hf/ xf], h;nfO{ Pstlkm{ ?kdf rln/x]sf] ahf/df Jofkf/ /0fgLlt agfpg a9L pkof]uL dflgG5 . To;}u/L, o;n] ahf/df vl/b / ljlqmsf] :ki6 ;+s]t b]vfpg] u5{ . o; ;ftf sf/f]af/ lbgx?sf] klxnf] lbg ahf/n] cf]e/a6sf] l:ylt 5f]Psf] cj:yf /xof] t/ afFsLsf lbgx?df ahf/ cf]e/a6sf] l:ylt eGbf tn g} /xof] . kmn?j?k ahf/ ^@=$$ sf] Go"6«n cj:yfdf g} sfod /x]of] . RSI (Jan 02, 2014 – Feb 19, 2015) d'leª Pe/]h sGeh]{G; 8fOeh]{G; -PdP;L8L_ PdP;L8Ldf b'O{ cf]6f /]vf x'G5g, h;df Pp6fn] ahf/sf] lbzf kl/jt{gsf] ;+s]t u5{ eg] csf]{n] ahf/sf] k|j[lQ -6«]08_ b]vfpg] u5{ . olb PdP;L8L /]vfn] l;Ung /]vfnfO{ tnaf6 dfly sf6]df o;nfO{ ;sf/fTds ;+s]tsf ?kdf lnO{G5 / o;n] z]o/x? lsGg] ;+s]t ub{5 . o; ;ftf klg ahf/df lsGg] xf]8afhL sd g} /x]sf] x'Fbf PdP;L8L nfOg l;Ugn nfOg eGbf tn g} /xof] . h;n] ahf/sf] ultlzntfdf lu/fj6 sf] cj:yf g} sfod u/fof] . MACD (Jan 02, 2014 – Feb 19, 2015) af]lnªu/ Aof08 af]lnªu/ Aof08 Ps k|fljlws ljZn]if0f ;"rs xf] h;df @!–lbg] d'leË Pe/]hsf ;fy b'O{ Aof08 -Pp6f dfly_ / Pp6f tn_ x'G5g . lo Aof08x?n] cl:y/tfsf] ;+s]t ub{5g, h'g :6fG88{ 8]leP;g u0fgf u/]/ kQf nufO{G5 . o; ;ftf ahf/df cfPsf] lu/fj6sf] sf/0f g]K;] kl/;"rsn] dWo Aof08 5'g uPsf] 5 hf] xfn tTsfnLg 6]jf /]vfsf] ?kdf sfd ul//x]sf] 5 . pkNnf] Aof08 tyf tNnf] Aof08 sf] b'/Ldf cfPsf] sdLn] ahf/sf] cl:y/tf km]l/ a9g ;Sg] ;+s]t k|fKt eof] .
- 6. Bollinger Bands (Jan 02, 2014 – Feb 19, 2015) ;du{dfM of] ;ftf klg uPsf] ;ftf ;/x g]K;]kl/;"rsdf l:yt/tf g} sfod /xof] . t/ ahf/df cfPsf] ;fefGo lu/fj6sf] sf/0f kl/;"rsdf !=*^ cªsf] lu/fj6 dxz'; ul/of] h;sf] kmn:j?k # sf/f]af/ lbgdfq /x]sf] ;Ktfx kl/;"rs (*@=^%cªsdf ;dfKt eof] . ahf/sf] k|lt lbg cf};t sf/f]af/ /sddf s]xL ;'wf/ cfO{ #)=)# s/f]8 /xg uof] . g]K;]kl/;"rsdf sfod /x]sf] l:yt/tfsf sf/0f kl/;"rs tTsflng 6]jf cªs (&@=!& eGbf dfly g} /xg ;kmn /xof] . sd sf/f]af/ lbgx? /x]sf] ;ftf cf/P;cfO{ ^@=$$ cªsdf sfod /xg uof] h;n] ahf/ cem} klg Go"6«n l:ylt g} sfod /x]sf] ;+s]t ub{5 . PdP;L8L nfOg l;Ugn nfOg eGbf tn /xof] h;n] ahf/sf] ultlzntfdf lu/fj6 sf] cj:yf g} sfod u/fof] . af]lnªu/ Aof08n] ahf/sf] cl:y/tf s]xL a9g ;Sg] ;+Defjgf b]vfPsf] xF'bf ahf/df cfpg] ;do a]Rg] rfk a9g ;Sg]5 . %)–lbg] d'leË Pe/]hn] @))–lbg] d'leË Pe/]hnfO{ sf6L dfly /x]sf] cj:yfn] ahf/df cem} ;sf/fTds ;+s]tx? g} oyfjt /x]sf 5g .