2. University Hospital of Larissa and informed consent was obtained from all
participants in the study.
Image registration
Image sequences were registered manually using a graphical user
interface developed in MATLAB software platform. One of the images
of each sequence was selected as ‘reference’ and the remaining ‘mobile’
images were all registered (translated) to the reference. After image
registration, the most clearly depicted part of each vessel was used to
measure vessel diameter and blood velocity.
Diameter, velocity and PI quantification
Diameter was measured by drawing a line vertically to the
microvessel axis. Axial erythrocyte velocity was estimated from the
axial distance traveled by a red blood cell or a plasma gap, over a
fixed time interval. The blood flow pulsation corresponding to each
arteriole was quantified using the PI definition (Gosling and King,
1974):
PI ¼ Vpp=AVV
where Vpp stands for peak to peak axial velocity (maximum minus
minimum velocity) and AVV stands for the average velocity throughout
the cardiac cycle. The Vpp is shown graphically in Fig. 2(a).
Tyml and Groom (1980) proved that the velocity pulse period in the
capillaries of the frog sartorius muscle is practically identical to the heart
beat period, measuring independently the two kinds of period in a care-
fully designed study. Lee et al. (1994) reached at the same conclusion
for the muscle capillaries of a big mammal (goat) and Sugii et al. (2002)
and Nakano et al. (2003) did the same for the mesenteric arterioles of a
small mammal (rat). Therefore, in this work there was no heart rate
monitoring.
The PI is a dimensionless index which is equal to zero in the case of a
completely flat waveform (Vpp = 0) and equal to one when the peak to
peak ripple matches AVV.
Statistical analysis
The professional edition of Microsoft Office EXCEL 2003 and the
version 1.4 of the SOFA (Paton-Simpson & Associates Ltd.) software
was used for statistical analysis. Linear correlation was estimated with
Spearman's rank correlation coefficient (rs). The level of significance
was set at p b 0.05.
Results
Axial velocity was measured at 30 different precapillary arterioles
with diameters ranging from 6 up to 12 μm. A sum of 150 to 170 images
was acquired from each arteriole and a total of more than 5000 images
were registered to allow the subsequent off-line velocity waveform
measurements. All measured velocities ranged between 0.40 and
5.84 mm/s. The average velocity throughout the cardiac cycle (AVV)
ranged between 0.52 and 3.26 mm/s and peak to peak velocity (Vpp)
values ranged between 0.2 and 4.8 mm/s.
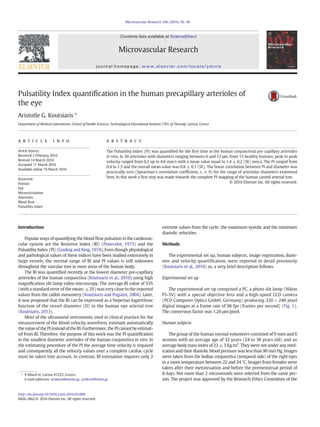
Using the estimated Vpp and AVV values, the Pulsatility Indices (PIs)
were estimated for each diameter (Fig. 2b). Each black dot in Fig. 2(b) is
the PI result from a column diagram similar to the one shown in
Fig. 2(a). The linear correlation between PI and diameter was practically
zero (rs ≈ 0) for the range of arteriolar diameters examined here. The
PIs ranged from 0.4 to 1.5 and their overall mean value was 0.8 ± 0.1
(SE).
Discussion
Axial blood velocity can be used for the estimation of indices such as
the RI and the PI and other hemodynamic parameters such as volume
flow Q and wall shear stress (WSS). WSS is a very important mechanical
stimulus for the endothelium and must be taken into account in the
design of in vitro models (Palmioti et al., 2014; Koutsiaris, 2015).
Some hemodynamic parameters (Q, WSS) depend heavily on
precapillary arteriolar diameter and a change of some micrometers
Fig. 1. A high speed digital camera attached to a slit lamp.
Fig. 2. (a) The velocity variation during the cardiac cycle is shown in columns. Each column is
the average of 2 or 3 velocity measurements from about 10 successive images. 96 successive
images correspond to 1 s. Peak to peak axial velocity is shown diagrammatically.
(b) Pulsatility Index (PI) values in the human eye pre-capillary arterioles are shown
as black dots. Each dot is the PI result from a column diagram similar to the one
shown in part (a). The correlation of PI to arteriolar diameter D was practically
zero. The mean PI (bPIN) was 0.8 ± 0.1 (SE).
37A.G. Koutsiaris / Microvascular Research 106 (2016) 36–38
3. in diameter can make a difference. For example, for a change of D from 6
to 12 μm the average WSS throughout the cardiac cycle decreases fivefold
from 10.5 down to 2.1 N/m2
(Koutsiaris et al., 2010). Nevertheless, other
parameters such as RI present a kind of “immunity” in diameter changes
since they vary little over a wide span of diameters (Koutsiaris, 2013).
From the results presented here, the correlation between PI and
diameter was found close to zero (rs ≈ 0) meaning that the PI for
D = 12 μm was practically the same as the PI for half the vessel diameter
(D = 6 μm).
For the majority (95%) of healthy male human population the heart
rate is between 53 and 89 bpm (beats per minute) (Milnor, 1990) and
the heart rate is higher in females than in males (Gillum, 1988). Consid-
ering the heart rate of 50 bpm as the lower physiological limit translates
to a cardiac cycle period of 1.2 s or to 115 consecutive image frames for
the CCD camera of this study. Therefore, the minimum number of 150
frames per arteriole was adequate for recording more than one cardiac
cycle.
In order to estimate the repeatability of the PI measurements, blood
velocity should be measured in the same arteriole for more than 5
consecutive cardiac cycles. This would require the acquisition of more
than 480 consecutive images from each arteriole and would also require
the use of automatic image registration and velocity measurement
techniques which were not available in this work.
The mean precapillary PI value was found to be 0.8. It would be
interesting to see how this changes in pathological conditions such as
carotid stenosis, sickle cell disease (Kord Valeshabad et al., 2015a,
2015c), unilateral ischemic stroke (Kord Valeshabad et al., 2015b) or
in other situations such as contact lens wearing (Jiang et al., 2014).
New automated axial velocity measurement techniques (Jiang et al.,
2014; Khansari et al., 2015; Landa et al., 2012) could provide help to-
wards this direction. In this work, a first step was made towards the PI
mapping of the human carotid arterial tree.
References
Gillum, R.F., 1988. The epidemiology of resting heart rate in a national sample of men and
women: associations with hypertension, coronary heart disease, blood pressure, and
other cardiovascular risk factors. Am. Heart J. 116 (1 Pt 1), 163–174.
Gosling, R.G., King, D.H., 1974. Arterial assessment by dopper-shift ultrasound. Proc. Roy.
Soc. Med. 67, 447–449.
Jiang, H., Zhong, J., DeBuc, D.C., Tao, A., Xua, Z., Lam, B.L., Liu, C., Wang, J., 2014. A functional
slit lamp biomicroscopy for imaging bulbar conjunctival microvasculature in contact
lens wearers. Microvasc. Res. 92, 62–71.
Khansari, M.M., Wanek, J., Felder, A.E., Camardo, N., Shahidi, M., 2015. Automated
assessment of hemodynamics in the conjunctival microvasculature network. IEEE
Trans. Med. Imaging http://dx.doi.org/10.1109/TMI.2015.2486619 (Preprint).
Kord Valeshabad, A., Wanek, J., Saraf, S.L., Gaynes, B.I., Gordeuk, V.R., Molokie, R.E.,
Shahidi, M., 2015a. Changes in conjunctival hemodynamics predict albuminuria in
sickle cell nephropathy. Am. J. Nephrol. 41 (6), 487–493.
Kord Valeshabad, A., Wanek, J., Mukarram, F., Zelkha, R., Testai, F.D., Shahidi, M., 2015b.
Feasibility of assessment of conjunctival microvascular hemodynamics in unilateral
ischemic stroke. Microvasc. Res. 100, 4–8.
Kord Valeshabad, A., Wanek, J., Zelkha, R., Lim, J.I., Camardo, N., Gaynes, B.I., Shahidi, M.,
2015c. Conjunctival microvascular hemodynamics in sickle cell retinopathy. Acta
Ophthalmol. 93, e275–e280.
Koutsiaris, A.G., 2013. The resistive index as a function of vessel diameter in the human
carotid arterial tree. Microvasc. Res. 89, 169–171.
Koutsiaris, A.G., 2015. Wall shear stress in the human eye microcirculation in vivo, segmental
heterogeneity and performance of in vitro cerebrovascular models. Clin. Hemorheol.
Microcirc. 1–20 (DOI: 103233/CH-151976, Preprint).
Koutsiaris, A.G., Pogiatzi, A., 2004. Velocity pulse measurements in the mesenteric arterioles
of rabbits. Physiol. Meas. 25, 15–25.
Koutsiaris, A.G., Tachmitzi, S.V., Papavasileiou, P., Batis, N., Kotoula, M., Giannoukas, A.D.,
Tsironi, E., 2010. Blood velocity pulse quantification in the human conjunctival
pre-capillary arterioles. Microvasc. Res. 80, 202–208.
Landa, G., Jangi, A.A., Garcia, P.M.T., Rosen, R.B., 2012. Initial report of quantification of
retinal blood flow velocity in normal human subjects using the Retinal Functional
Imager (RFI). Int. Ophthalmol. 32, 211–215.
Lee, J.J., Tyml, K., Menkis, A.H., Novick, R.J., Mckenzie, F.N., 1994. Evaluation of pulsatile and
nonpulsatile flow in capillaries of goat skeletal muscle using intravital microscopy.
Microvasc. Res. 48, 316–327.
Milnor, W., 1990. Cardiovascular Physiology. Oxford University Press, New York.
Nakano, A., Sugii, Y., Minamiyama, M., Niimi, H., 2003. Measurement of red cell velocity in
microvessels using particle image velocimetry (PIV). Clin. Hemorheol. Microcirc. 29,
445–455.
Palmioti, C.A., Prasad, S., Naik, P., Abul, K.M.D., Sajja, R.K., Achyuta, A.H., Cucullo, L., 2014. Ιn
vitro cerebrovascular modeling in the 21st century: current and prospective technolo-
gies. Pharm. Res. 31, 3229–3250.
Pourcelot, L., 1975. Indications de l’ ultrasonographie Doppler dans l’ etude des vaisseaux
peripheriques. Rev. Prat. 25, 4671–4680.
Sugii, Y., Nishio, S., Okamoto, K., 2002. In vivo PIV measurement of red blood cell velocity
field in microvessels considering mesentery motion. Physiol. Meas. 23, 403–416.
Tyml, K., Groom, A.C., 1980. Fourier transform analysis of periodic variations of red cell
velocity in capillaries of resting skeletal muscle in frogs. Microvasc. Res. 20, 9–18.
38 A.G. Koutsiaris / Microvascular Research 106 (2016) 36–38