IJERD(www.ijerd.com)International Journal of Engineering Research and Develop...
REVIEW VProfiles Koutsiaris 2010b BULLETIN of PSHM
1. Boletim da SPHM Vol. 25 (1) Janeiro, Fevereiro, Março 2010 5
ARTIGO DE REVISÃO / REVIEW ARTICLE Equações do perfil de velocidade
VELOCITY PROFILE EQUATIONS FOR MICROVESSEL BLOOD FLOW
IN MAMMALS / EQUAÇÕES DO PERFIL DE VELOCIDADE APLICADAS
AO FLUXO MICROVASCULAR EM MAMÍFEROS
Aristotle Koutsiaris1
1
Bioinformatics Laboratory, Dept of Medical Laboratories, TEI of Larissa
41110 Larissa, Greece
Fax: +30 2410 555378
E-mail: ariskout@teilar.gr
ABSTRACT
Amini review of the available ve-
locity profile equations for microves-
sel blood flow is presented. These
equations are divided into two groups
and then a preliminary assessment of
the first group is demonstrated. Fi-
nally, there is a discussion on how
these equations could be applied to
human microcirculation in vivo.
INTRODUCTION
Before the last third of the 20th
century, the only equation available
to the researchers studying laminar
flows inside cylindrical tubes was the
parabolic one. In the seventies it be-
came evident that the flow of blood
is quite different from simple New-
tonian flows like that of water.
Blood exhibits special shear thin-
ning properties due to reasons which
are still partly unexplained. For ex-
ample the molecular and biochemical
basis of the rouleaux (structures re-
sembling coin piles) formation is still
unknown. The shear thinning pro-
perty means that blood viscosity di-
minishes (blood becomes thinner) as
shear rate increases. For the case of
blood, this property is quite evident
taking into account that at high shear
rates (> 100 s-1
) its viscosity is many
times lower than that at shear rates
below 10 s-1
. This means that near the
vessel axis where there are such low
shear rates, blood is much more vis-
cous, causing a characteristic “blunt-
ing” of the velocity profile2,7,8,12,13,15
.
After 1970, the researchers in the
field proposed equations trying to de-
scribe the blunting of the velocity
profile in the microvasculature with
diameters (D) higher than 20 μm. The
diametric down size limit of the 20
μm1
is imposed by the manifestation
of the biphasic nature of blood in the
smallest arterioles and venules and
the capillaries. In these microvessels
red blood cells (RBCs) flow sepa-
rately, constituting a different liquid
BSPHM 25-1_2ª PROVA.indd 5BSPHM 25-1_2ª PROVA.indd 5 01-04-2010 14:42:3501-04-2010 14:42:35
2. 6 Boletim da SPHM Vol. 25 (1) Janeiro, Fevereiro, Março 2010
ARTIGO DE REVISÃO / REVIEW ARTICLE Equações do perfil de velocidade
phase from plasma and therefore the
flow medium can not be considered
as a “continuum” and a velocity pro-
file can not be defined in the ordinary
sense.
The available velocity profile
equations today, could be divided in
many ways, but in this review the
criterion was whether they can be
easily reduced to the classic para-
bolic equation (Group A) or not
(Group B).
Available equations
Realistic assumptions of the blood
flow in straight sections of microves-
sels with D > 20μm, several diame-
ters downstream their blood flow
entrance, are: 1) incompressible flow,
2) continuous medium, 3) viscous
flow with Reynolds number less than
1, 4) non-Newtonian medium, 5) cy-
lindrical vessel geometry and 6) axi-
symmetric velocity profile with max-
imum velocity Vm
on the vessel
axis.
All the above conditions are satis-
fied by the equations presented below
except for the parabolic equation
which can not satisfy the non-New-
tonian condition.
Group A
This group comprises 3 velocity
profile equations:
(1)
(2)
(3)
Where V(r) is the velocity at ra-
dial position r, for the parabolic
(equation 1), the Roevros10
(equation
2) and the Koutsiaris4
(equation 3)
cases. R is the radius of the cylindri-
cal vessel and Vm
is the maximum
velocity of the symmetrical profile on
the vessel axis.
The parameters κ and κ1
, κ2
affect
the velocity profile shape of equation
2 and 3 respectively. For a velocity
profile blunter than the parabolic one
and with the same Vm
, the following
conditions must be satisfied: κ > 2
(equation 2), 0 < κ1
< 1, κ2
> 2 and
(1-κ1
) κ2
> 2 (equation 3).
In equation 2, the higher the κ, the
flatter the profile near the vessel axis
and the higher the wall shear rate10
.
In equation 3, the advantage is that
the bluntness of the profile can be
controlled independently near the
axis and the wall respectively: as κ1
approaches zero the profile becomes
flatter near the axis and as κ2
takes
values higher than 2 the profile be-
comes flatter near the wall4
.
As it was mentioned in the intro-
duction, equations 2 and 3 can be
reduced to the parabolic equation
when: κ = 2 (equation 2) and κ1
= 0,
κ2
=2 (equation 3).
It should also be noted that equa-
tion 1 can be derived from basic phy-
sical principles whereas equations 2
and 3 are empirical.
Group B
Damiano et al 2
made significant
contributions in theory and experi-
BSPHM 25-1_2ª PROVA.indd 6BSPHM 25-1_2ª PROVA.indd 6 01-04-2010 14:42:3501-04-2010 14:42:35
3. Boletim da SPHM Vol. 25 (1) Janeiro, Fevereiro, Março 2010 7
ARTIGO DE REVISÃO / REVIEW ARTICLE Equações do perfil de velocidade
mental measurements and provided
a way to estimate the viscosity profi-
le as well as the effective viscosity in
vivo. They proposed the following
velocity profile equation which iden-
tically satisfies the momentum equa-
tion and boundary coonditions7
:
(4)
Where f (σ) is a function of R and
of two independent parameters c1
and
c2
which can be found through non
linear regression analysis that uses
equation 4 to minimize the least-squa-
res error (SSE) of the fit to the expe-
rimental velocity profile data sets7
.
With a suitable modification the equa-
tion can take into account the infini-
tesimal flow inside the microvascular
glycocalyx layer. This is important for
the transcapillary exchange and endo-
thelium studies but from the volume
flow estimation point of view it con-
tributes little due to the very low ve-
locities near the vessel walls.
The profile of this equation will
not be shown here because the para-
meters c1
and c2
, were not given. Ho-
wever, the fine fitting of equation 4
to experimental data from mouse ve-
nules can be seen in the papers of
Damiano et al 2
and Long et al 7
.
Available data in the literature
The actual measurement of the
blood velocity profile in microves-
sels is a known difficult task to ac-
complish. This is in part due to the
many different scientific fields that
need to cooperate and in part due to
the expensive experimental set up
needed.
Therefore it is not surprising that
apart from some preliminary efforts
in the 70’s12
, the first in vivo quality
velocity profile measurements were
presented in 1986 by the group of
professor Reneman15
. They measured
velocity profiles in the arterioles of
the rabbit mesentery using as flow
tracers platelets labeled with a special
fluorescence technique.
More than 15 years later, Nakano
et al 8
and Sugii et al 13
measured the
velocity profile in arterioles of the rat
mesentery using a technique intro-
duced 2 years earlier by Sugii et al 14
under the name “high resolution par-
ticle image velocimetry” (HR-PIV).
This technique was an improved
combination of previous micro PIV
volume illumination techniques3,11
and provided an excellent spatial
resolution of 0.8 μm.
In 2004, Long et al 7
(12 venules
frommale mice,24μm≤ D≤42.9μm)
and Damianoet al 2
(9 light-dye treated
venules from 3 mice, 24 μm ≤ D ≤ 42.9
μm) provided the most complete velo-
city profile measurements until now,
with the best spatial resolution. They
measured in the cremaster muscle of
mice using fluorescent microspheres
(0.47 ± 0.01 μm) as blood flow tracers.
More recently, Potter and Damiano9
performed measurements in mice
venules up to diameters of 101 μm but
they mainly concentrated on the pro-
perties of the endothelium glycocalyx
layer both in vivo and in vitro.
Efficiency
A recent preliminary evaluation5
of the group A equations, assuming
BSPHM 25-1_2ª PROVA.indd 7BSPHM 25-1_2ª PROVA.indd 7 01-04-2010 14:42:3501-04-2010 14:42:35
4. 8 Boletim da SPHM Vol. 25 (1) Janeiro, Fevereiro, Março 2010
ARTIGO DE REVISÃO / REVIEW ARTICLE Equações do perfil de velocidade
they all have the same axial velocity
and using 8 experimental profile data
from the literature7
, showed that the
parabolic equation tends to underes-
timate blood velocity, reaching a ma-
ximum relative error of – 72% near
the vessel wall; therefore, the para-
bolic equation leads to an average
volume flow underestimation of ap-
proximately – 18%. The Roevros
equation tends to overestimate blood
velocity reaching a maximum relati-
ve error of + 48% at a radial position
between 70% and 80% of the vessel
radius R; therefore, the Roevros
equation leads to an average volume
flow overestimation of approximate-
ly + 20%. The Koutsiaris equation
tends to approximate blood velocity
with a relative error between – 8%
and + 7%, for all radial positions, lea-
ding to an average volume flow error
of less than 0.5%.
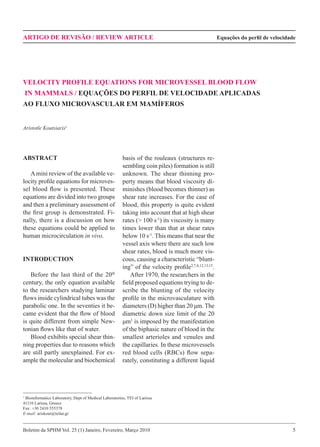
In order to compare the 3 equa-
tions, fixed values for the parameters
were selected4,5
: κ = 9 (equation 2)
and κ1
= 0.58, κ2
=22 (equation 3).An
example of the velocity distributions
given by the 3 equations is shown in
Fig. 1.
In conclusion, equations 1 and 2
lead to a severe underestimation and
overestimation of the blood velocity
respectively, but equations 3 and 4
approximate quite well the velocity
profile of mouse blood (examples of
equation 4 can be seen elsewhere2,7
).
However, equation 3 requires only
measurement of the axial velocity.
Application to humans
A fundamental remaining ques-
tion is whether equations 3 and 4,
which seem to approximate efficient-
ly the blood velocity profile in the
mouse microcirculation, can be ap-
plied in the human microcirculation
also. Taking into account the current
Fig. 1* – The velocity profile equations 1, 2 and 3 (with the same axial velocity Vm) are shown in squares, trian-
gles and solid black line, respectively. The experimental velocity profile data from a 38.6 μm mouse venule (Long
et al7
), with their radial position normalized, are shown in black dots. Graph was taken from Koutsiaris et al5
.
* For experimental details of Fig. 1, the reader should get access to reference 7 and for equation parameters to
references 4 and 5
BSPHM 25-1_2ª PROVA.indd 8BSPHM 25-1_2ª PROVA.indd 8 01-04-2010 14:42:3501-04-2010 14:42:35
5. Boletim da SPHM Vol. 25 (1) Janeiro, Fevereiro, Março 2010 9
ARTIGO DE REVISÃO / REVIEW ARTICLE Equações do perfil de velocidade
state of technology, it would be rath-
er difficult now, or in the near future,
to measure the velocity profile of
blood in human microvessels. An in-
direct way of finding the answer
would be to measure the rheological
differences between mouse and hu-
man blood and more specifically the
viscosity differences at low shear
rates. In case these differences prove
to be high enough, presumably the
profiles will be different and a change
of the equation parameters will be
required.
It is already known16
that in hu-
mans and other athletic species like
horses, whole blood viscosity (WBV)
is higher than in mice. However, this
WBV difference becomes important
at very low shear rates (< 10 s-1
) oc-
curring close to the vessel axis, as
already was mentioned in the intro-
duction. Using equation 3 shown in
figure 1, the shear rate of 10 s-1
cor-
responds to a radial position r = 0.18
R, or to a surface area of only 3.3%
of the total cross sectional area of the
vessel. Therefore, given that the im-
portant WBV difference concerns
only a small portion of the vessel
cross sectional area, it is logical to
assume that equations 3 and 4 could
be applied to the human microvessels
as well.
A more detailed viscometric ex-
periment comparing mouse and hu-
man blood would involve WBV
measurements at many different shear
rates with emphasis on shear rates
below 10 s-1
at physiologic tempera-
tures (human blood at 36.6 o
C and
mouse blood at 38 o
C).
One probable complication would
be the selection of the appropriate he-
matocrit level since according to the
Fahraeus effect, the average microcir-
culatory hematocrit is lower than the
systemic hematocrit (Hs). So, for di-
ameters of approximately 20 μm, the
average hematocrit would be 0.28Hs
in the venous side and higher in the
arteriolar side6
.Asuggested set of ex-
periments would comprise WBV
measurements at hematocrits of
.28Hs, .38Hs and .50Hs.
CONCLUSION
Amini review of the current velo-
city profile equations for the descrip-
tion of blood flow in microvessels
was presented. There are now 2 ve-
locity profile equations which appro-
ximate quite well the actual micro-
vessel velocity profile of mice and
logically they could also be used in
humans. What seems to be more than
certain now is that the classic para-
bolic velocity profile is inappropriate
for use in mammals.
BIBLIOGRAPHY
1. Cokelet GR. Viscometric in vitro and in vivo
blood viscosity relationships: how are they rela-
ted? Biorheology 1999; 36:343.
2. Damiano ER, Long DS, Smith ML. Estimation of
viscosity profiles using velocimetry data from
parallel flows of linearly viscous fluids: applica-
tion to microvessel haemodynamics. J Fluid Mech
2004; 512:1.
3. Koutsiaris AG, Mathioulakis DS, Tsangaris S.
Microscope PIV for velocity field measurement
of particle suspensions flowing inside glass ca-
pillaries. Meas Sci Technol 1999; 10:1037.
4. Koutsiaris AG. A velocity profile equation for
blood flow in small arterioles and venules of small
mammals in vivo and an evaluation based on li-
terature data. Clinical Hemorheology and Micro-
circulation 2009; 43(4):321.
5. Koutsiaris AG, Tachmitzi SV, Kotoula MG, Tsi-
roni E. Old and new velocity profile equations of
the blood flow in vivo: a preliminary evaluation.
Series on Biomechanics, In Print.
6. Lipowsky HH, Usami S, Chien S. In vivo measu-
rements of hematocrit and apparent viscosity in
the microvasculature of cat mesentery. Microvasc
Res 1980; 19:297.
BSPHM 25-1_2ª PROVA.indd 9BSPHM 25-1_2ª PROVA.indd 9 01-04-2010 14:42:3501-04-2010 14:42:35
6. 10 Boletim da SPHM Vol. 25 (1) Janeiro, Fevereiro, Março 2010
ARTIGO DE REVISÃO / REVIEW ARTICLE Equações do perfil de velocidade
7. Long DS, Smith ML, Pries AR, Ley K, Damiano
ER. Microviscometry reveals reduced blood vis-
cosity and altered shear rate and shear stress pro-
files in microvessels after hemodilution. PNAS
2004; 101:10060.
8. Nakano A, Sugii Y, Minamiyama M, Niimi H.
Measurement of red cell velocity in microvessels
using particle image velocimetry (PIV). Clin He-
morheol Microcirc 2003; 29:445.
9. Potter DR, Damiano ER. The hydrodynamically
relevant endothelial cell glycocalyx observed in
vivo is absent in vitro. Circ Res 2008; 102:770.
10. Roevros, JMJG. Analogue processing of C.W.-
Doppler flowmeter signals to determine average
frequency shift momentaneously without the use
of a wave analyser. In: Reneman, R.S. (Ed.), Car-
diovascular Applications of Ultrasound. North-
Holland Publ., Amsterdam-London, 1974;43.
11. Santiago JG, Werely ST, Meinhart CD, Beebe DJ,
Adrian RJ. A particle image velocimetry system
for micro fluidics. Exp Fluids 1998; 25:316.
12. Schmid-Schoenbein GW, Zweifach BW. RBC
velocity profiles in arterioles and venules of the
rabbit omentum. Microvasc Res 1975; 10:153.
13. Sugii Y, Shigeru N, Okamoto K. In vivo PIV me-
asurement of red blood cell velocity field in mi-
crovessels considering mesentery motion. Physiol
Meas 2002; 23:403.
14. Sugii Y, Shigeru N, Okuno T, Okamoto K. A hi-
ghly accurate iterative PIV technique using a gra-
dient method. Meas Sci Technol 2000; 11: 1666.
15. Tangelder GJ, Slaaf DW, MuijtjensAMM,Arts T,
Egbrink MGA, Reneman RS. Velocity profiles of
blood platelets and red blood cells flowing in ar-
terioles of the rabbit mesentery. Circ Res 1986;
59:505.
16. Windberger U, Bartholovitsch A, Plasenzotti R,
Korak KJ, Heinze G. Whole blood viscosity, plas-
ma viscosity and erythrocyte aggregation in nine
mammalian species: reference values and compa-
rison of data. Experimental Physiology 2003; 88:
431.
BSPHM 25-1_2ª PROVA.indd 10BSPHM 25-1_2ª PROVA.indd 10 01-04-2010 14:42:3501-04-2010 14:42:35