EVALUATION OF PULMONARY HEMODYNAMICS AND ALTERATION IN DISEASE STATES
Research Poster
1. Continuous, Non-Invasive Blood Pressure Measurement
Abstract Materials and Methods (cont’)
Materials and Methods
Results
Results (cont’)
Conclusions/Future work
Department of Bioengineering, University of California, Los Angeles, CA 90025 USA
Bioengineering Capstone Design Course
Imara Kassam, Anisha Banda, Joanna Hrabia, Alborz Feizi, Michael Teng, Amir Kaboodrangidaem
Introduction
Blood pressure is an essential biometric in assessing both short-term and long-term patient health.
While traditional methods such as sphygmomanometry and arterial catheterization are able to obtain
blood pressure readings, they have shortcomings in areas including accuracy of measurement and
real-time monitoring, while at the same time ensuring adequate safety of patient. Thus, our goal was
to develop an alternate method of blood pressure measurement, one that is both continuous and non
invasive. We designed a method that utilizes B-mode and doppler ultrasound to get blood velocity and
arterial diameter in order to ultimately calculate blood pressure. First, differential pressure
measurements taken on a phantom brachial artery were used to prove a correlation between
differential pressure (dP) and base-line pressure (P1) (R2
=0.9058). Once this correlation was proven,
we then moved on to establish an in-vivo standard blood pressure correlation between a differential
pressure gradient, which was calculated using the obtained blood velocity and arterial diameter from
B-mode and doppler ultrasound, and actual blood pressure, which was measured using the gold
standard of sphygmomanometry (R2
=0.6759). Our method was tested on patients with healthy
vascular systems (n=26).
UCLA Bioengineering Department
Dr. Dino Di Carlo
Dr. George Saddik
Dr. Otto Yang
Acknowledgements
1. Prove enabling hypothesis that a differential pressure gradient corresponds to a corresponding baseline
pressure utilizing a phantom model
2. Perform B-mode and doppler ultrasound measurements on the brachial artery in the upper arm
3. From these images, obtain: a) radius of brachial artery and b) velocity profile of arterial blood flow
4. Convert the above parameters into a differential pressure gradient using the relationship given in
Equation 1
5. Correlate differential pressure gradient to systolic and diastolic blood pressure
Continuous blood pressure monitoring is crucial, especially for hospitalized patients in perioperative
care, or care that occurs before, during, and after surgery, as inadequate blood pressure can cause
brain and organ damage within minutes. Currently, there is no method that measures blood pressure
both continuously and non-invasively. There is a significant need for non-invasive continuous blood
pressure measurement, as it results in a safer and easier patient monitoring method in hospital settings,
diagnosis of otherwise overlooked conditions, and continuous measurement in the privacy of one’s own
home. Ultrasound is a viable technology that can be used to measure blood pressure both continuously
and noninvasively. The arterial diameter and flow velocity can be used to find the differential pressure
gradient along a specific length in an artery. Differential pressure is then correlated to a blood pressure
measurement using an experimentally determined correlation. Through the innovative ultrasound
method, blood pressure can be measured continuously and non-invasively.
Figure 3. Design of Phantom Model: a) Air piston to generate pulsatile fluid flow. b) Air inlet valve allows pressure release
for air piston to operate. c) Flowmeter provides standard flow velocity values. d) Pressure gauges provide readings of
base-line pressure and differential pressure across the measured section. e) Coupling tank holding ballistics gel allows for
clean ultrasound readings. f) Steady state fluid return pump returns fluid to water column, allowing for continuous flow in
the model.
Base-line Pressure (P) is plotted
versus Differential Pressure Gradient
(dP). P and dP were measured at
various flow velocities. P was
measured as the pressure read on the
first gauge in the phantom model. The
difference between the two gauges
was used in order to obtain a dP value
over the length of the ultrasound
coupling tank. The corresponding
linear regression between the data
points was plotted in Figure 6.
Proving the Enabling Hypothesis
Figure 6. Correlating differential pressure gradient to baseline pressure.
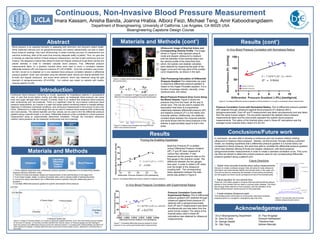
In-Vivo Blood Pressure Correlation with Experimental Radius
Pressure Correlation Curve with
Experimental Radius: Plot of differential
pressure gradient (dP) obtained through
ultrasound against blood pressure (P)
obtained with a sphygmomanometer.
Each dP and P measurement was taken
simultaneously and was taken from the
same human subject. The radius of the
brachial artery used in these dP
calculations was obtained by ultrasound
measurements.
Figure 7. Correlating differential pressure gradient to blood
pressure in-vivo using experimental radius measurements.
In-Vivo Blood Pressure Correlation with Normalized Radius
Pressure Correlation Curve with Normalized Radius: Plot of differential pressure gradient
(dP) obtained through ultrasound against blood pressure (P) obtained with a
sphygmomanometer. Each dP and P measurement was taken simultaneously and was taken
from the same human subject. The red points represent the diastolic blood pressure
measurements taken and the blue points represent the systolic blood pressure
measurements. The radius of the brachial artery used in these dP calculations was the
average human brachial artery radius of 2.25 mm.
Figure 8. Correlating differential pressure gradient to blood pressure in-vivo with a normalized radius measurement.
Blood Pressure-Pressure Drop Curve Along
the Blood Vessels: Figure 5 shows the
pressure drop from the heart, all the way to
venae cava. This can be used to explain the
assumption that there is a proportional
relationship between differential pressure (dP)
and baseline pressure (P1) in the elastic and
muscular arteries. Additionally, the relatively
constant slope between the muscular arteries
and aorta shows that the blood pressure in the
arteries is approximately equal to that in the
aorta.Figure 5. Pressure drop throughout the body from the
heart to the peripheral tissues.
Figure 4. Doppler and B-mode ultrasound images of
the brachial artery.
Equation 1. A derivation of Hagen-Pousielle’s equation to
determine the pressure gradient along the brachial artery.
Ultrasound- Image of Brachial Artery and
Corresponding Velocity Profile: The image
shown in Figure 4 was captured using B-
mode and doppler ultrasound to measure
both the diameter of the brachial artery and
the velocity profile of the blood flow from
which, the systolic and diastolic velocities
were obtained by measuring the peak of the
bigger curve and mid way point of the smaller
curve respectively, as shown in the right.
Data Processing-Calculation of Differential
Pressure Gradient:The relationship we used
to determine differential pressure gradient is
based on the Hagen-Pousielle equation. It is a
function of average velocity, viscosity, cross-
sectional area, and radius.
Dr. Paul Krogstad
Soroush Kahkeshani
Theodore Kee
Ashkan Maccabi
In conclusion, we were able to develop a continuous and non-invasive method utilizing
ultrasound to measure blood pressure. Namely, we first proved, through utilizing a phantom
model, our enabling hypothesis that a differential pressure gradient in a human artery can
correspond to blood pressure. We were then able to correlate the differential pressure gradient,
which was obtained utilizing B-mode and doppler ultrasound, with blood pressure
sphygmomanometer measurements in order to create a standard correlation curve. This curve
can then be utilized to determine a blood pressure value for any corresponding differential
pressure gradient along a patient’s arm.
Future Directions
• Obtain more accurate brachial artery radius measurements
We plan to create a software program that will utilize B-mode ultrasound
information and automatically identify the brachial artery in the upper arm.
This can be done by measuring the diameter of each artery and picking
out the largest one which would correspond to that of the brachial artery.
• Adjust equation for non-laminar flow
There are 15.8 million people in America that have atherosclerotic plaque
buildup in their arteries that can lead to coronary artery disease. The blood
flow through these arteries is more turbulent, and the utilization of the
Navier-Stokes theorem would account for this parameter.
• Create wireless ultrasound patch
This wireless patch will be able to continuously relay blood pressure
measurements to a companion smartphone app over time. Figure 9. Top and side view of concept
wireless ultrasound patch device