1. Abstract
Measures of electrocardiogram (EKG)-derived complexity could
be used as new vital signs. We propose a new approach for higher,
systems-level interpretation of physiologic complexity via calculation of
multidimensional entropy in vital sign data. Objective: Monitor systems-
level complexity to identify decompensation. Hypothesis: changes in ù
systems-level complexity precede loss of arterial pulsation (LOAP) in
hypoxic cardiac arrest. Methods: Eleven anesthetized, intubated,
paralyzed and mechanically ventilated swine were instrumented. heart
rate (HR), systolic blood pressure (SBP); central venous pressure (CVP);
continuous cardiac output (CCO); pulse oxymetry (SPO2), bispectral
index (BIS) were recorded at baseline, during asphyxiation (endotracheal
loss of aortic pulsation and SBP< 50 mm Hg. All available monitoring
data from any and all sensors available at the bedside was recorded into
this data was loaded into OntoSpace software for determination of
OntoSpace Complexity (OSC), a cumulative measure of system structure
(interconnectedness between devices) and randomness (entropy). OSC
was calculated and timing of the changes in it was compared to the
experimental timeline. Results: see table. At baseline, OSC was low
remained non-indicative of demise until abrupt occurrence of LOAP. At a
mean time of 5 min. 24 sec before LOAP a critical change (rise) in OSC
adjustment for multiple comparisons. Conclusions: Changes in
systems-level complexity precede deterioration in traditional vital signs
during hypoxic cardiac arrest. Prospective studies will be conducted to
evaluate the utility of this approach as a real-time decision-support tool.
Batchinsky AI, MD1, Deshpande BR2, Williams JB3, MD, Baker W, MS1, Walker K III1, Marczyk J, PhD2, White CE1, MD, Salinas J1, PhD, Cancio LC, MD1
1 U.S. Army Institute of Surgical Research, Fort Sam Houston, Texas, 78234,2 Ontonix S.r.l., Como, Italy,
3 Department of General Surgery, University of Texas Health Science Center at San Antonio, TX.,
Changes in Systems-level Complexity Precede Deterioration in Traditional Vital Signs in Hypoxic Cardiac Arrest
Introduction
Current bedside monitoring technology is based on the single-
sensor, single-indicator concept. Each sensor represents a measurable
organs.
We previously showed that assessment of structural complexity (or
randomness) of the R-to-R interval time series of the EKG is useful in
evaluating the amount of regulatory complexity (amount of
hormonal feedback) during hemorrhagic shock and trauma in animal
models and critically ill humans receiving life-saving interventions
(Batchinsky et al. CCM, 2007; J Trauma 2007; Shock, 2009 and Cancio et
al. J Trauma 2008).
In this presentation we explore a new way of interpreting multiple-
sensor data, using a complexity management software system
(OntoSpace by Ontonix S.r.l. Italy). The software computes the structural
complexity of the entire bedside monitoring system. It constructs
cognitive maps of any number of variables by establishing the
interconnectedness among them. The rate of change of complexity is
used as a measure of the instantaneous stability and robustness of the
entire system.
This way of monitoring may provide earlier information about a
patient’s condition because it picks up small but collective changes in
variability of the various signals. Such changes may go unnoticed by
providers until the patient‘crashes’.
The software generates recommendations about system stability
and likelihood of approaching critical states, which may be useful in ICU
decision support.
Results
• It took an average of 30 sec to calculate OSC at each time point using 59 channels of
data.
within normal range.
• After tube clamping, vital signs (except SpO2) did not change for 3-8 min, after which the
shown).
• During LOAP only SBP and SpO2 were indicative of a critical event.
• At an average time of 5 min 40 sec before LOAP (see table ) a critical rise in OSC was
• OSC remained high at LOAP.
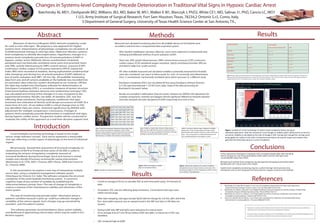
Results
Variable/ mepoint
Baseline
Tube clamped,
Data at 5min 40 sec before LOAP LOAP
HR, bpm
119 ± 10 103 ± 13 101 ± 17
SBP, mmHg 88 ± 3 100 ± 10 31 ± 8*†
CVP, mmH2O 5 ± 1 7 ± 1 15 ± 1*†
CCO, l/min 5 4 ± 1 3 ± 1*†
SpO2, % 99 ± 0.5 71 ± 12 19 ± 8*†
BIS, unitless 49 ± 10 59 ± 3 24 ± 7*†
OSC, unitless 10 31 * 27.6 *
Table. Baseline, before start of the experiment animal anesthe zed. Tube clamped, endotracheal tube clamped. LOAP, loss of aor c pulsa on. HR, heart rate in
beats per minute. SBP, arterial blood pressure in mm Hg. CVP, central venous pressure. CCO, con nuous cardiac output in l/minute, SPO2 oxygen satura on in
capillary blood at the tail, %. BIS, bispectral index, unitless. OSC, ontospace complexity, unitless.
Conclusions
References
1. Batchinsky AI, Cooke WH, Kuusela T, et al. Loss of complexity characterizes the heart-rate response to
experimental hemorrhagic shock in swine. Crit Care Med 2007;35:519-525.
2. Batchinsky AI, Salinas J, Kuusela T, et al. Rapid Prediction of Trauma-Patient Survival by Analysis of Heart-Rate
Complexity: Impact of Reducing Dataset Size. Shock 2009;32 565-571.
3. Batchinsky AI, Cancio LC, Salinas J, et al. Prehospital loss of R-to-R interval complexity is associated with
mortality in trauma patients J Trauma 2007;63:512-518.
4. Cancio LC, Batchinsky AI, Salinas J, et al. Heart-rate complexity for prediction of prehospital lifesaving
interventions in trauma patients. J Trauma 2008;65:813-819.
In this experiment OntoSpace Complexity (OSC) increased sharply after tube clamping
and on average at 5 min 40 seconds before LOAP, while common vital signs were
unremarkable (other than SPO2).
Monitoring of systems-level complexity during experimental asphyxia permitted earlier
identification of a critical state in this model.
System-level complexity monitoring may be a useful‘vital sign’which permits crisis
anticipation and can be integrated into future decision support systems at the bedside.
al
“The opinions or assertions contained herein are the private views of the author and are not to be construed as official or as
reflecting the views of the Department of the Army or the Department of Defense.”
“This study has been conducted in compliance with the Animal Welfare Act, the implementing Animal Welfare Regulations and in
accordance with the principles of the Guide for the Care and Use of Laboratory Animals.”
Step 3: Construct systems maps. Analyze all variable
interactions. If the corresponding 2D image of each
paired scatter plot contains structure, create a link in the
map – this corresponds to a relationship between the
two variables plotted on the original x, y plot.
Step 2: Build x,y scatter plots of pairs of data streams
data e.g. HR vs ABP. Next the plot is transformed into a
2D image. The image is analyzed by calculation of image
entropy, a measure of information content.
Step 1: Real-time automatic retrieval of sensor data. Data
from monitors were fed into databases. (Step 1) Data
streams were sampled at 5 second intervals and a moving
window of 500 samples (2500 seconds) was used and
advanced by 10 samples (50 seconds) at each iteration.
Step 6: Understand implicaons for system instability.
Complexity measures (lower bound, current and crical
An abrupt change in current complexity by 30% or more.
Is an indicaon of destabilizaon.
Step 5: Effects of changes in system
maps on complexity history.
Step 4: Visualize running complexity history.
Figure. Example of current prototype of systems level complexity history during an
individual experiment. Note the multude of crical changes in stability which idenfy events in the clini-
cal course. Stability is calculated as the rate of change in OSC. During each change the running contri-
bung signals are ranked in the order of importance poinng to the specific organs and systems that
generate the dominang inputs to current complexity.