ICAB advance level strategic business management study manual case & wor...
FINOLEX CABLES Ltd
1. FINOLEX CABLES Ltd
- By V. Karthik Varma.
Industry: Cables
Market Cap: Rs 3995.05Cr
P/E: 22.68
CMP: Rs 261.20
Industry P/E: 31.78
EPS: 13.58
Introduction: Finolex Cables India Ltd is the largest and leading manufacturer of
Electrical and Telecommunication cables. The company offers a wide variety of Electrical
and Communication Cables. They have also added Electrical Switches and Compact
Fluorescent Lamps to their range of products. Their manufacturing facilities are located at
Verna in Goa, Pune in Maharashtra and Roorkee in Uttarakhand. Finolex Cables Ltd, the
flagship company of the Finolex Group was incorporated in the year 1967. The company
started their operation with the manufacture of PVC insulated electrical cables for the
automobile industry. Over the years, the company has become the country's largest electrical
and telecommunication cables manufacturer.
Products: 1) Electrical cables.
2) Communication Cables.
3) Copper Rods.
4) Electrical Switches.
5) Lamps.
This year (2013-2014) company has expanded its business towards Electrical
Cables of elevator Industry, Special purpose cables for CCTV applications, cables for
defence R&D and innovations within the optical fibre cable business.
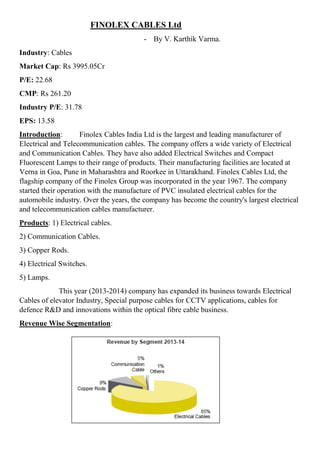
Revenue Wise Segmentation:
2. Shareholding Pattern:
Financials:
Particulars FY 12 FY 13 FY14
Sales (Cr) 2061.38 2270.68 2359.04
Operating Profit (cr) 179.44 229.66 248.19
EBIDT (Cr) 208.10 253.83 296.54
PBT (Cr) 150.80 193.82 233.63
PAT (Cr) 98.19 145.27 207.68
Dividend Payout 10.45% 10.55% 9.78%
Ratios:
Ratio FY14 Fy13 Fy12
Current Ratio 1.96 1.89 1.67
Quick Ratio 0.90 0.95 0.97
Debt to Equity Ratio 0.11 0.18 0.19
Interest Coverage
Ratio
17.13 15.49 10.00
Inventory Turnover
Ratio
6.69 6.89 8.26
Total Assets
turnover Ratios
1.92 2.09 2.19
Operating Profit
Margin (%)
10.52 10.11 8.70
Gross profit Margin
(%)
8.46 8.06 6.79
Net Profit Margin
(%)
8.62 6.33 4.69
PROMOTERS
36%
NON PROMOTERS
16%
OTHERS
48%
SHAREHOLDING PATTERN
PROMOTERS NON PROMOTERS OTHERS
3. Valuation:
Relative Valuation Price: Rs 404.60
CMP: Rs 261.20
Industry P/E: 31.78
Company P/E: 22.68
The above relative valuations show that company is undervalued and is having a great
growth potential in the coming days. As the company is moving at a CAGR of 6.52% from
2009-2014.
Pros: Company is reducing its debt from the past 3 years, virtually it is a debt free company.
Cons: The industry is largely dependent upon the copper commodity , because the products
of the company are copper raw material oriented, if the copper futures are reducing this can
be advantage to the company.
Analyst Recommendations: I recommend Buy for this company because of its business
model. The company is also into optical fibres. The very famous projects of Prime Minister
Narendra Modi Make in India, Infra development , Smart Cities development, Digital India
will be a great demand driver for this company and moreover due to the strong positioning of
the company in the market will create growth opportunities in the long run….