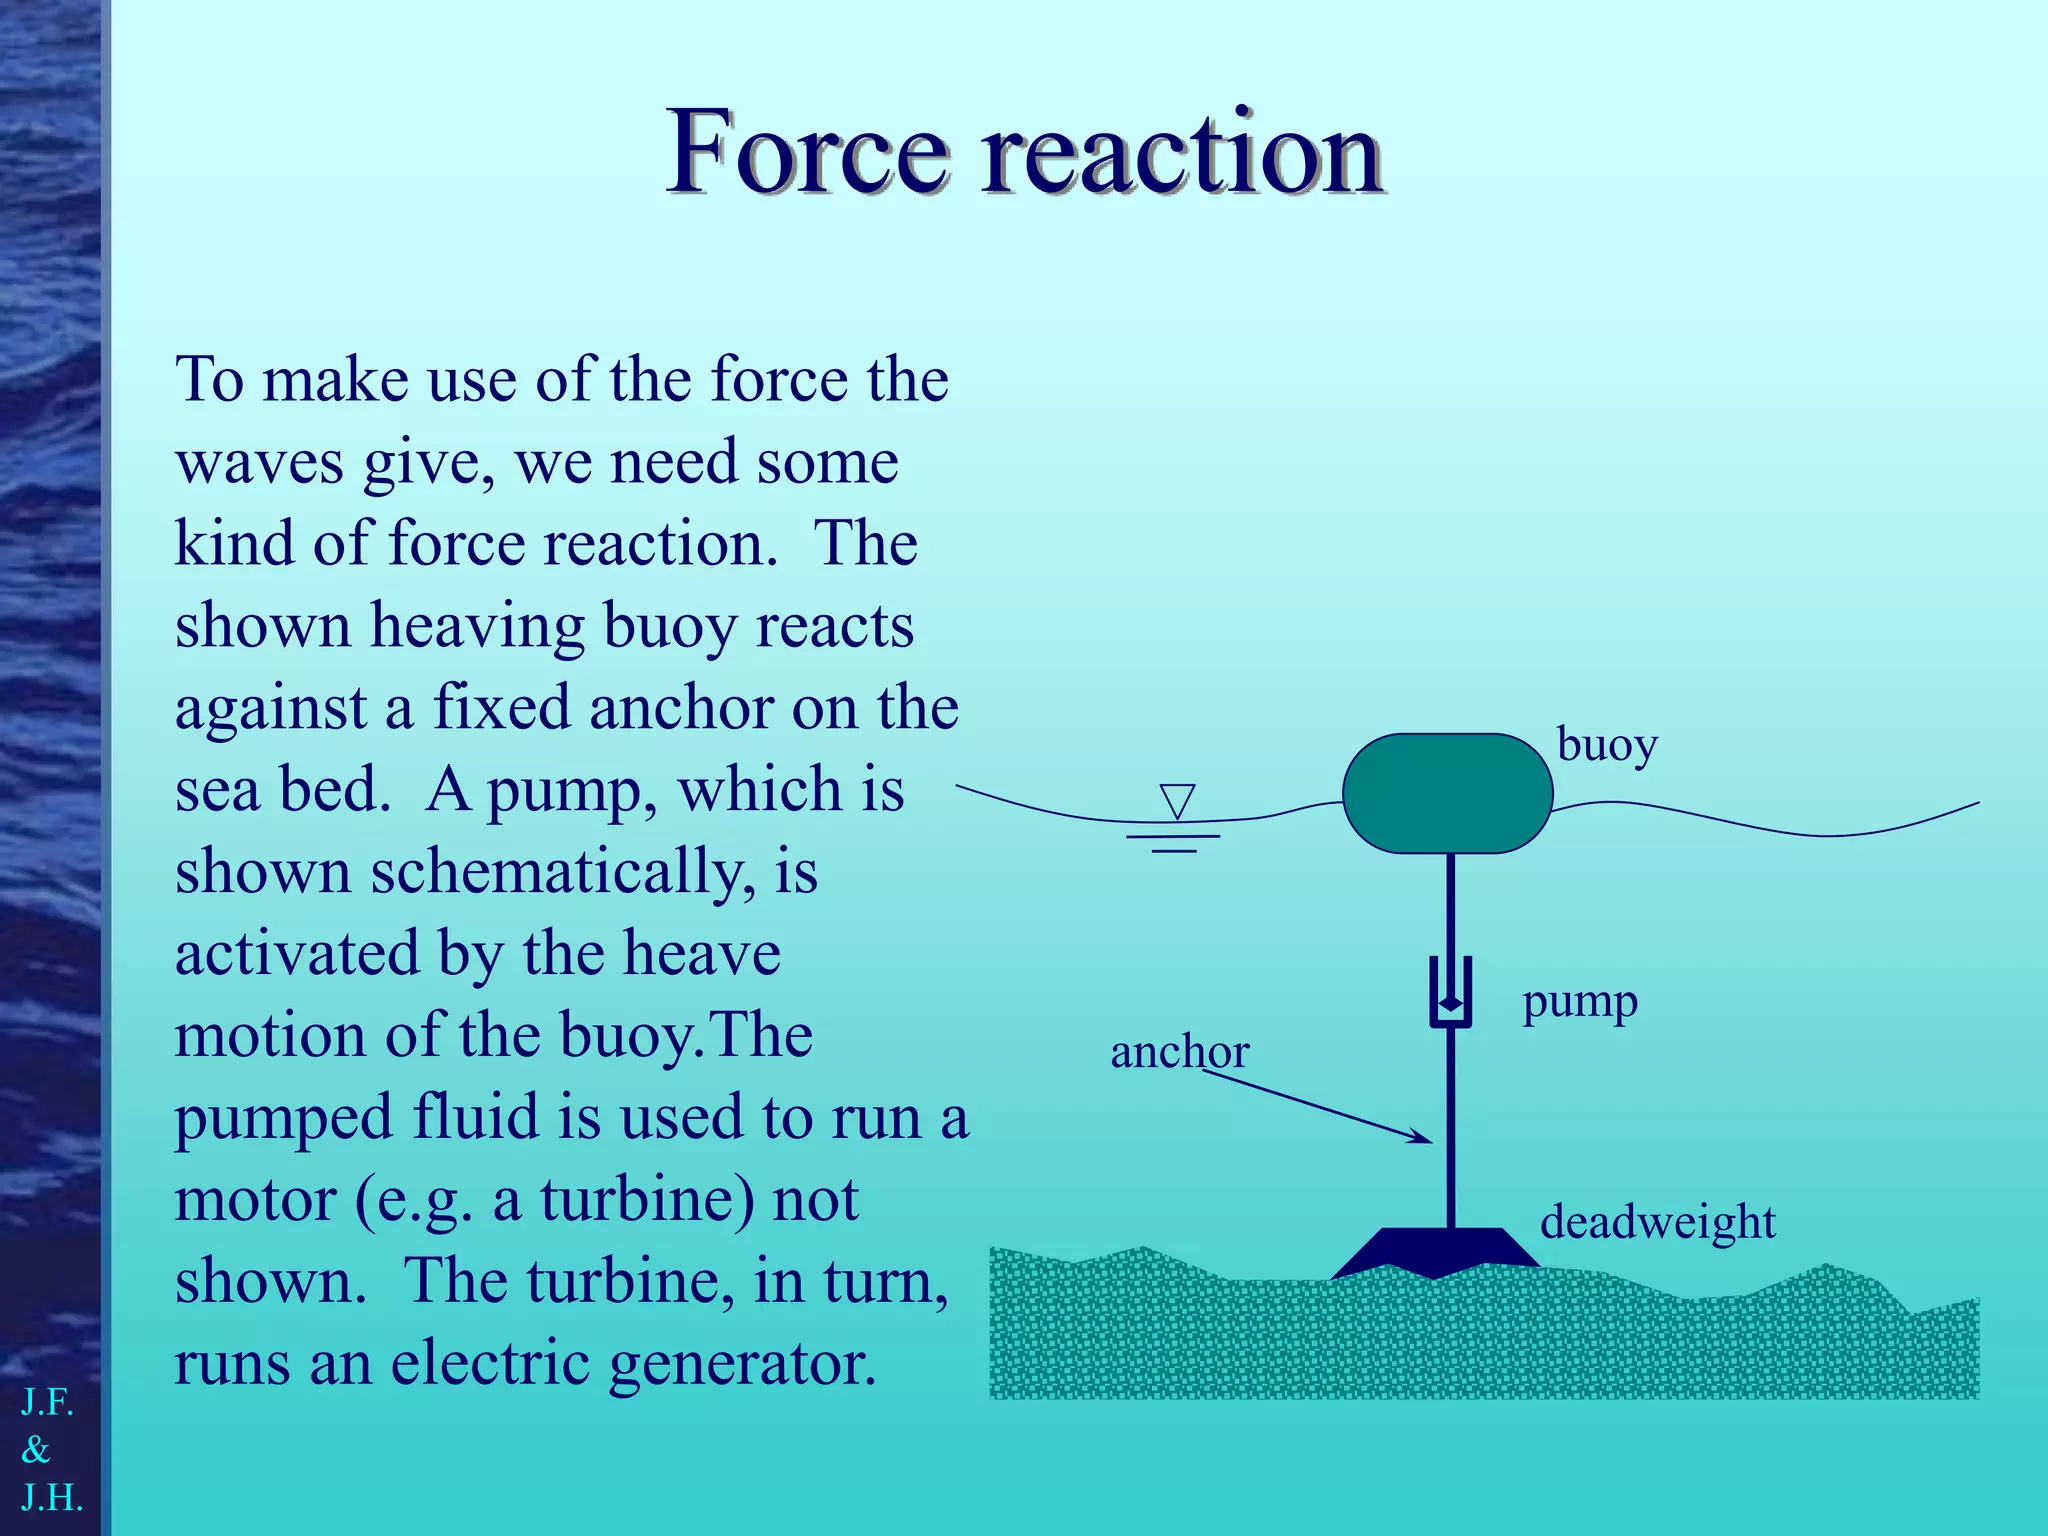
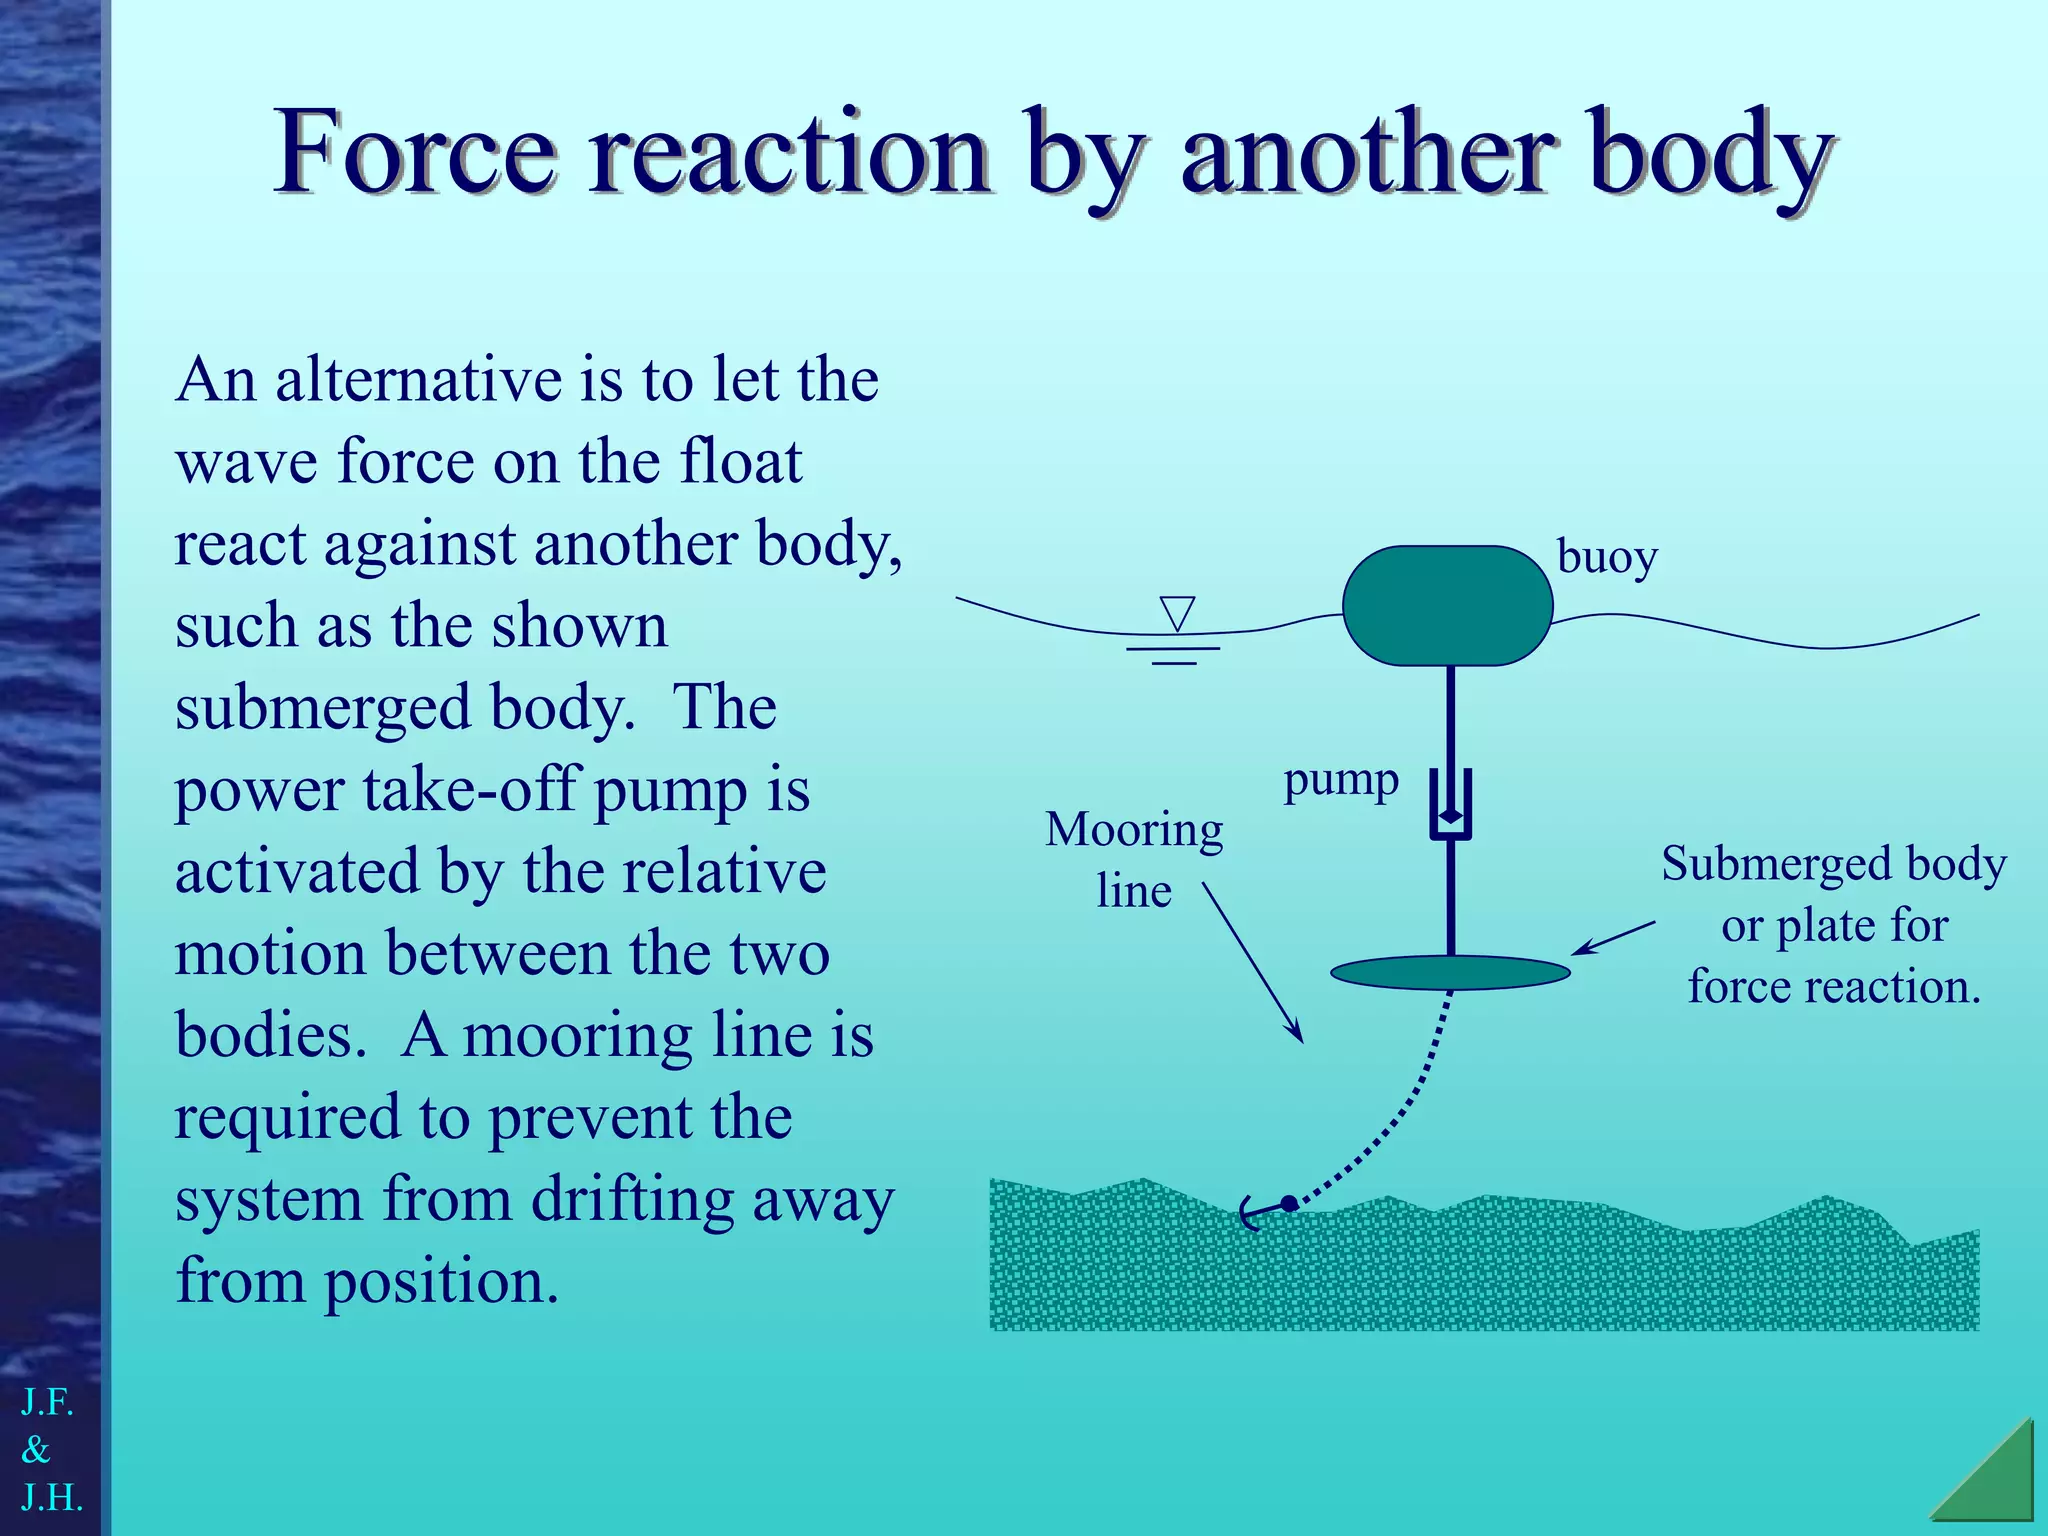
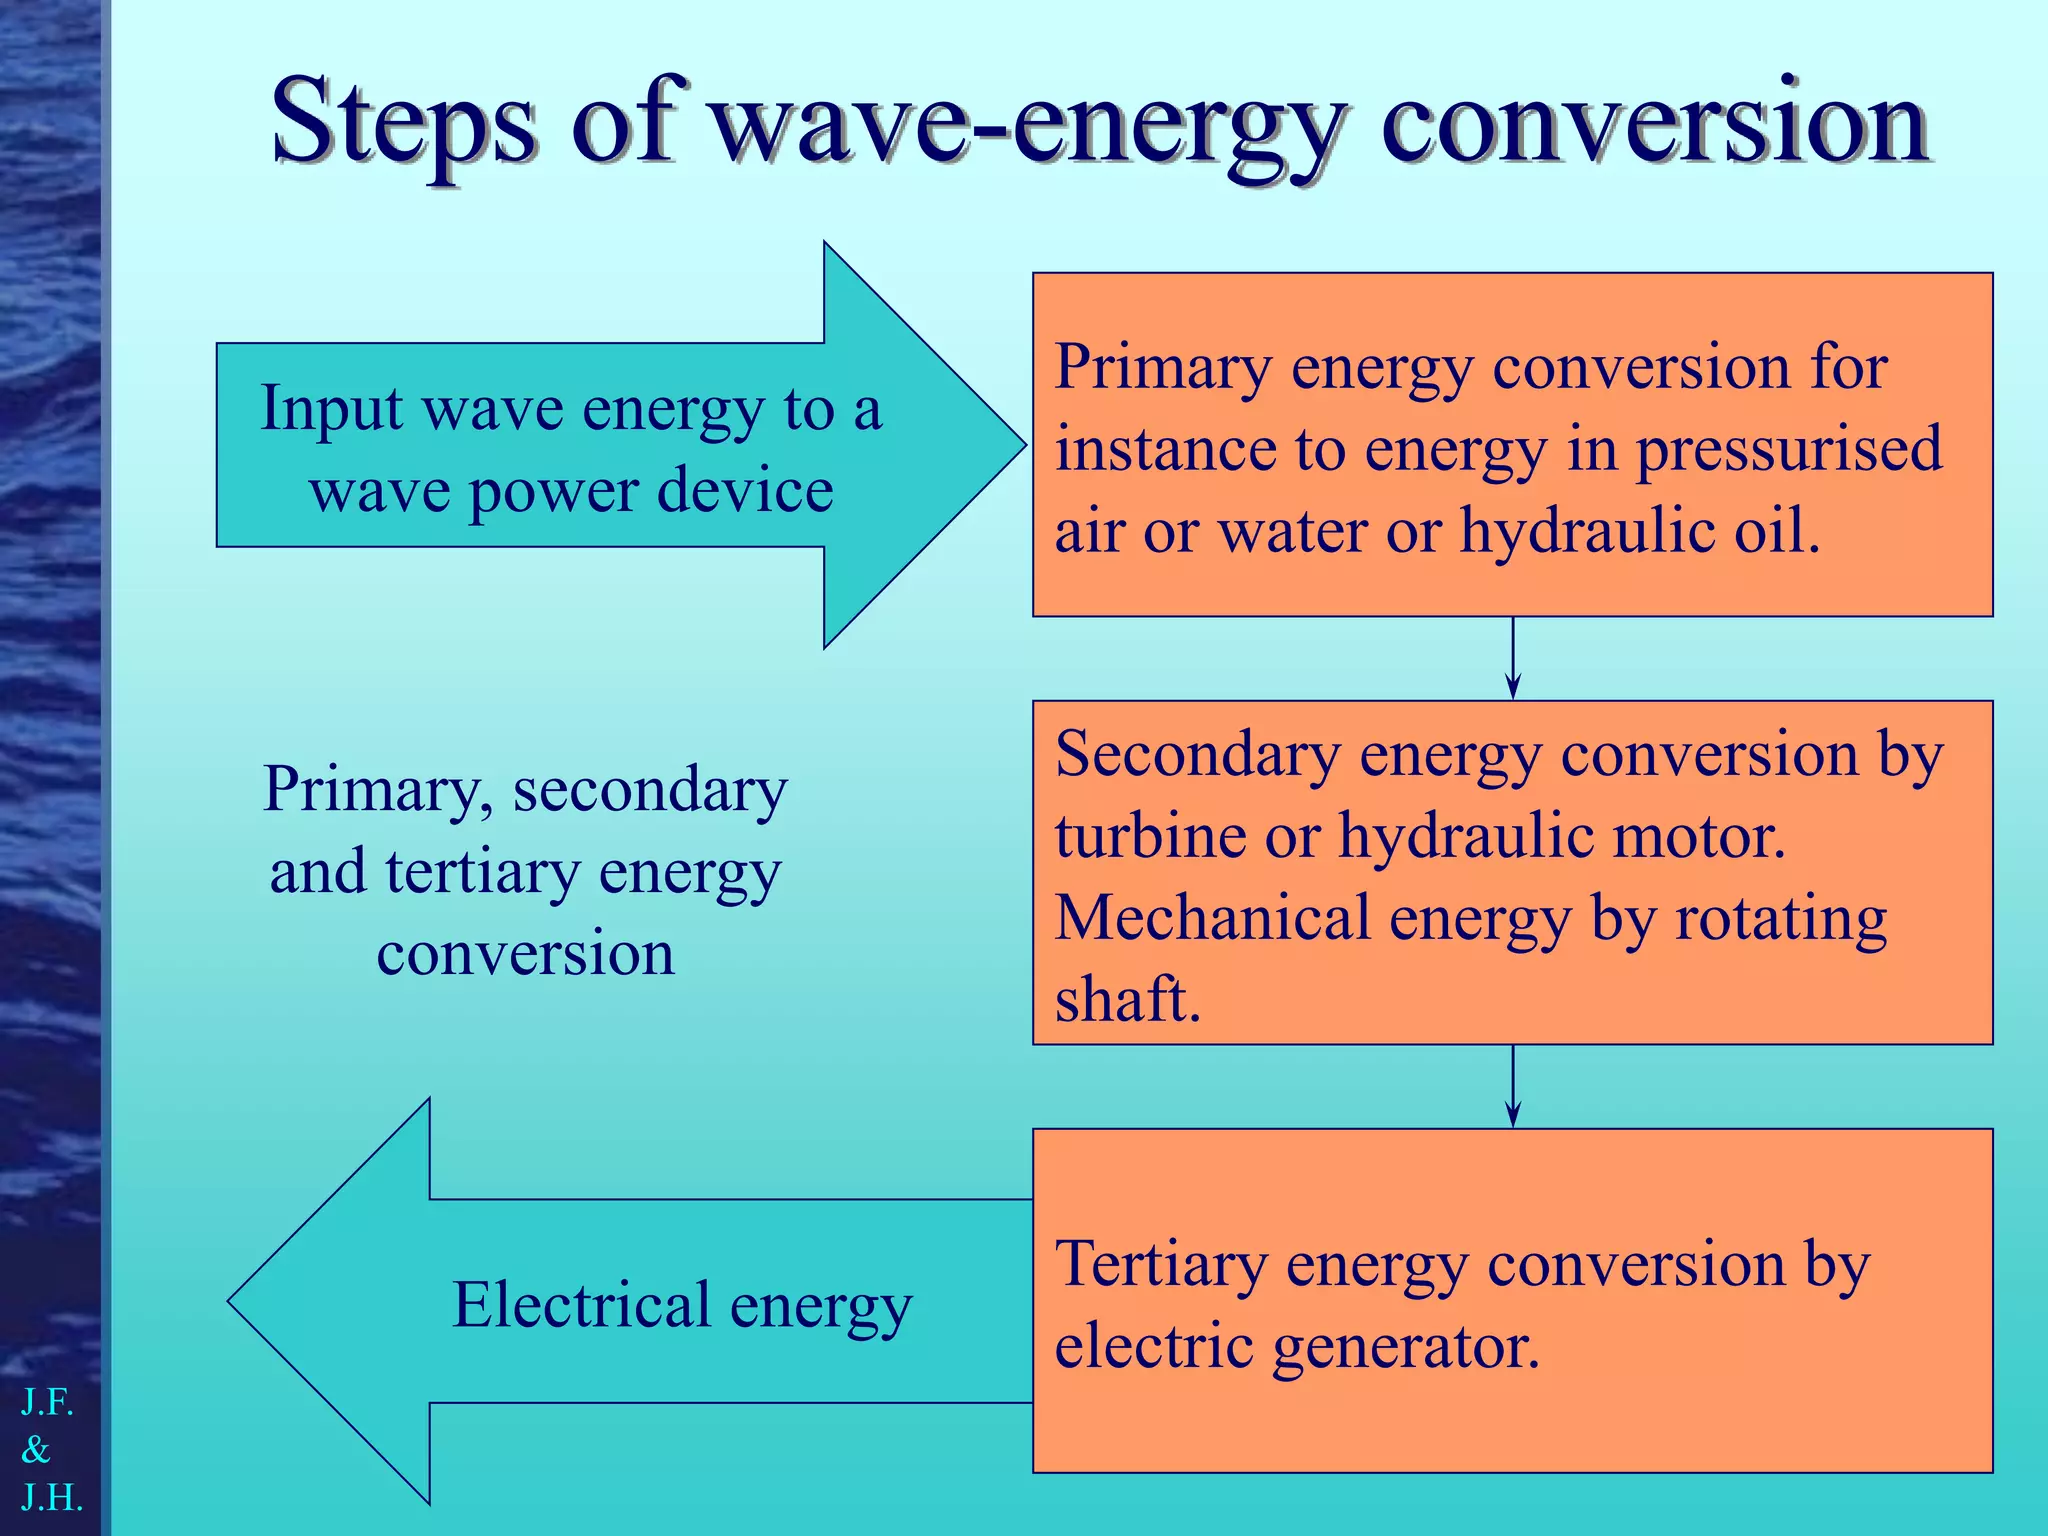
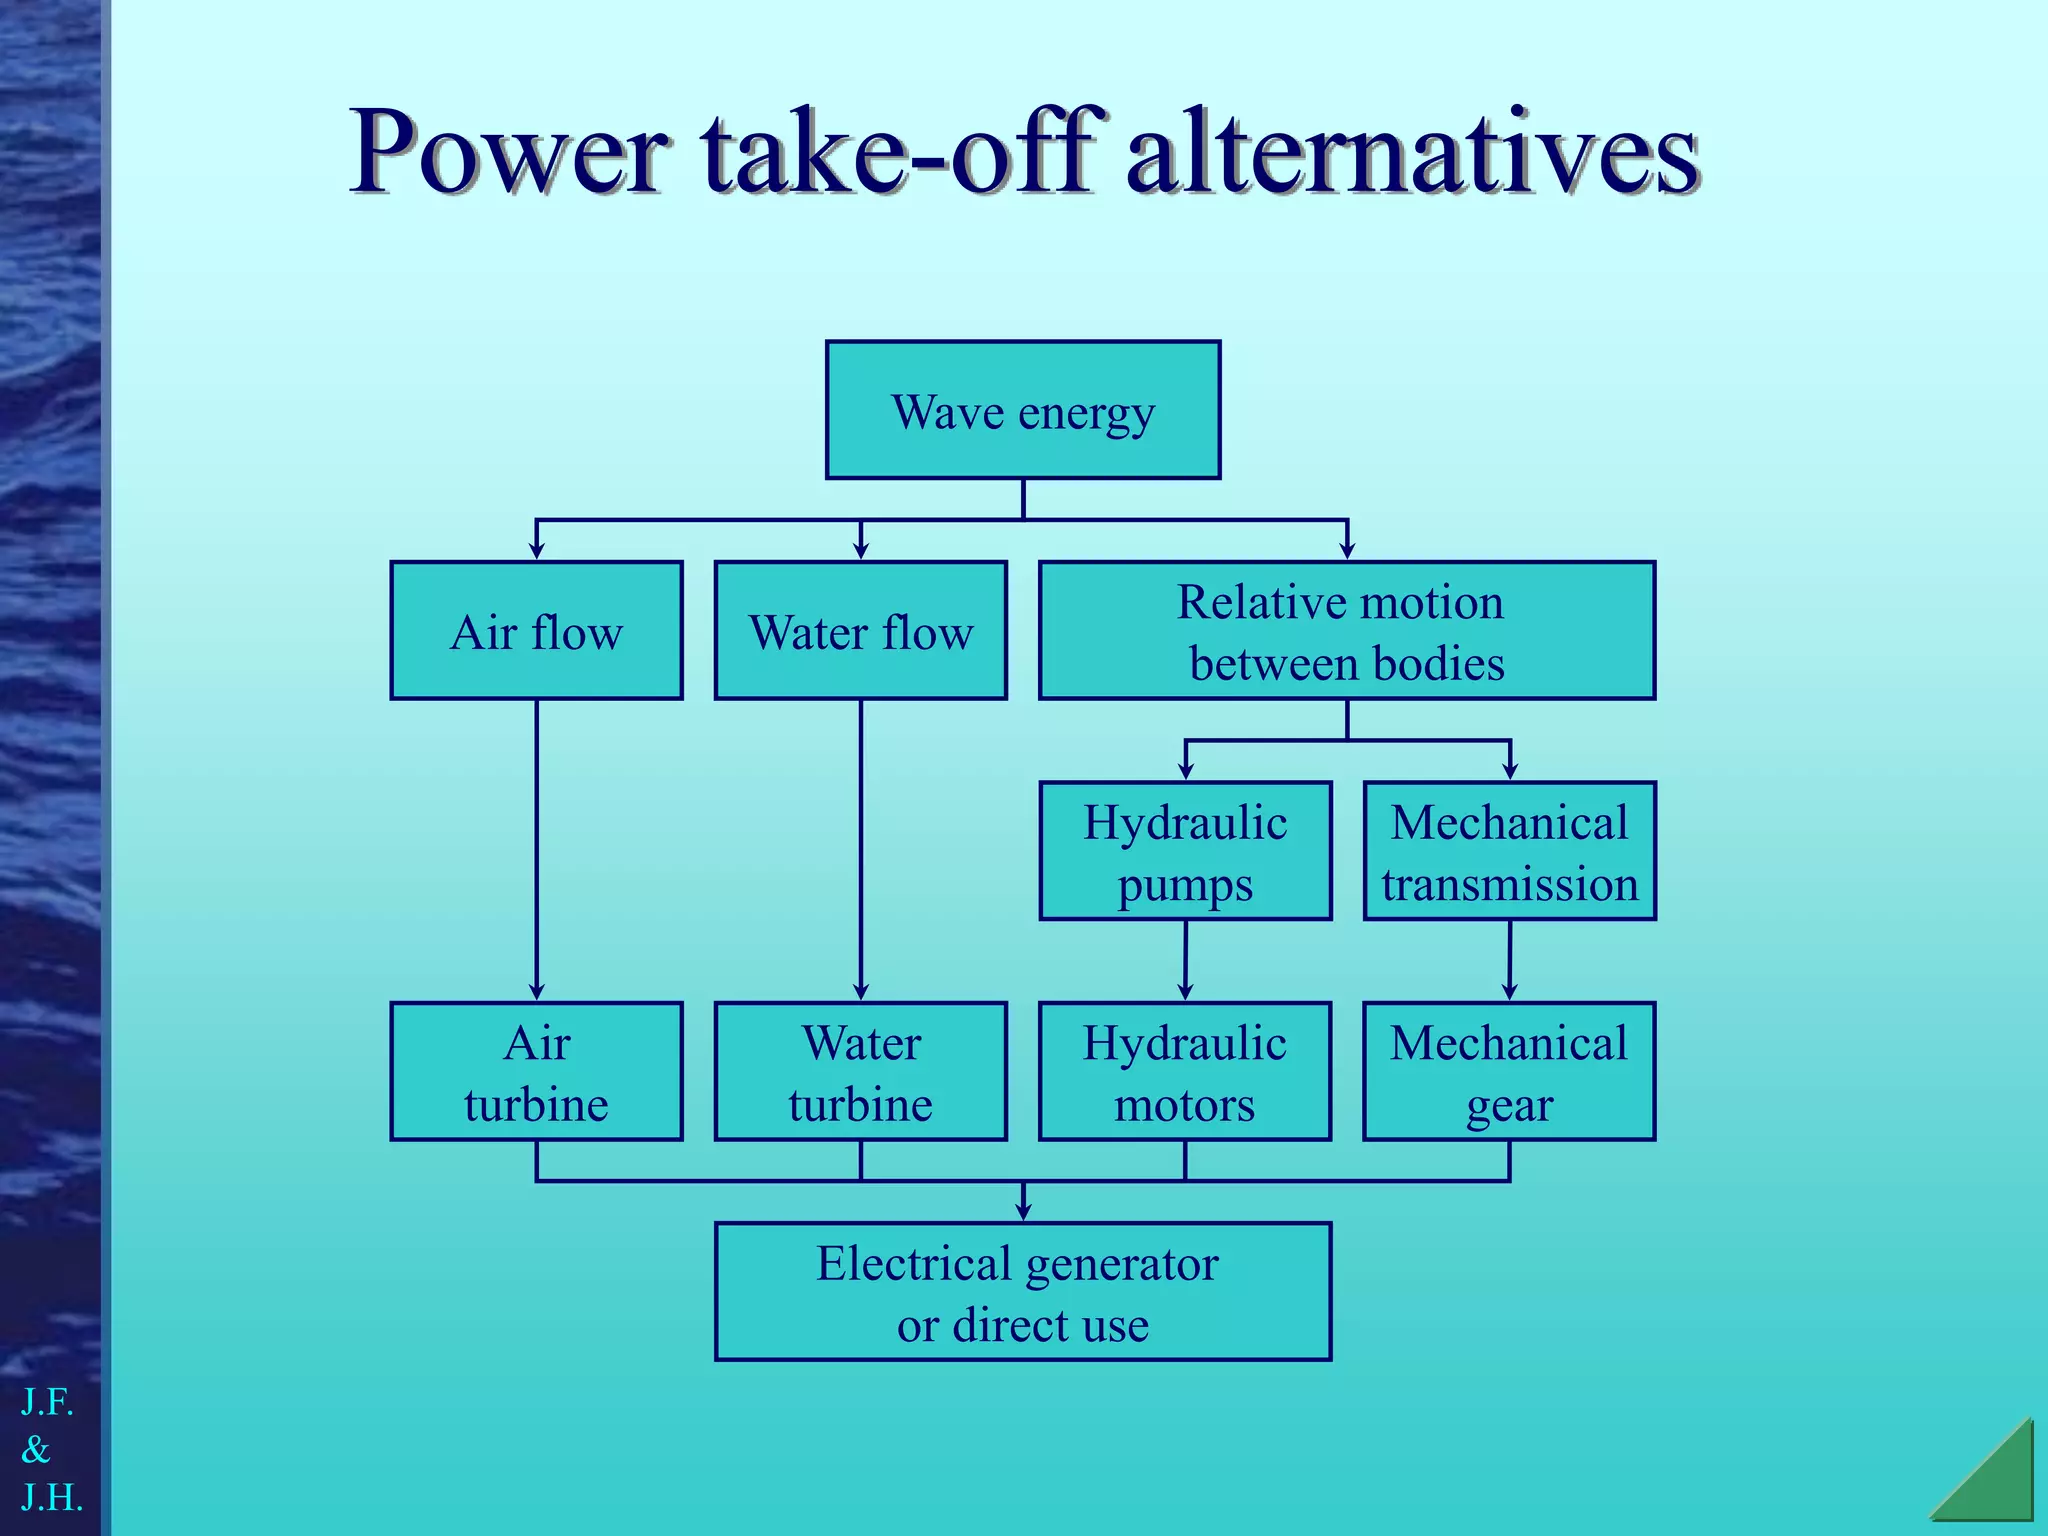
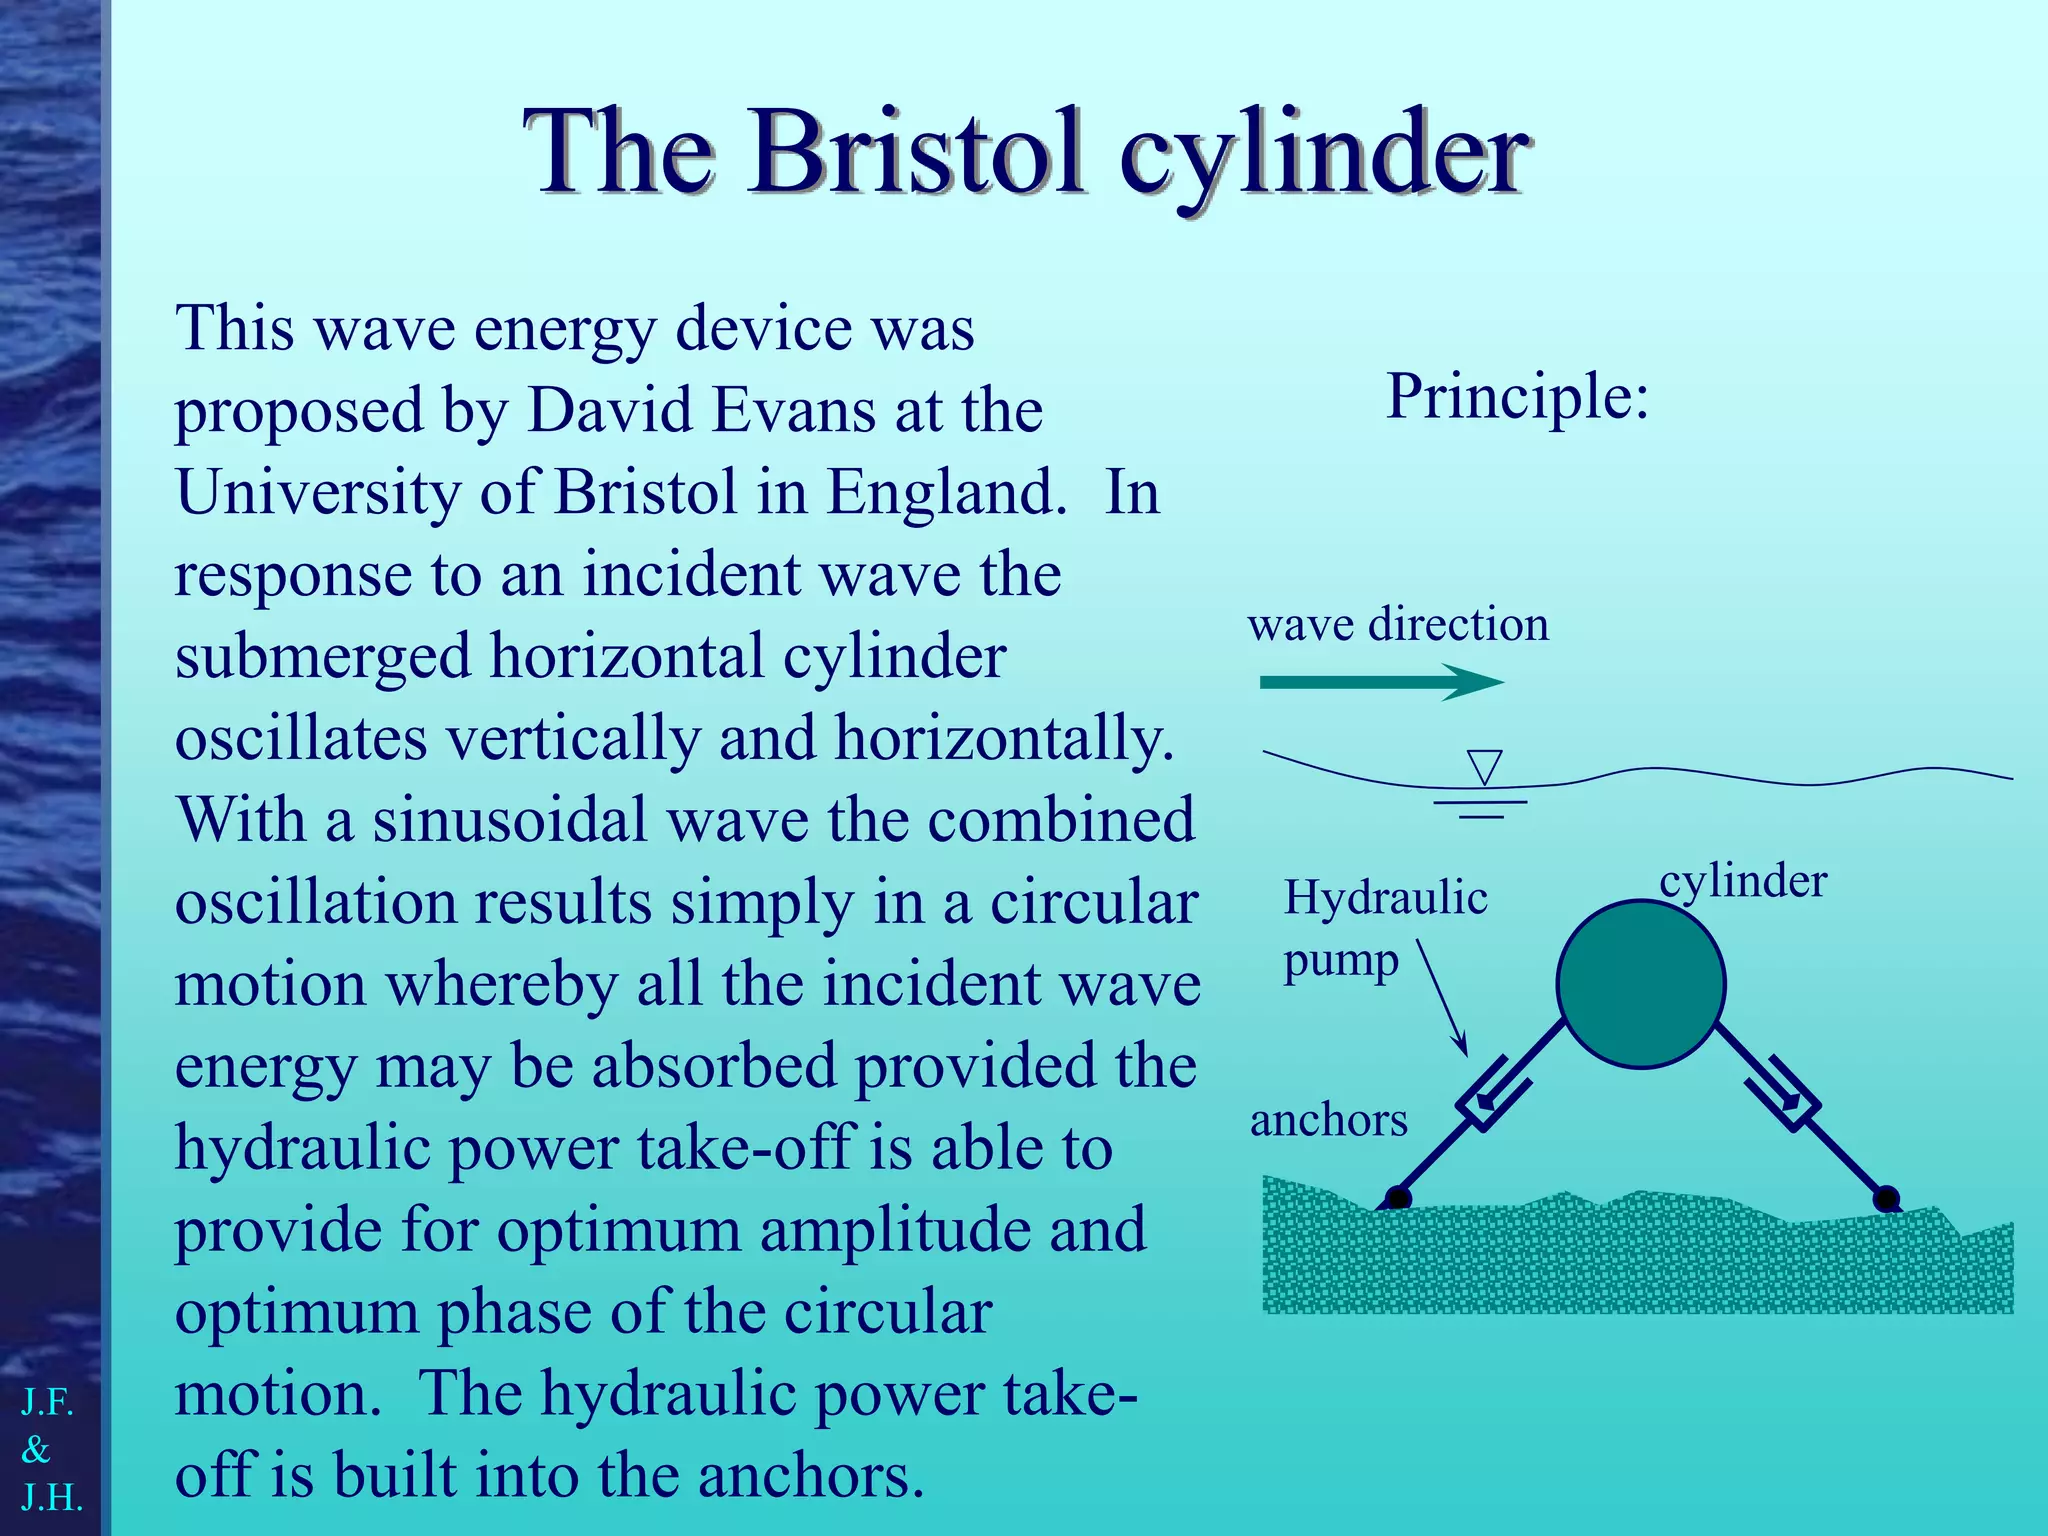
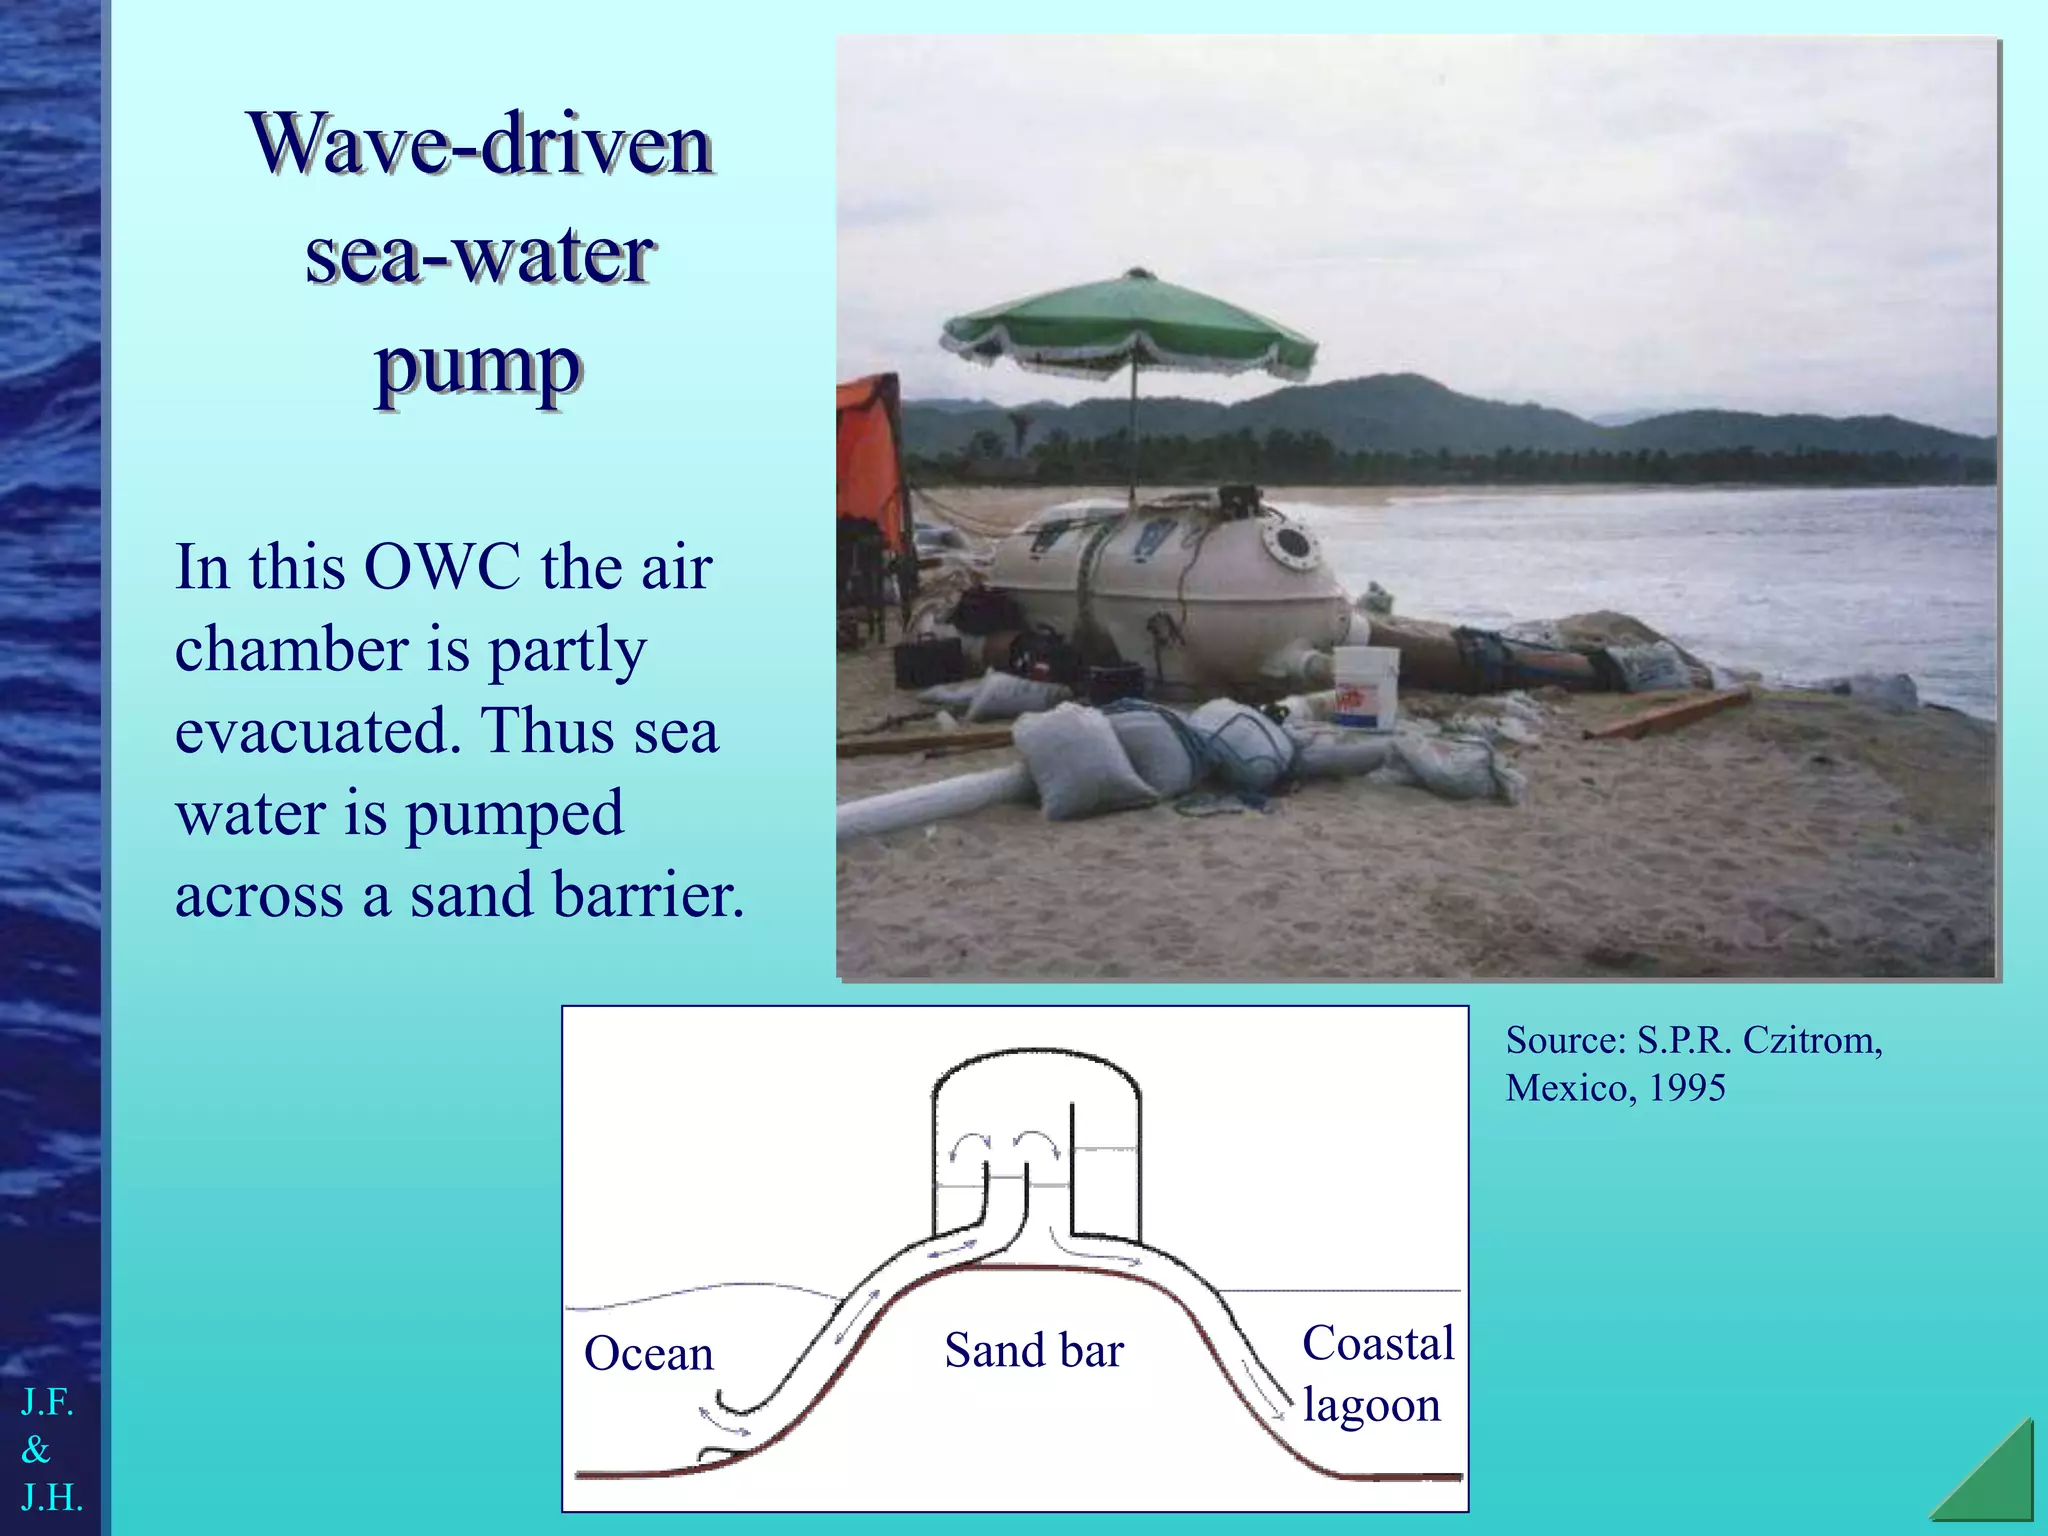
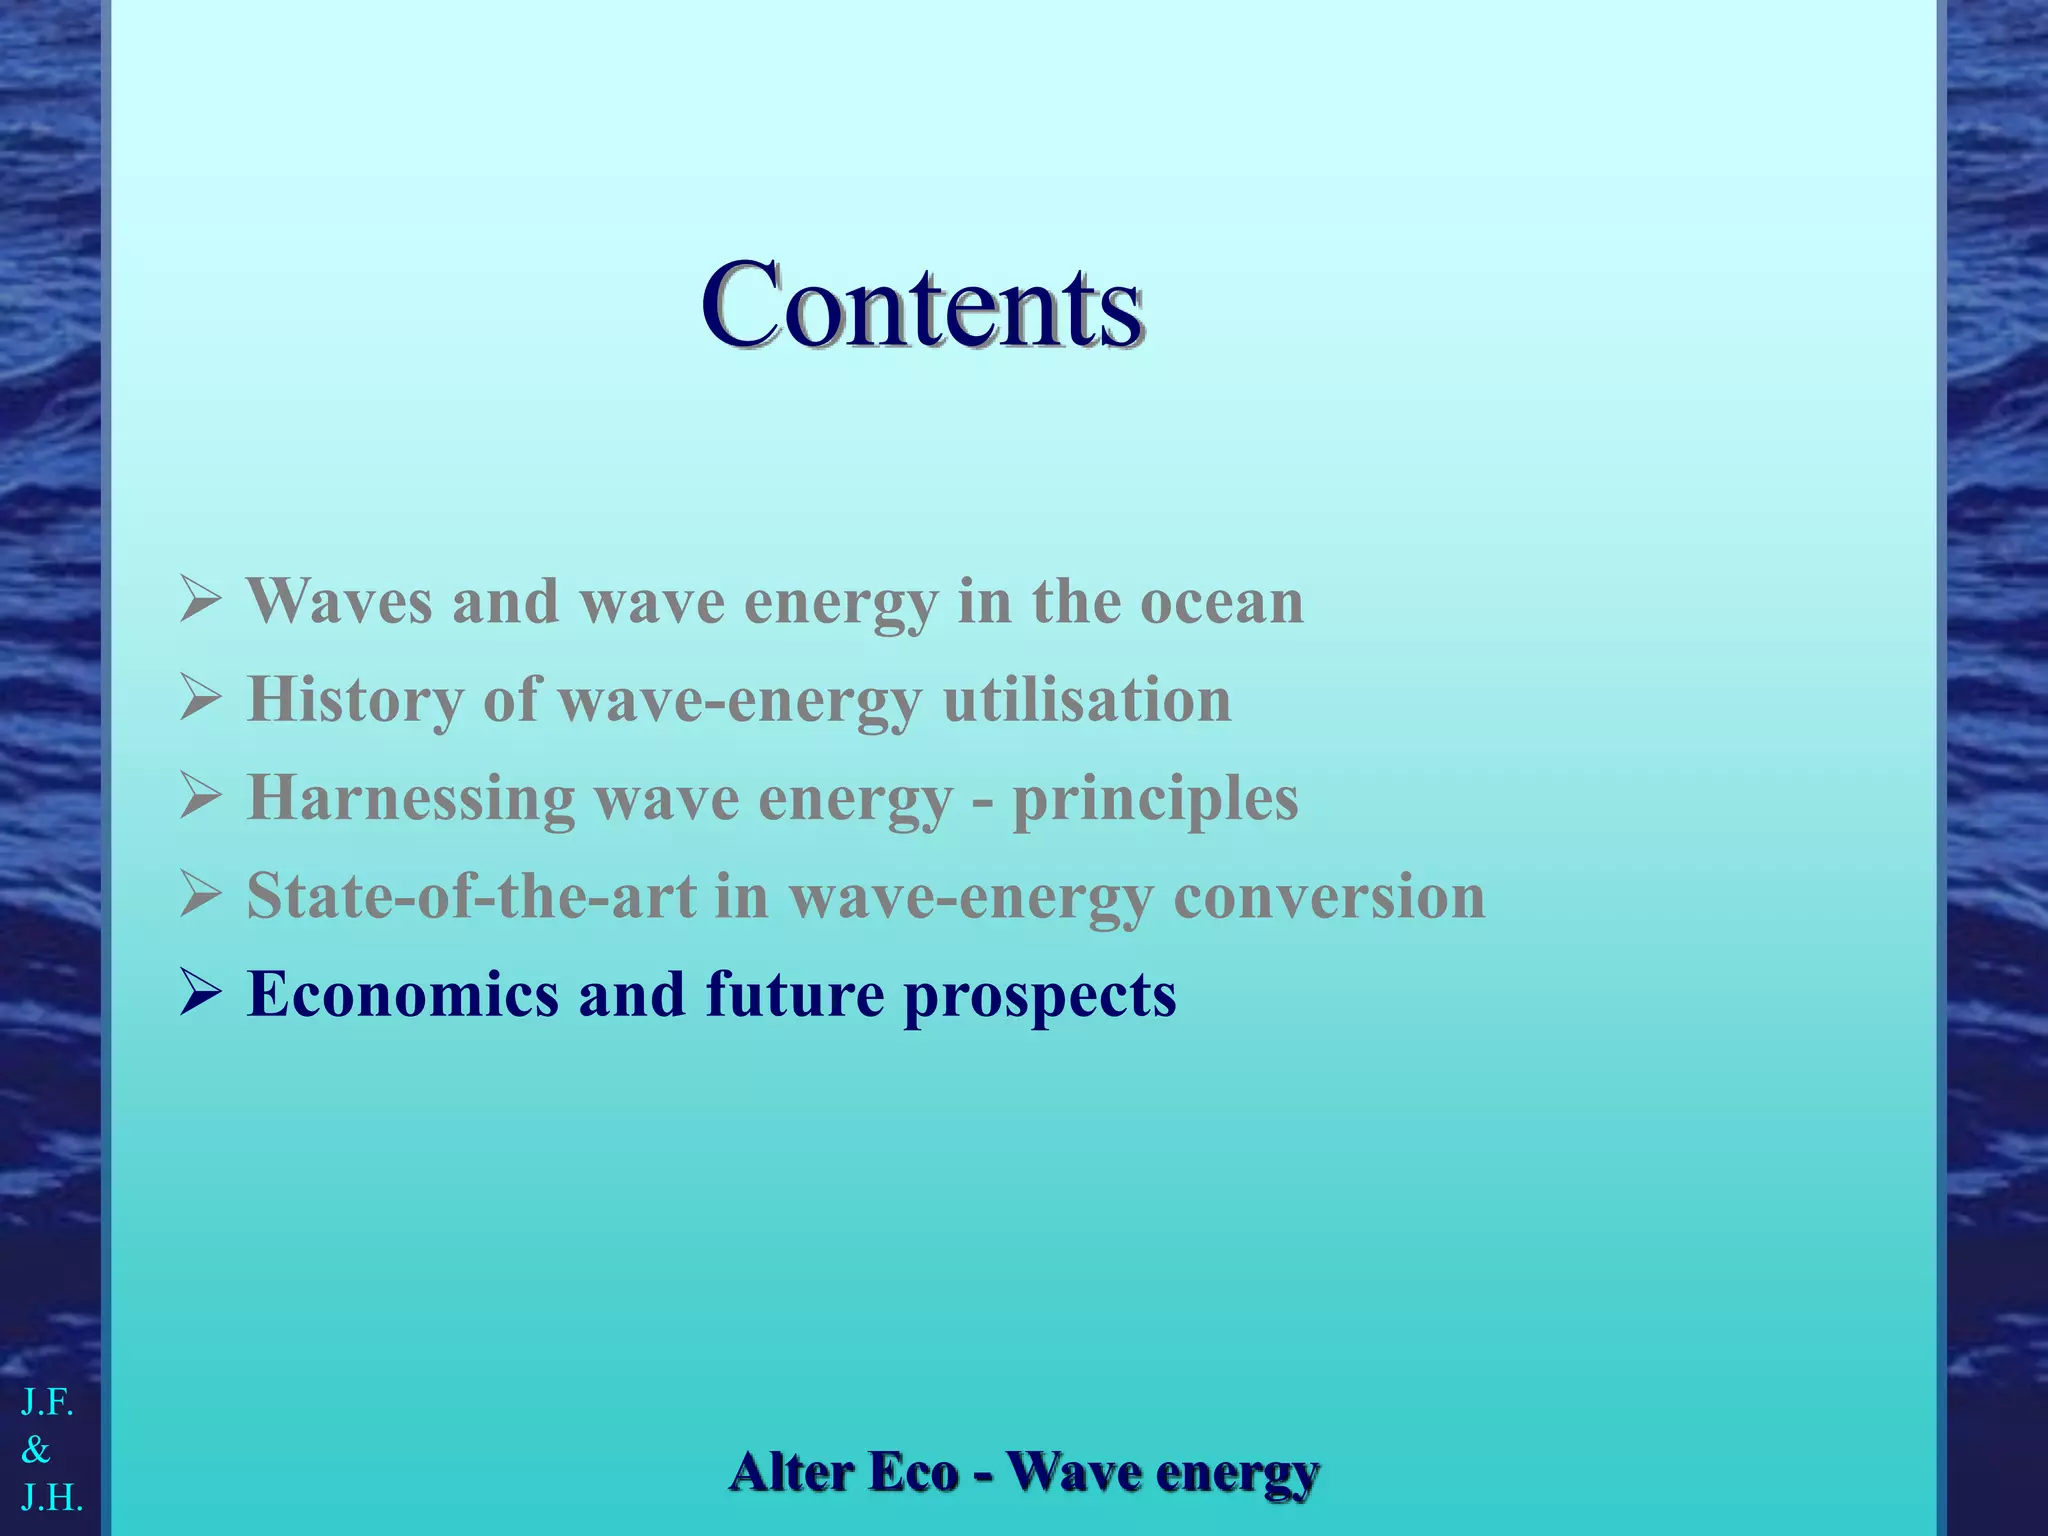
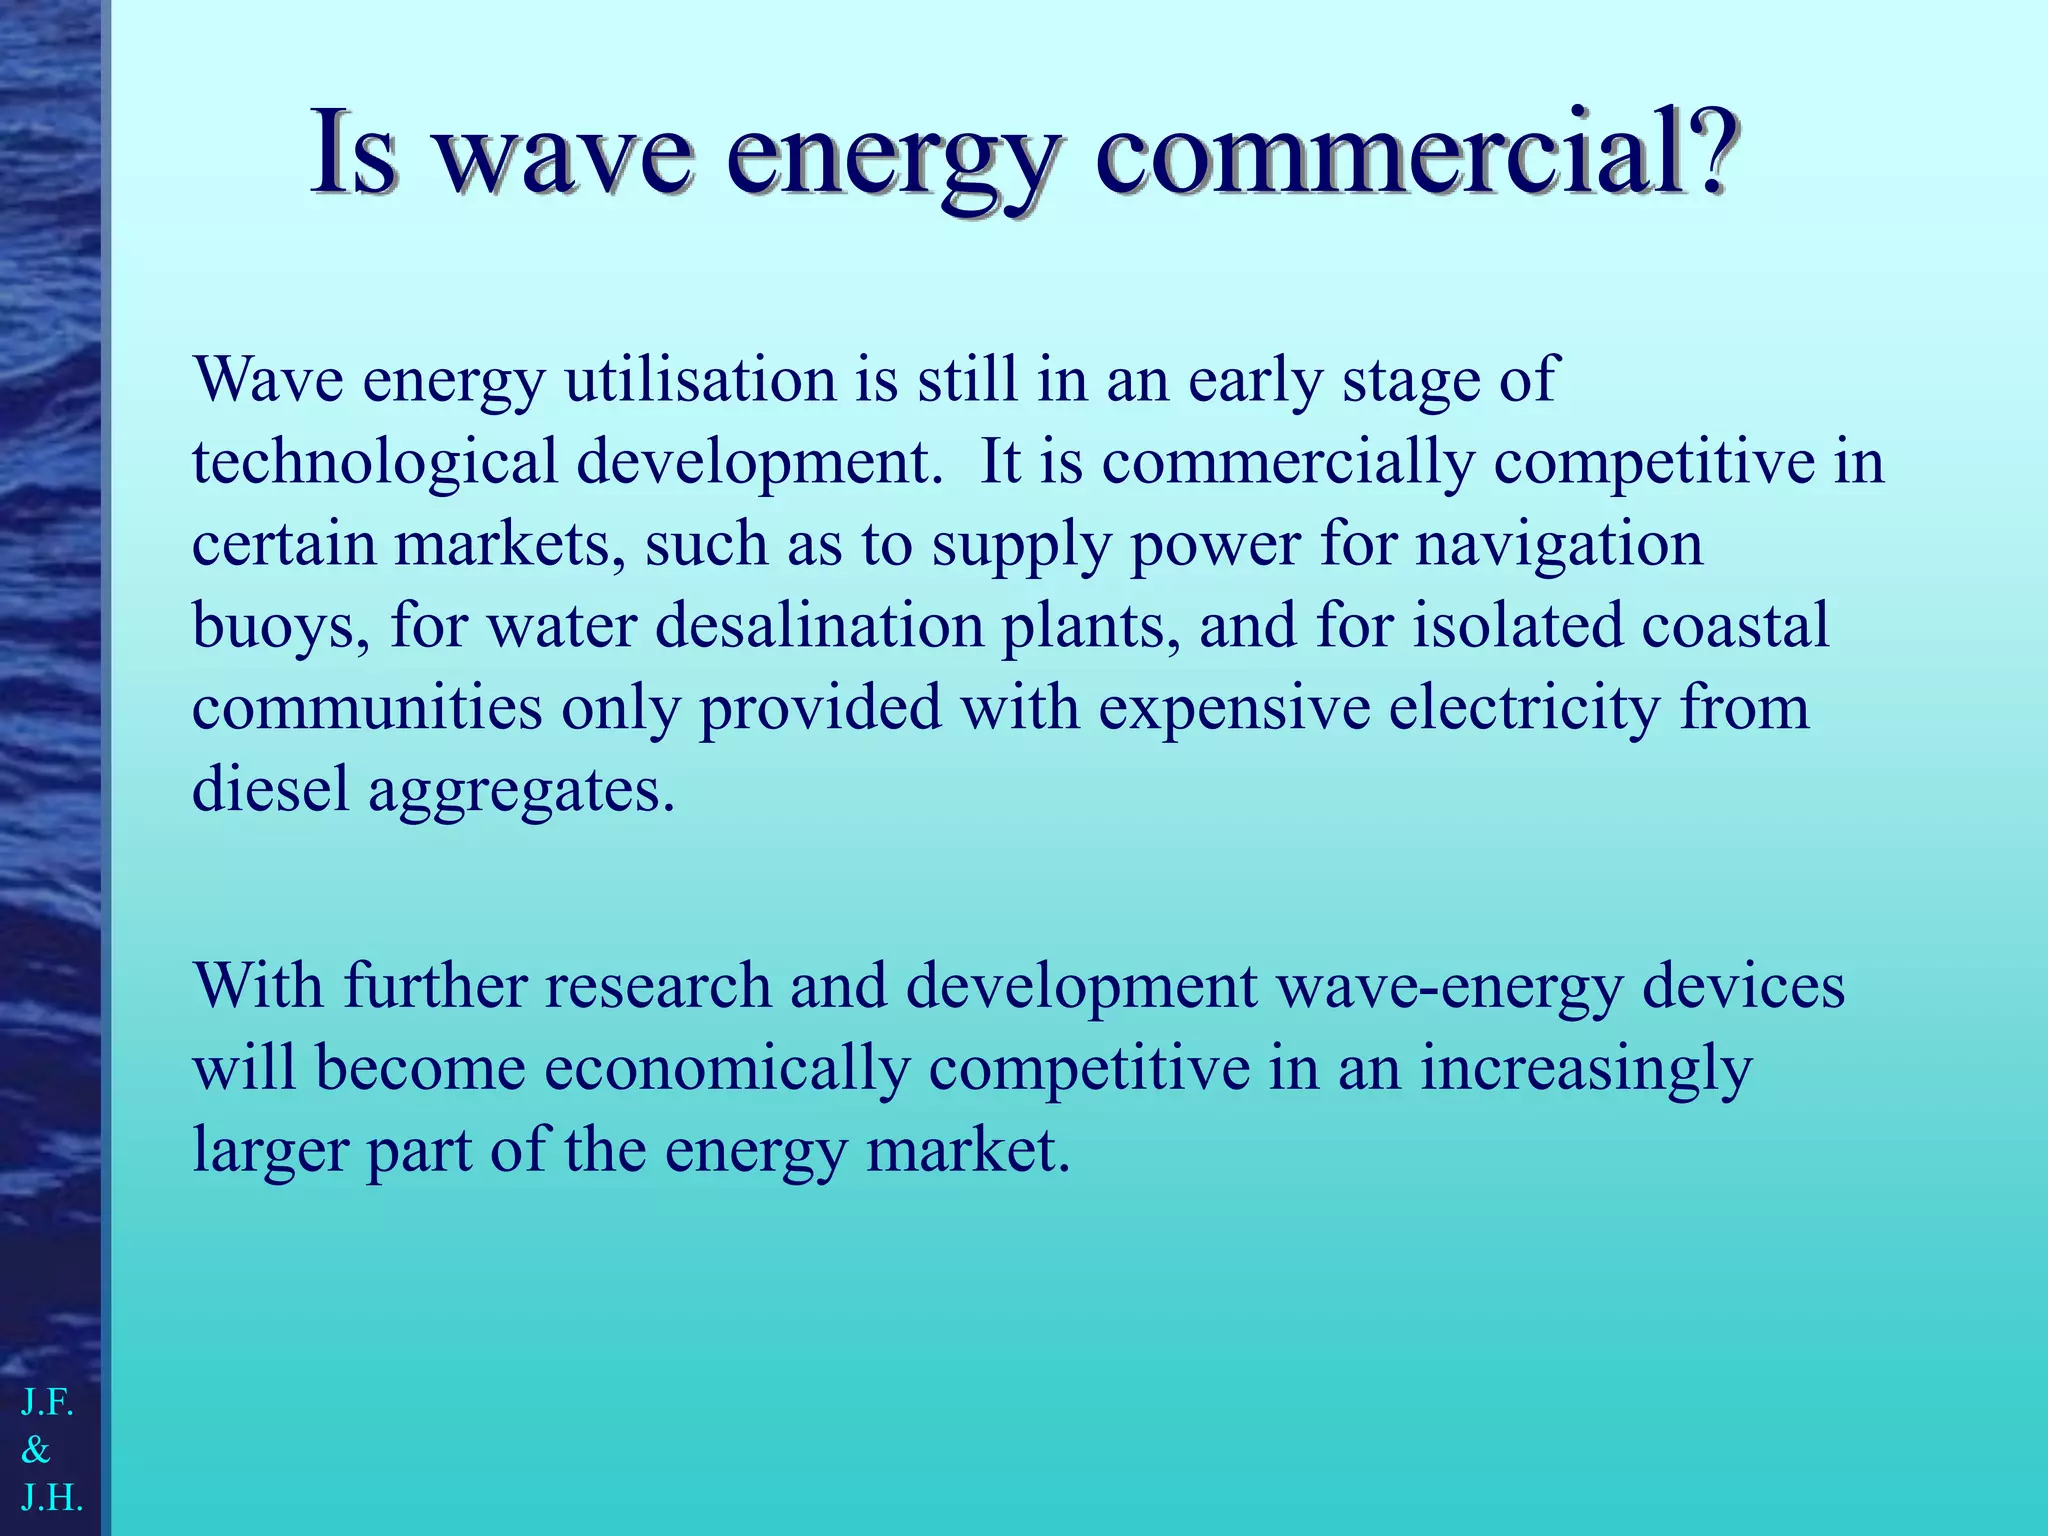
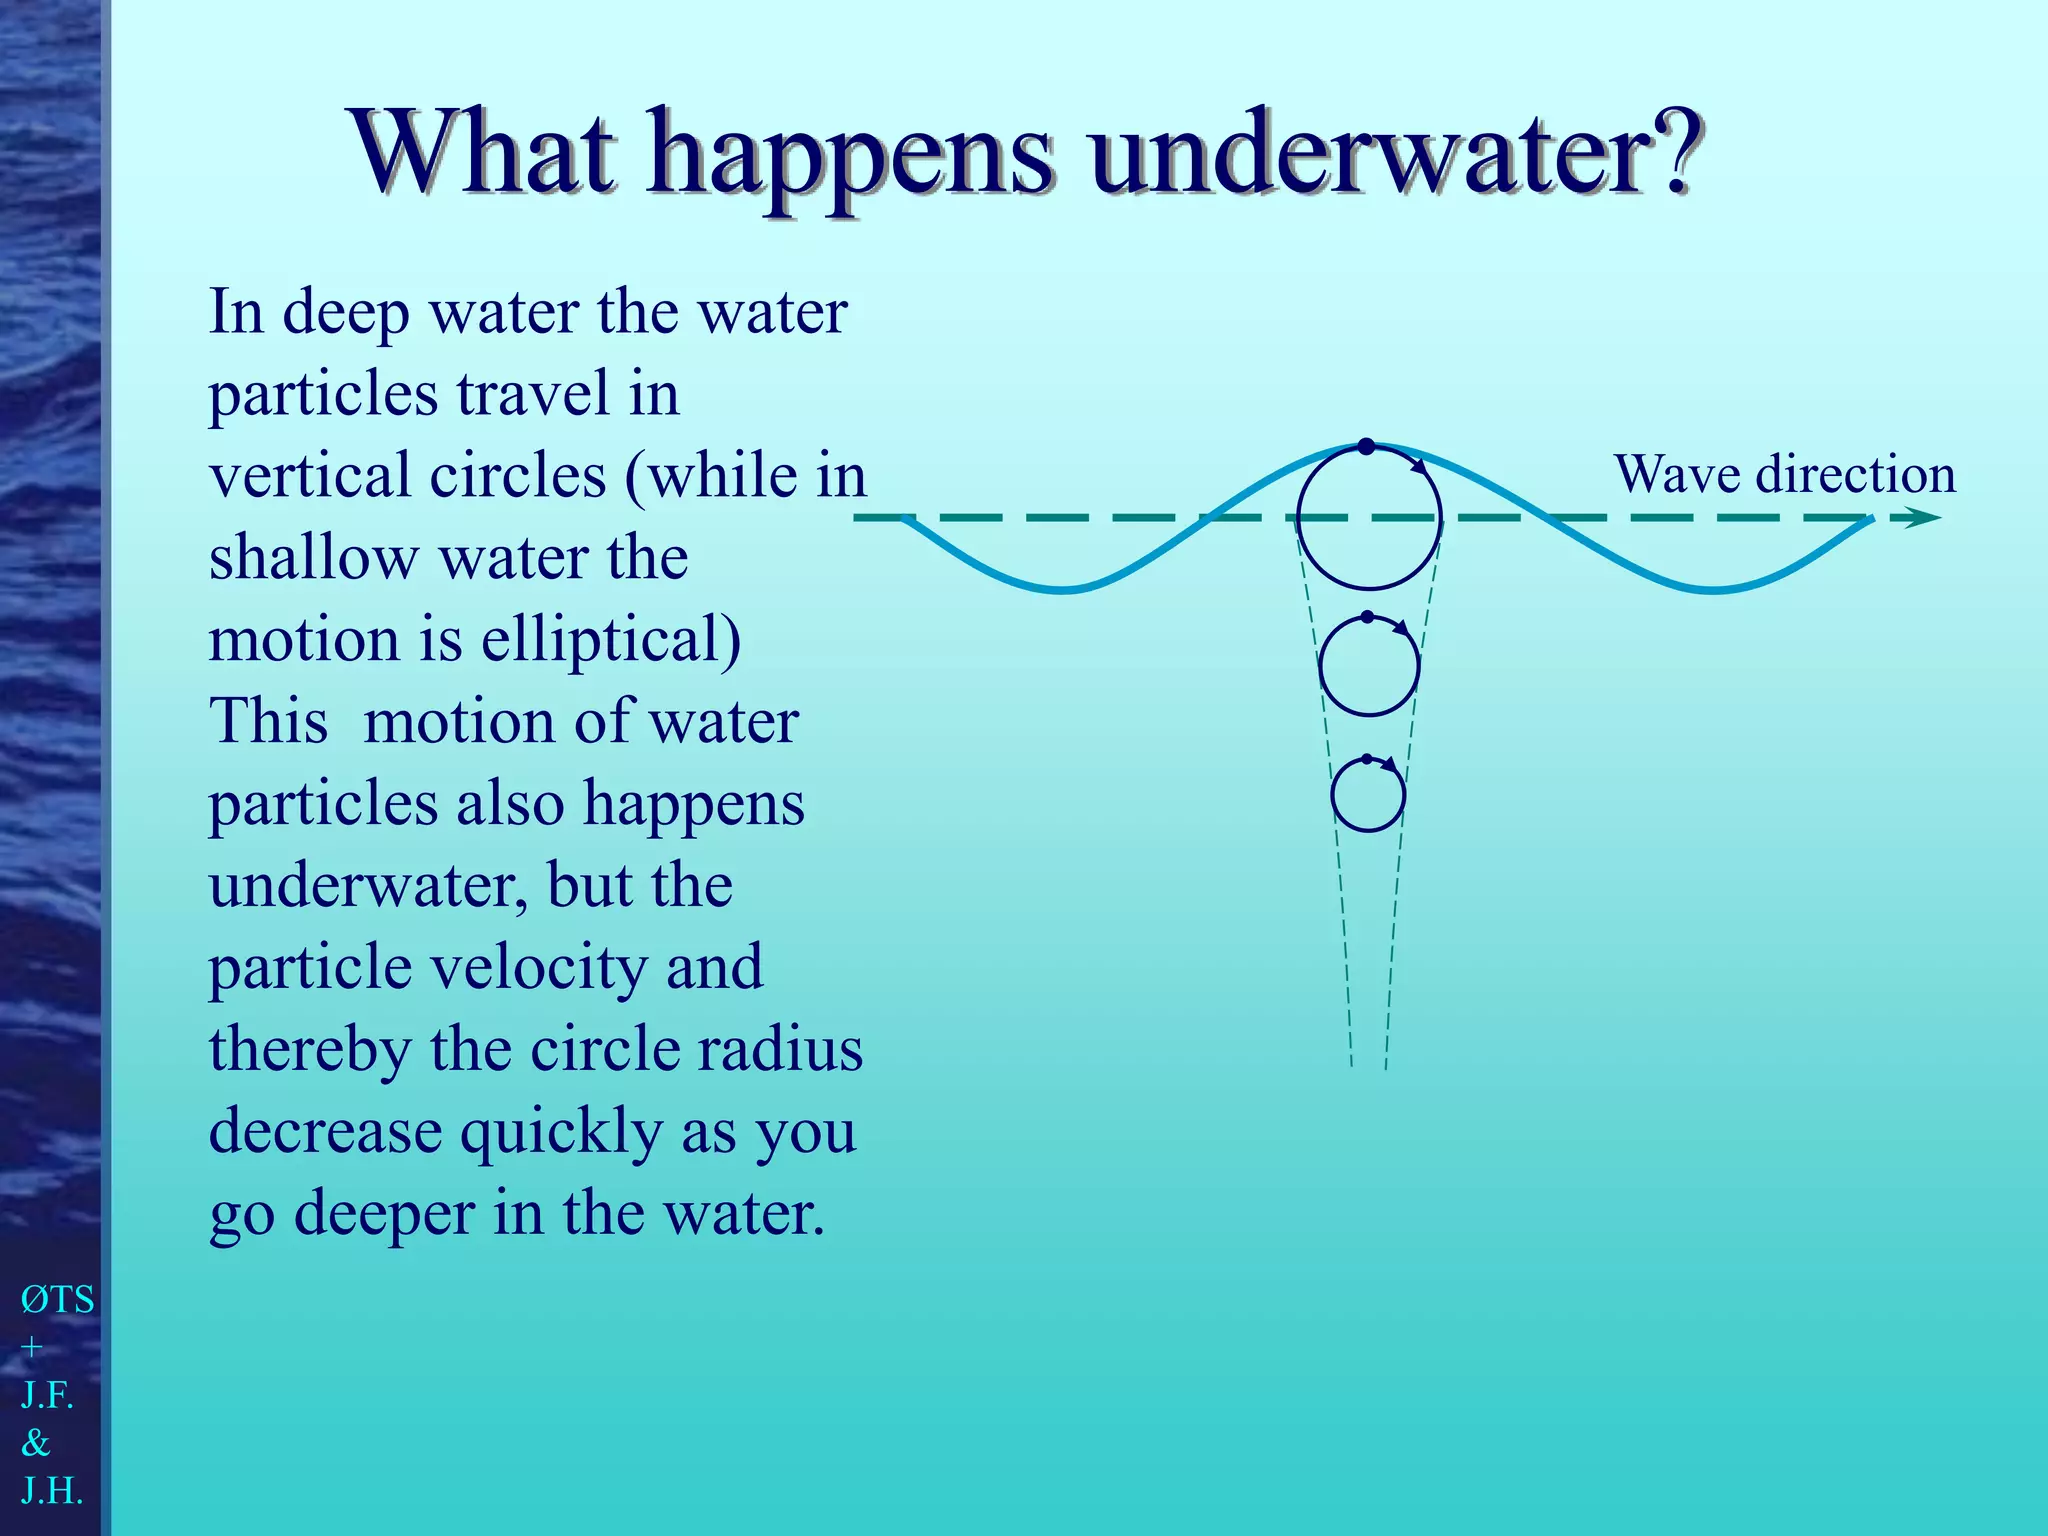
The document discusses wave energy as a renewable energy source created by wind interactions with the ocean. It covers historical developments in wave energy utilization, principles of harnessing wave energy, and current state-of-the-art wave energy conversion technologies. Additionally, it addresses economic prospects and seasonal variations in wave energy transport, highlighting the potential for wave-power plants to become significant energy components for coastal nations.
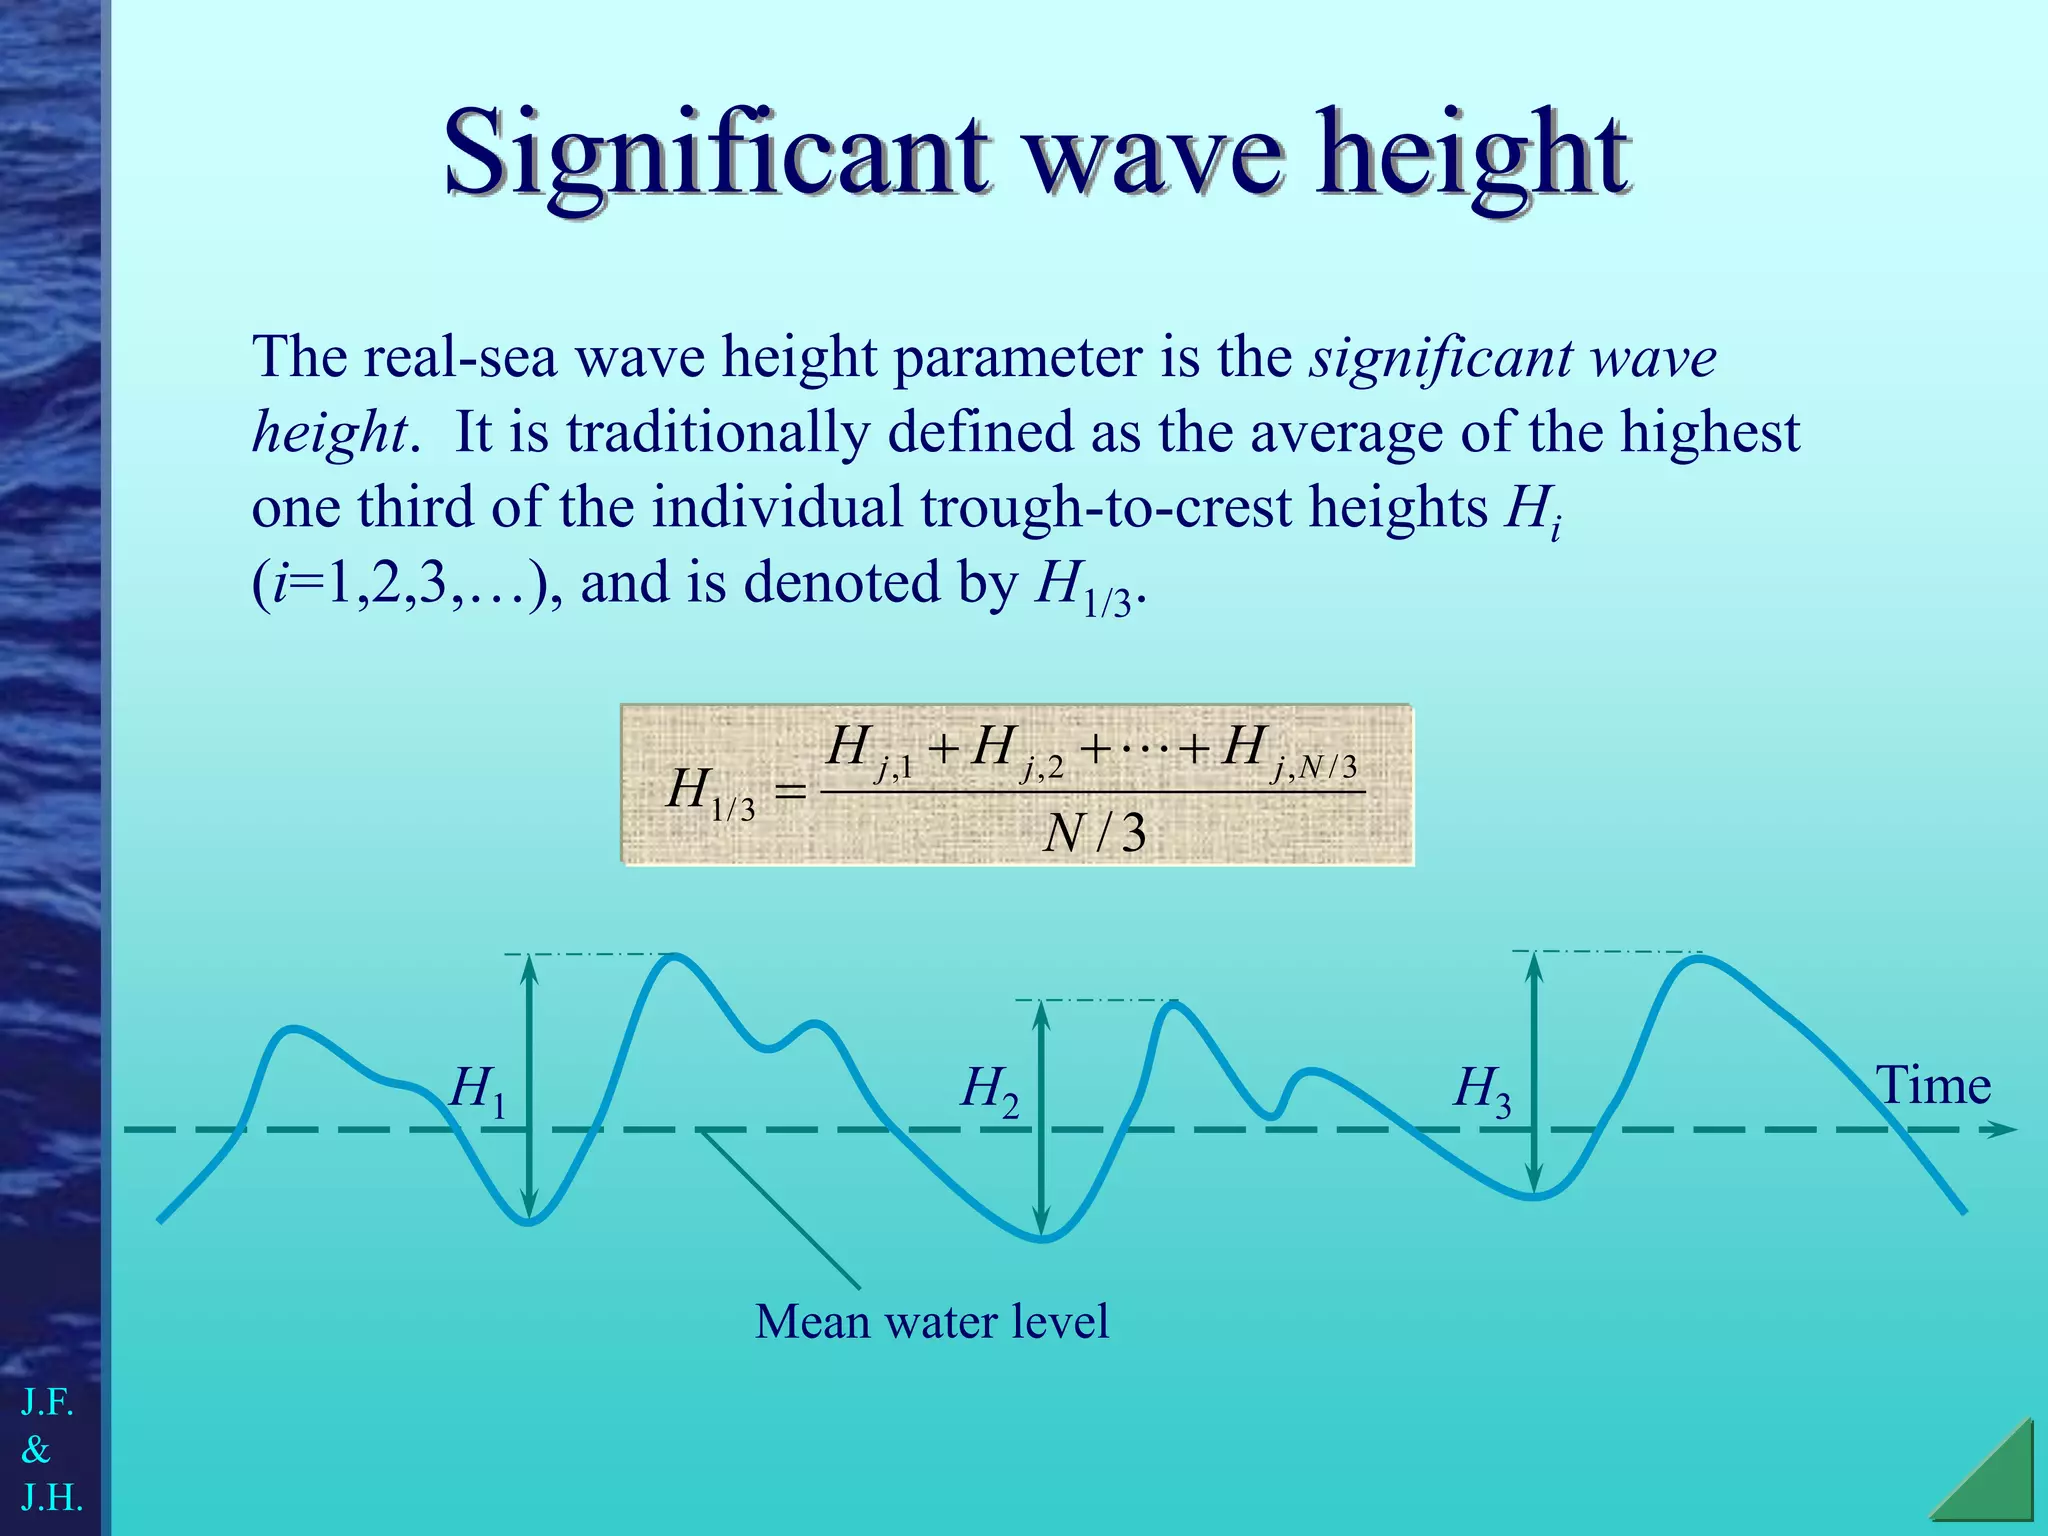

![A measurement example
This time series (above) from high
sea shows that individual waves
vary greatly in size and form. The
corresponding energy spectrum is
shown to the right. For this storm
wave the significant wave height is
Hs = 8 m.
0 1 2 3 4 5 6 7 8 9 10 11 12
-6
-4
-2
0
2
4
6
-6
0
50
100
150
0.0 0.1 0.2 0.3
S ( f )
Frequency [Hz]
Time [minutes]
Surface
elevation
[m]
Source: OCEANOR, Norway
J.F.
&
J.H.](https://image.slidesharecdn.com/waveenergy-230428103411-5058e4a8/75/Wave-energy-and-its-utilization-23-2048.jpg)
![0.0 0.1 0.2 0.3
0
5
10
15
S ( f )
Frequency [Hz]
0
50
100
150
0.0 0.1 0.2 0.3
S ( f )
Frequency [Hz]
These are typical energy
spectra from wind-sea
conditions (top) and mixed
wind-sea and swell
conditions (bottom).
The swells contain lower
frequencies (high peak)
than the wind waves (low
peak).
Significant wave heights:
8 m (top) and 3 m (bottom)
Real-sea spectra
J.F.
&
J.H.
Source: OCEANOR, Norway](https://image.slidesharecdn.com/waveenergy-230428103411-5058e4a8/75/Wave-energy-and-its-utilization-24-2048.jpg)