
Recommended
Recommended
More Related Content
What's hot
What's hot (19)
Similar to Effect of some abiotic factors on the growth of Oreochromis niloticus Linnaeus, 1758 (Perciformes: Cichlidae) in tropical ecosystems (Cameroon)
Similar to Effect of some abiotic factors on the growth of Oreochromis niloticus Linnaeus, 1758 (Perciformes: Cichlidae) in tropical ecosystems (Cameroon) (20)
More from Journal of Research in Biology
More from Journal of Research in Biology (20)
Recently uploaded
Recently uploaded (20)
Effect of some abiotic factors on the growth of Oreochromis niloticus Linnaeus, 1758 (Perciformes: Cichlidae) in tropical ecosystems (Cameroon)
- 1. Article Citation: Mohamed Nsangou Nchoutndignigni, Sévilor Kekeunou, Gidéon Ajeagah, Benoit Bapfubusa and Abraham Fomena Effect of some abiotic factors on the growth of Oreochromis niloticus Linnaeus, 1758 (Perciformes:Cichlidae) in tropical ecosystems (Cameroon). Journal of Research in Biology (2015) 5(4): 1738-1754 JournalofResearchinBiology Effect of some abiotic factors on the growth of Oreochromis niloticus Linnaeus, 1758 (Perciformes: Cichlidae) in tropical ecosystems (Cameroon) Keywords: Oreochromis niloticus, fish farming, pond, water quality, fertilization. ABSTRACT: The Growth of Oreochromis niloticus (2.6g initial average size) was studied in 100m2 earthen ponds for 180 days under tropical field environment. Varying fertilizing regimes consisting of Pennisetum purpureum (PP) and Musa sapientum (MS), two locally available weedy grasses were applied in duplicates in the experimental ponds, at the rate of 0.1-0.2 kg dry matter per m2 per day. Water quality parameters were monitored bimonthly between 8:00am-9:00am . Final average fish weight varied significantly (p<0.05) as follows: 43.85g, 35.5g, 59.5g, 24.9g and 50g, 2 respectively for PP, MS, MS+PP, T0 and T1. Corresponding daily growth were 2.2g/d, 0.1g/d, 0.3g/d, 0.1g/d and 0.2g/d. Survival rate equally varied significantly as follow: 60 %, 67 %, and 98 %, 70 % and 97 % respectively. During the study period, the results indicated the water quality were permissibole limits and can be used for livestock of Oreochromis niloticus . 1738-1754 | JRB | 2015 | Vol 5 | No 4 This article is governed by the Creative Commons Attribution License (http:// creativecommons.org/licenses/by/4.0), which gives permission for unrestricted use, non- commercial, distribution and reproduction in all medium, provided the original work is properly cited. www.jresearchbiology.com Journal of Research in Biology An International Scientific Research Journal Authors: Mohamed Nsangou Nchoutndignigni1,2* , Sévilor Kekeunou2 , Gidéon Ajeagah3 , Benoit Bapfubusa2 , Abraham Fomena4 Institution: 1. Laboratory of Zoology, Higher Teacher Training College, University of Yaoundé I, Cameroon 2. Laboratory of Zoology, Faculty of Science, University of Yaoundé I, Cameroon 3. Laboratory of Hydrobiology and Environment, Faculty of Science, University of Yaoundé I, Cameroon 4. Laboratory of Parasitology and Ecology, Faculty of Science, University of Yaounde I, Cameroon Corresponding author: Mohamed Nsangou Nchoutndignigni Email Id: Web Address: http://jresearchbiology.com/ documents/RA0504.pdf Dates: Received: 12 Jan 2015 Accepted: 10 Mar 2015 Published: 05 June 2015 Journal of Research in Biology An International Scientific Research Journal ORIGINAL RESEARCH ISSN No: Print: 2231 –6280; Online: 2231- 6299
- 2. INTRODUCTION Aquaculture contributes significantly to the economies and food security (FAO, 2006). China has seen its annual production of aquaculture increasing from 7% in 1961 to 35% in 2010. Nevertheless, it remains a marginal activity in sub-Saharan Africa . Growth in sub- Saharan Africa increased from less than 1% in 1989 to 4% in 2011 (FAO, 2012). Food security is a major problem for African countries (Hishamunda and Jolly, 1998). To establish a balanced diet of the populations, FAO (2006) thinks that the intensification and diversification of fish production systems would cope with this problem. Fish is the main source of protein for a considerable part of the population. It represents 40% of the protein intake of animal origin in the diet and covers 9.5% of total needs. In 2012, these imports fishes were estimated at 160,000 tons valued for a total of 60 billion Francs CFA (MinEPIA, 2014) .To solve the problem of demand for fish, the Cameroonian state must develop fish farming which is proposed as an alternative. The healthy aquatic ecosystem depends on the physico–chemical and biological characteristics (Venkatesharaju et al., 2010). To assess these characteristics, monitoring of these parameters is essential to identify magnitude and source of any pollution load. These characteristics can identify certain condition for the ecology of living organisms and suggest appropriate conservation and management strategies (Srivastara et al., 2009, Damotharan et al., 2010; Prasanna and Ranjan, 2010). It’s in this context that we undertook the study of the aquatic ecosystem ponds. This study adds new elements to previous works done by Snoussi (1984); Foto (1989); Cheggour et al., (2004); Bazairi et al., (2005); Fekhaoui (2005); El Morhit et al., (2008). The aim of this work is to study the physical and chemical parameters that influence the growth of Oreochromis niloticus in earthen ponds. Better monitoring of the water quality of fish ponds provides better growth and therefore a good harvest of fish, making fishes available in the Cameroonian market MATERIALS AND METHODS Study site feature Yaounde which is, the political capital of Cameroon (Central Africa). It’s lies between North latitude 3°52' and longitude 11°32', with an average altitude of about 750m above sea level (Sanchoir, 1995). The landscape is hilly and the city lies on several hills which are 25 to 50m high (Eno-Belinga and Kabeyene 1982; Ekodeck, 1984). The experimental ponds for our research are located at the University of Yaoundé I (Fig. 10). The climate is equatorial, characterized by two dry seasons (a long dry season from January to March and a short dry season from July to August) alternating with two rainy seasons (small rainy season from September to mid-November and a long rainy season from mid-March to June) of relatively uneven and variable duration from one year to another (Suchel, 1987). Soils are ferro-lateritic with pH value ranging from 4.5 to 5.8 (Yongué-Fouateu, 1986). Experimental ponds are supplied by derivated water from Olézoa, a stream meeting Mingoa and Aké on the right bank of Mfoundi situated in the southern part of Yaounde. Annual average water temperature is close to 25 °C. Biological materials 1000 fry of Oreochromis niloticus averaging 2.6g (±0,6) were used in the experiment. These fish were reproduced at the Aquaculture Station Melen-Yaounde, from brooders collected from Sanaga rivers some 10 years earlier (Brummett et al., 2004). The plant materials consisted of Pennisetum purpureum and Musa sapientum which was collected in the swamp of the University of Yaounde I Campus. Nchoutndignigni et al., 2015 1739 Journal of Research in Biology (2015) 5(4): 1737-1754
- 3. Ponds: Five ponds of 100 m2 with a depth of 0.7m for ponds 1, 2 and 3, and a depth of 1m for ponds 4 and 5. To these five ponds, we added a reservoir of water of about 200m2 with a depth of 1m (Figure 10). It was installed between the months of April and May in the year 2010 on an area of about 500 m2 located within the campus of the University of Yaounde I. Monotoring tools: A roll of nylon wire, posts (bamboo) to identify forties, a measuring tape (0001m near) and an ichtyometer (nearly 0001m) to measure the sizes of fish and a portable electronic balance HX-T (0.01g) for weight measurements . The standard method for the examination of water and waste water (APHA, 1985) was followed for the analysis of all physical and chemical water parameters such as pH, dissolved oxygen, water temperature, turbidity, nitrate, and phosphate. These were measured using a thermometer, a pH meter (Schott Geräte CG818), an oxymeter (Schott Geräte HQ30d), a SECCHI disc (30cm diameter) and a spectrophotometer. Experimental treatments During the experimental season (between June and November 2013), 5 ponds were used (Ponds 1, 2, 3, 4 and 5). Pond 1 received P. purpureum (20kg/100 m2 ), pond 2 received 20kg/100m2 M. sapientum, pond 3 received 10kg/100m2 MS+10 kg/100m2 PP. Ponds 4 and Journal of Research in Biology (2015) 5(4): 1737-1754 1740 Nchoutndignigni et al., 2015 Table1: Physico-chemical characteristics of ponds recorded during the second cycle, from June to November 2013 Treatment PP MS PP+MS T0 T1 Pond Pond 1 Pond 2 Pond 3 Pond 4 Pond 5 pH 07.030±00.50 07.13±00.40 06.80±00.30 06.90±0.30 07.02±0.30 Water temperature (°C) 23.500±00.20 23.60±01.45 24.50±00.90 23.20±1.10 25.70±0.80 Dissolved oxygen (mg/l) 04.430±01.00 03.80±01.60 06.20±00.50 03.60±1.00 03.50±1.40 SS (mg/l) 23.300±09.20 17.50±05.05 0028±02.90 43.50±4.20 08.60±1.03 Turbidity (UTN) 48.800±15.10 0076±12.80 54.30±11.70 47.90±7.60 20.60±0.80 Nitrate (mg/l) 00.580±00.20 00.23±00.30 00.07±00.08 00.07±0.08 00.20±0.40 Phosphate (mg/l) 00.440±00.08 00.42±00.07 00.35±00.30 00.39±0.20 00.30±0.03 Note: SS: Suspended Solids; pH: potential of hydrogen. (Mean ± SEM); PP: Pennisetum purpureum, MS : Musa sapientum, T1 : positive control, T0 : negative control. Treatment PP MS PP+MS T0 T1 (Droppings) Pond Pond 1 Pond 2 Pond 3 Pond 4 Pond 5 Law (g) 02,60±00.6 02,6±00.40 20.8±00.30 02.70±00.70 02.60±,04.00 Faw(g) 43.85±0028 35,5±22.40 59.5±39.20 24.93±16.80 50.23±33.70 Ias (cm) 05.20±00.2 04,6±00.50 40.8±00.40 05.10±00.30 04.60±00.50 Fas (cm) 17.00±03.2 14,5±02.80 22.5±05.40 13.00±02.20 22.00±05.40 Dg (g/j) 00.20±00.1 00,1±00.01 00.3±00.02 00.10±00.01 00.20±00.02 Survival (%) 60.00±01.1 67.0±01.20 98.0±02.60 70.00±01.60 97.00±02.30 Table 2: Zootechnical performance of different ponds Oreochromis niloticus fed three diets during 180 days of experimentation the second cycle. The results are expressed as: Mean ± SEM. PP :Pennisetum purpureum, MS : Musa sapientum, T1 : positive control, T0 : negative control; Dg: Daily growth; Faw: Final average weight; Fas: Final average size. Iaw: Initial average weight; Ias: Initial average size The heterogeneity between the average weight is not significant at 5%.
- 4. 5 are control ponds. One (pond 4) is a negative control, which received no treatment while the pond 5 is a positive control that received 20kg/100m2 of chicken manure. The salary adjustments were made every fifteen (15) days after sampling. The algal ponds with a boom (greenish color) this implies a nutrient rich environment and can be effective empoisoning. Sampling of water In situ measurements The physico-chemical parameters such as temperature, transparency, pH, respectively were measured in situ by means of a mercury thermometer, a Secchi disk (diameter = 30cm), and a portable pH meter (Shott CG818). Laboratory measurements In the laboratory, solids suspensions, color and turbidity were evaluated by spectrophotometry (HACH DR/2010) using techniques given in APHA (1985); Dissolved oxygen was measured using a pulse oximeter (Schott Geräte HQ30d). These parameters were monitored regularly every two weeks from 8:am-9:am . Fish sampling Every 15 days around 8:am-9:am , fish samples were made after partial emptying of ponds. The capture of 30 individuals per pond is made randomly with replacement. It was made using a fishing net (10m long and 1m wide), a dip net with fine mesh for fry and / or gillnet (14/10m) and a trap for adult stages. Catch weight 1741 Journal of Research in Biology (2015) 5(4): 1737-1754 Fig.1. Evolution of potential hydrogen from water ponds during different cycle testing between June and November 2013 Nchoutndignigni et al., 2015
- 5. and size were taken at each sampling. At the beginning of the experiment, the biomass of fishes in each area was determined to the nearest gram. At the end of the trial, all fishes from each farm structure was counted and weighed together to the nearest gram. Statistical analysis: Final mean weight (g), survival (%), daily growth (g/d) were computed. Data were subjected to an analysis of variance and Duncan multiple-range test was used to evaluate specifies differences between treatments (significance level: 0.05). RESULTS AND DISCUSSION Monitoring of water quality in the framework of this study is illustrated by taking some abiotic parameters (Table 1). At the end of the cycle (180 days), the pH ranged from 6.8 to 7.13. When the temperature range is from 23.5°C to 25.7°C, the variation of the oxygen level is between 3.6 to 6.2 mg/l, disturbance of water bodies is illustrated by the presence of suspended solids with a variation of 8.6 to 43.5 mg/l, nitrate concentration is low in the five area (0.07-0.58mg/l) and phosphorus (0.3-0.4 mg/l). Journal of Research in Biology (2015) 5(4): 1737-1754 1742 Nchoutndignigni et al., 2015 Fig.2. Evolution of the temperature of the water in different ponds during cycle testing between June and November 2013.
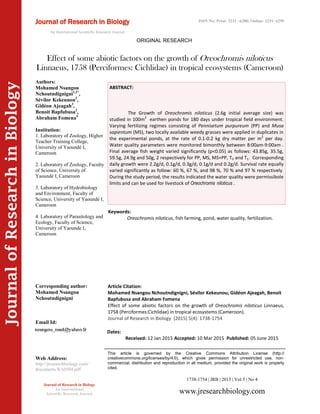
- 6. Physical variables Hydrogen Potential (pH) The pH of the water depends on the diffusion of carbon dioxide from the atmosphere, the balance of respiratory and photosynthetic metabolism and the origin of the water (Hutchinson, 1987). The geological nature of the medium traversed, discharges wastewater (Dussart, 1966) . It is inseparable from the temperature values(Nisbet and Verneau, 1970) and it has been demonstrated that the mineralization of the organic material causes a drop in pH (Goterman, 1995). It has a direct effect on the availability of metal ions in the marine environment and therefore the rate of accumulation by organisms while changing the shape of the metal and acting on the physiology of organisms (Bryan, 1979). The pH of pond water recorded during the study period was 6.1 in Pond 1 (for October 2013) and 7.6 in the same pond during the month of November 2013. This small variation is due to the buffering effect of bicarbonate ions, clearly indicating the potability of 1743 Journal of Research in Biology (2015) 5(4): 1737-1754 Nchoutndignigni et al., 2015 Fig.3. Concentration of Dissolved Oxygen water ponds during different cycle testing between June and November 2013.
- 7. water (Fig.1). However, as shown in Figure 2, the curve of the spatio-temporal variation of pH for five ponds is highly variable and does not follow a regular law. pH values found in different ponds studied during our cycle do not present a danger to Oreochromis niloticus. These changes are not easy to interpret because they are the result of great physical and biological difficult to highlight number. The pH ranges that are directly lethal to fish are those located below 5mg/1 (Bremond and Perrodon, 1979). The water temperature (T°) The water temperature is between 20°C and 26°C in the pond 1, between 22 and 25.5°C in the pond 2, between 23.5°C and 25°C in the pond 3, between 22 and Journal of Research in Biology (2015) 5(4): 1737-1754 1744 Nchoutndignigni et al., 2015 Fig.4. Evolution of suspended solids (SS) in water of different ponds during cycle testing between June and November 2013
- 8. 25°C in the pond 4, and between 24°C and 25°C in 5 ponds. From these values the minimum value is 20°C while the maximum value is of the order of 26°C. Observed characteristics are also strongly influenced by factors specific to the site or the pond. In these conditions, it’s difficult to know whether the differences are due to special events or seasonal variations. However, if there is a significant seasonal variation, it must affect all ponds, or at least the majority, regardless of site-specific characteristics. This is actually what we see observe in Fig. 2. Five ponds have large amplitude between August, September and November because these periods mark the sunshine in our site. However, we record low values between the months of June and July since rain contributes to the decrease in water temperature. These changes are consistent with the observed values in other water bodies (Levêque, 1988) values. Temperature values observed during the experiment are very favorable for the production of Oreochromis niloticus (Kestemont et al, 1989). Dissolved oxygen (DO) In our five ponds, the dissolved oxygen content is between 2.6 and 6.5 mg/l in pond 1, between 2 and 6mg/l in pond 2, between 5 and 7mg/l in pond 3 between 3 and 5.6mg/l in pond 4, and between 2.4 and 5.8 mg/l in pond 5 (Fig. 3). From these values we use a variation of 1745 Journal of Research in Biology (2015) 5(4): 1737-1754 Nchoutndignigni et al., 2015 Fig.5. Evolution of the turbidity of different ponds during cycle testing between June and November 2013.
- 9. the concentration of dissolved oxygen between 2mg/1 and 7mg/l. The evolution of the concentration of dissolved oxygen is a function of the climate. However, from mid-September till October, the amplitude is exponential in most ponds, as the oxygen content increases with the rain. It is important to note that its amplitude is large with the decrease in turbidity and is less important also with higher suspended solids. Between 2 and 3 mg/l dissolved oxygen Oreochromis niloticus presents no particular metabolic problems. Different levels of dissolved oxygen are favorable to the development of Oreochromis niloticus, but they stop eating less than 1.5mg/l and die after a long exposure (Balarin et al., 1979). Coche (1982) reports that at a temperature of 26-30°C, special measures need to be considered, if the concentration of O2 on the surface of the water falls below 3 mg/l for several days. He advises a reduction or even a complete stop feeding and decreased storage density with and a maximum spacing of cages (several meters from each other). Suspended Solids (SS) Ponds subject to our study, located in a swampy area in relation to the relatively low erosive potential of the basin, the waters are loaded with suspended solids. The low load (14.5 mg/l) exceptionally recorded in November 2013 (Fig. 4) is probably the result of a cessation of rains, the suspended solids show a great difference between the values recorded. The high Journal of Research in Biology (2015) 5(4): 1737-1754 1746 Nchoutndignigni et al., 2015 Fig. 6. Phosphorus water ponds during different cycle testing between June and November 2013.
- 10. amplitude recorded (45 mg/l) in the month of June 2013 is linked to very large seasonal variations and also the tidal dynamics. The average increase of the suspended solids can be attributed to sudden rainstorms. Other authors have shown that the fluctuation of the suspended solids is mainly due to contributions from the major collectors of the city. In addition, agents such as dynamic -tidal currents, also contribute to the increase in the content of suspended solids by suspension of the thin layer of sediment (Kaimoussi, 2002). In the case of our study, the mean values of TSS are relatively low and the evolution follows a normal distribution. Turbidity The turbidity is reduces transparency due to the presence of undissolved solids suspended in water. In this study, we observed a change in the value of the turbidity in the different pools (Fig. 5). It varies between 25 and 70 UTN in pond 1, between 60 and 70 UTN in the pond 2, between 37 and 66 UTN in the pond 3, between 38 and 55 UTN in the pond 3, and between 20 and 22 UTN in pond 5. However, it is noticeable that these values are recorded relating to climate change. The turbidity of the water in the pond 1 is of high amplitude during the month of June 2013, because of regular rainfall. It falls 1747 Journal of Research in Biology (2015) 5(4): 1737-3754 Nchoutndignigni et al., 2015 Fig. 7. Evolution of the concentration of nitrate in water from different ponds during cycle testing between June and November 2013.
- 11. in September and will go up in October. Turbidity, if appropriate with increased rainfall. This variation is the same in all ponds. It is essential to note that the turbidity is correlated with solids suspensions. The results of Dagaonkar and Saksena (1992) and Garg et al (2006b) also reported high turbidity during rainy season. Silt, clay and other suspended particles contribute to the turbidity values, while during winter and settlement of silt, clay results low turbidity during the summer season. Nevertheless, it is essential to note that the turbidity correlates with solids suspensions and may be related to fertilization (Dabbadie, 1996). Chemical variables Phosphate Phosphate is an essential component of the organic matter and it’s important nutrient for living organisms. However it must be considered as a pollutant, when present at high concentrations in the environment. At the end of our study, the concentration of phosphorus in ponds 1 and 2 is between 0.3 and 0.5 mg/l; between 0 and 1mg/l in pond 3 between 0.1 and 0.6mg/l, for ponds and between 0 and 1mg/l for the pond 5(Fig. 6). This finding is agreement with that of Udaipur lakes (Ranu, 2001, Chisty 2002). Concentrations in water around 0.5 mg/l is a pollution index (Rodier et al.,1996). According to the values, the water bodies are indications of pollution. Release of phosphate in aquatic ecosystems are one of the most serious environmental problems because, they help to accelerate the eutrophication of these environments. Nitrate (NO3 - ) Nitrates represent the final stage of the oxidation of nitrogen. Their presence in water is a evidence of a good recovery from organic pollution. Human activity is certain when concentrations exceeding 12 mg/l (Perrodon and Bremond, 1979). Nitrates come primarily from runoff in the watershed (nitrogen fertilizers). Nitrate can also come from domestic sewage and industrial wastewater. The evolution of nitrates is dominated by two large seasonal variations in August 2013 and November 2013. At ponds, this depletion of the areal concentration of nitrates is due to measures taken in the security system of the dam safety present between the rivers (Olezoa) and experimental ponds. We can say that, the traces exist in ponds resulting from agricultural practices located around the study site whereas lateral inflows of nitrate leaches from agricultural land very busy this element are not overlooked . Furthermore, the results reveal low intake of nitrates between 0 and 1 mg/ l. The longitudinal profiles of the ions have the same shape for all pools as shown in Figure 7. Other authors found that nitrates can reach values higher values (24 mg/l), there by suggesting the presence of organic matter Journal of Research in Biology (2015) 5(4): 1737-1754 1748 Nchoutndignigni et al., 2015 Fig. 8. Evolution of the average body weight of Oreochromis niloticus with different experimental diets (PP, MS, MS+PP, T1, T0) Fig.9. Evolution of the average body length of Oreochromis niloticus with different experimental diets (PP, MS, MS+PP, T1, T0)
- 12. (Mergaoui et al., 2003). Gassama and Violette (2002) explained the increase of nitrate by the input of nitrogen fertilizers. Zootechnical parameters and indices calculated The test foods were accepted by the fish. In each pond fertilized with a particular food, the values of growth performance such as the average final weight varied between 24.93g ± 16.8g and 59.5g ± 39g (Fig.8). The size changes with a final average variability between 13cm ± 2.2cm and 22.5cm ± 5.4cm (Fig. 9). The daily growth for when it is 0.1g/d ± 0.3 to 0.01g/d ± 0.02, and the survival rate between 60% ±1.01 and 98% ± 2.6 are recorded in Table 2. These observations show that these areas are more environmentally friendly for farming Oreochromis niloticus. By cons, in the pond 2 and 4, growth remained low (0.1g/l). This low rate is partly due to the chemical composition of the food eaten at the pond 2, which could cause a decline in their growth (Moriarty, 1973). Moreover, this low growth rate is related to the average biomass (35.5 and 24.93g in ponds 2 and 4) respectively observed at the end of cycle. As a first approximation we can therefore suggest that the food ingested by the fish takes the full responsibility. These results are similar to observations made by Kaushik et al. (1995) and could be likened to the physiological adaptations exhibited by herbivorous 1749 Journal of Research in Biology (2015) 5(4): 1737-1754 Nchoutndignigni et al., 2015 Fig.10.Experimental device 14 3 Pond 4 with NtPond 3 with Ms+Pp 14 3 14 3 Pond 1 with Pp Pond 2 with Ms c 14 3 5 2 22 2 3 14 2 Pond 5 with Cm Legend. (1) Entry of water; (2) Water outlet; (3) Plate of the pond; (4): Composter; (5) Basin water retention; Pp: Pennisetum purpureum; Ms Musa sapientum; Cm: Chicken manure; Nt: No treatment
- 13. fish, allowing them to optimize the quality of their food in low food availability (Melard, 1986). These results are also related to the low stocking densities and applied to environmental conditions, especially temperature and oxygen that appear to be conducive to efficient use of available food. Similar observations described in the natural environment, such as Chano lake in Ethiopia (Getachew , 1993) confirm the lower trophic requirement Oreochromis niloticus and its ability to take advantage of food sources of varying quality. Journal of Research in Biology (2015) 5(4): 1737-1754 1750 Nchoutndignigni et al., 2015 Fig.11. Localization of the study site
- 14. CONCLUSION This study allowed us to obtain the optinal parameters for the successful growth of oreochromis niloticus: (1)pH (6.8 to 7.13), the temperature (23.2 to 25.7 °C), dissolved oxygen (4.43 to 6.2mg/l), turbidity (20.6 to 76 NTU) and TSS (8.6 to 43.5g/l), Nitrates (0.07 to 0.5mg / l) and phosphates (0.3 to 0.4mg/l). (2) The production parameters for growth performance of Oreochromis niloticus are 43g, 35.5g, 59.5g, 24.93g and 50.23g with 60 %, 67 %, 98 % and 70 % and 97 % respectively is 1,2,3,4 and 5 ponds. This study shows that pond 3 revealed the best performance. This work, although carried to completion, is far from having been without difficulties . Pond fertilization and water quality have a capital interest in the development of freshwater fish. This work has undeniably, like any human endeavor, weaknesses, imperfections and limitations . In addition, it is necessary to improve the appearance of fertilizing ponds with other forages. Future work will bring an improvement to fish yields to better exploit for exploiting the food self-sufficiency. ACKNOWLEDGMENTS The authors wish to thank Mr. DOUNIA, teacher at the Higher Teacher Training College of Yaounde, Laboratory of Zoology for his practical advice in the analysis of the results of this work. We also thank the Master and PhD students in the laboratory of Hydrobiology environment who participated in the sampling sessions as a part of our research work. REFERENCES APHA. 1985. Standard methods for the examination of water and waste-water. APHA-AWWAWPCF (ed). Pensylvanie, Washington, 1150p. Bazairi H, Gam M, Kalloul S and Zourarah B. 2005. Caractérisation bio-géologique des habitats benthiques d’un écosystème côtier de l’Atlantique marocain : l’estuaire du bas Loukkos, 3ème journée internationale des géosciences de l’environnement, El Jadida 8−9−10 juin. Balarin JD. and Hatton JP. 1979. Tilapias: A guide to their biology and culture in Africa, University of stirling, 174p. Brummett RE, Jamu D, Jere J and Pouomogne V. 2004. A farmer participatoory approach to aquaculture 1751 Journal of Research in Biology (2015) 5(4): 1737-1754 Nchoutndignigni et al., 2015 Fig.12. Experimental ponds Legend. (A): Water outlet; (B): Dike; (C): Composter
- 15. technology development and dissémination. Uganda Journal of Agricultural Sciences 9, 530-536. Bremond R and Perrodon C. 1979. Paramètres de la qualité des eaux. Ministère de l’environnement et cadre de vie. 2ème éditions, 259 p. Bryan GW. 1979. Bioaccumulation of marine pollutants. Phil. Trans. Re. Soc. Lond. B. Biol Sci, 286 (1015), 483-505. Cheggour M, Chafik A, Fisher NS and Benbrahim S. 2005. Metal concentrations in sediments and clams in four Moroccan estuaries. Marine Environmental Research, 59: 119-137. Chishty N. 2002. Studies on biodiversity of freshwater zooplankton in relation to toxicity of selected heavymetals. Ph.D. Thesis, M.L. Sukhadia University, Udaipur. Coche AG. 1982. Cage culture of tilapias. In: Biology and culture of tilapias. Pullin R.S.V. and Lowe- McConnell R.H. (Eds). ICLARM, Philippines, 205-246. Dagaonkar A and Saksena DN. 1992. Physico- chemical and Biological characterization of temple tank, Kaila Sagar, Gwalior, Madhya Pradesh. J. Hydrobiol, 8 (1), pp 11-19. Damotharan P, Vengadesh Perumal N and Arumugam M. 2010. Seasonal variation of physico– chemical Characteristics in Point Calimere Coastal Waters (South East Coast of India). Middle East Journal of Scientific Research, 6(4): 333- 339. Dussart B. 1966. Limnologie. L’étude des eaux continentales. Gauthier-Villars Ed., 667 pp. EL Morhit Mohammed. 2009. Hydrochimie, éléments traces métalliques et indices Ecotoxicologiques sur les différentes composantes d’un écosystèmes estuarien (bas loukkos). Thèse de doctorat, Université Mohammed V- AGDAL (Maroc), 190p. El Morhit M, EL Abidi A, Serghini A, Yahyaoui A et Jbilou M and Fekhaoui M. 2008. Contamination métallique de Sardina pilchardus de la côte atlantique marocaine et des sédiments de l’estuaire du bas Loukkos. Biodiversité et Ecosystèmes. Vèmes Journées Nationales de Biodiversité Sur Biodiversité au service du développement durable, 18 au 20 décembre 2008, Fès- Maroc. Ekodeck GE. 1984. L’altération des roches métamorphiques du Sud-Cameroun et ses aspects géotechniques. Thèse de doctorat d’Etat, Université de Grenoble I, 368p. Eno Belinga SM and Kabeyene Beyala. 1982. Géologie dynamique des paysages de fer de la ville de Yaoundé, secteur Nord. Annales Faculté des Sciences 51 -56. FAO. 2006. State of world aquaculture. FAO. Fisheries technical paper 500, 128 p. FAO. 2010. Report of the FAO Workshop on Child Labour in Fisheries and Aquaculture in cooperation with ILO, Rome, 14–16 April 2010. FAO, Rapport sur les pêches et l’aquaculture No 944. Rome, 24 p. FAO. 2012. La situation mondiale des pêches et de l’aquaculture 2010. Rome, 224p. Fekhaoui M. 2005. Projet Gestion intégrée du complexe de Zones Humides du Bas Loukkos (Larache, Maroc) Phase du Diagnostic. Hydrologie. Projet financé par la fondation Ciconia, Lichtenstein et géré par le GREPOM, 40p. Foto Menbohan S and Njine T. 1998. Distribution et dynamique des populations des ciliés dans deux cours d’eau urbains : l’Abiergué et le Mfoundi à Yaoundé, Ann. Fac. Sci.,Univ. Yaoundé I, série Sci. Nat. Et vie, 34 (2): 269-279. Journal of Research in Biology (2015) 5(4): 1737-1754 1752 Nchoutndignigni et al., 2015
- 16. Foto Menbohan S. 1989. Etude de la pollution de deux cours d’eau à Yaoundé : l’Abiergué et le Mfoundi : études physico-chimique et biologique. Thèse Doctorat 3ème cycle, Université de Yaoundé, Cameroun, 142p. MinEPIA (Ministère de l’Elevage des Pêches et des Industries Animales), 2014. (Rapport d’activités, exercice 2012. Pages 119. 137 pages. Garg RK, Saksena DN, Rao RJ. 2006b. Assessment of physic-chemical water quality of Harsi Reservoir, district Gwalior, Madhya Pradesh, Journal of Ecophysiology and Occupational Health, 6, pp 33-40. Gassama N and Violette S. 2002. Contributions à l’étude hydro-géochimique du bassin versant de Kaluvelly, Sud-Est de l’Inde, DEA Hydrologie, Hydrogéologie, Géostatistique et Géochimie Filière Hydrologie et Hydrogéologie Quantitatives. Université Pierre et Marie Curie, Université Paris-Sud, École des Mines de Paris & École Nationale du Génie Rural des Eaux et des Forêts, 34 p. Getachew Teferra. 1993. The composition and Nutritional status of the diet of Oreochromis niloticus in Lake Chamo, Ethiopia. Journal of Fish Biology 42:865- 874. Goterman HL. 1995. Toxico cinétique de trois polluants métalliques majeurs chez la truite arc-en-ciel (Salmo gairdneri), le chrome, le cuivre et le zinc ». Thèse de 3ème cycle Univ. De Claude Bernard, Lyon, 125 p. Hutchinson TC, and Meema KM. 1987. Lead, mercury and arsenic in the environment. SCOPE 31. Chichester, John Wiley and Sons, 360 p. Kaimoussi A. 2002. Etude de la pollution au niveau du littoral de la région d’El Jadida. Thèse de Doctorat d’Etat Es Science physiques. Univ. Chouaib Doukkali, Fac. Sc. El Jadida, 72–73 p. Levêque C. 1988. « Biologie et écologie des poissons d'eau douce africains ». Coll. Trav. et Doc., Ed. Oostom, Paris, France 216, 508 p. Mergaoui L. 2003. Diagnostic d’un état de pollution organique et métallique de deux zones humides : cas de Merja Zerga et de bas Sebou. Thèse de Doctorat en biologie. Université Mohammed Ben Abdellah Faculté des Sciences Dhar-Mehraz Fès, 74 p. Kaushik SJ, Doudet T, Medale F, Aguirre P and Blanc D. 1995. Protein and energy needs for maintenance and growth of Nile tilapia (Oreochromis niloticus). J. Appl. Ichthyol., 11(3-4), 290-296. Kestemont P Micha JC and Falte U. 1989. Les méthodes de production d’alevins de Tilapia nilotica. Programme de mise en valeur et de coordination de l’Aquaculture. Programme des Nations Unies pour le Développement. ADCP/REP/89/46 FAO, 131p. Melard C. 1986. Les bases biologiques de l’élevage intensif du tilapia du Nil. Cahiers d’étiologie appliquée, 6, 224p. Mergaoui L. 2003. Diagnostic d’un état de pollution organique et métallique de deux zones humides : cas de Merja Zerga et de bas Sebou. Thèse de Doctorat en biologie. Université Mohammed Ben Abdellah Faculté des Sciences Dhar-Mehraz Fès 74 p. Nathanël H and Jolly CM. 1998. Evaluation of small- scale aquaculture with intra-rural household trade as an alternative enterprise for limited resource farmers: the case of Rwanda. Nisbet M and Verneaux. 1970. Composantes chimiques des eaux courantes. Ann. Limnol. T 6 Fasc., 2, 161–190. Prasana MB and Ranjan PC. 2010. Physico-Chemical Properties of Water collected from Dhamra Estuary, International Journal of Environmental Science, 1(3), 334-342. 1753 Journal of Research in Biology (2015) 5(4): 1737-1754 Nchoutndignigni et al., 2015
- 17. Ranu. 2001. Studies on toxicity of textile effluents to freshwater zooplankton. Ph.D. Thesis, M.L. Sukhadia University, Udaipur (Raj.). Rodier J. 1996. L'analyse de l'eau naturelle, eaux résiduaires, eau de mer, 8ème Edition, Dénod, Paris, 1383 p. Sanchoir C. 1995. La pédologie In : Sanchoir C et Bopda A, (coord.), Atlas régional, Sud Cameroun. ORSTOM et MINREST, 55p. Savory J and Wills MR. 1991. Aluminum. In: Merian E., (ed.) metals and their compounds in the environment. Occurrence, analysis and biological relevance. VCH Weinheim New York-Basel-Cambridge. Snoussi M. 1984. Comportement du Pb, Zn, Ni et Cu dans les sédiments de plateau continental (côte Atlantique l’estuaire de Loukkos et du proche marocaine). Bulletin de l’Institut +géologique du bassin d’aquitaine, 35 : 23-30. Srivastara RC. 2009. Today and tomorrow’s printers and publishers New Dehli, India. Fish Mycopathology, p: 103. Suchel B. 1987. Les climats du Cameroun. Thèse de Doctorat d’Etat, Université de Bordeaux III, 1186P. Venkatesharaju K, Ravikumar P, Somashekar RK and Prakash KC. 2010. Physico-chemiscal and Bacteriological Investigation on the river cauvery of kollegal stretch in karnataka, J. Sci Engineering and technology, 6(1), 50-59. Yongué Fouateu R. 1986. Contribution à l’étude pétrographique de l’altération et des faciès de cuirassement ferrugineux des gneiss migmatiques de la région de Yaoundé. Thèse de Doctorat de 3e cycle. Université de Yaoundé, 214 p. Journal of Research in Biology (2015) 5(4): 1737-1754 1754 Nchoutndignigni et al., 2015 Submit your articles online at www.jresearchbiology.com Advantages Easy online submission Complete Peer review Affordable Charges Quick processing Extensive indexing You retain your copyright submit@jresearchbiology.com www.jresearchbiology.com/Submit.php