SlideShare a Scribd company logo
1 of 15
Download to read offline
Joe Egan
Professor Wolf
MET 481
April 9, 2016
Mesoscale Case Study: 5-9 December 2010 Lake Effect Snow
From 5-9 December 2010, much of northeast Ohio and northwest Pennsylvania were
impacted by a widespread, intense lake effect snow event. After a fairly mild and benign
November with relatively little snowfall throughout the region, this event was the result of a
dramatic pattern change. A closed 500-hPa low became cut-off from the mean westerly flow and
stalled over Quebec and Ontario (Figure 1). Northwesterly flow through a deep layer of the
atmosphere over the relatively warm water of the Great Lakes resulted in a long-lived lake effect
snow event in the lee of all five lakes. The deep-layer northwest flow and substantial lake-
induced instability can be seen on the DTX sounding from 00Z on 6 December 2010 (Figure 2).
The focus of this case study will be on the portion of the event that impacted northeast Ohio and
northwest Pennsylvania.
The snow began in northeast Ohio shortly after 00Z on 5 December 2016 following the
passage of a weak area of low pressure to the south of the region. The associated trough could be
seen on the surface analysis for that time (not shown); following its passage through northern
Ohio, winds veered to a northwest-southeast trajectory over a deep layer across the Great Lakes.
Of particular importance during this event was the northwest flow that extended horizontally as
far north and west as western Lake Superior, particularly at 850 hPa (Figure 3). As a result,
moisture from Lake Michigan and Superior was contributing to the lake effect snow bands in the
lee of Lake Erie due to the favorable fetch. Snowfall in extreme northeast Ohio and northwest
Pennsylvania was also enhanced by Lake Huron moisture. Evidence of these connections can be
seen on the radar mosaic from 14Z on 5 December 2016 (Figure 4). Moisture was also more than
sufficient, as indicated by the aforementioned sounding and 850-hPa plot. The average water
temperature for Lake Erie throughout the event was around 7-8°C while 850-hPa temperature
hovered around -12 to -16°C, resulting in surface-850 hPa delta-T’s of 20°C or greater and
ample lake-induced instability (NOAA/GLERL, 2010). Wind speeds were also strong enough in
the low-levels to translate the bands well inland, but not too strong to tear the bands apart or
prevent them from organizing (Figure 5). Frictional convergence and orographic lift enhanced
the intensity of the snowfall due to the topography of northeast Ohio and northwest
Pennsylvania, which slopes gently upward from around 600 feet MSL in downtown Cleveland to
over 1200 feet in the hills south and east of Cleveland and to over 1700 feet in the hills east of
Meadville, PA (TopoCreator, 2009).
As is the case with almost all multi-day lake effect snow events, heavy snow did not fall
continuously throughout the five-day duration of the event. Rather, the snow bands periodically
increased and decreased in intensity while migrating at times due to the passage of surface
troughs that caused subtle shifts in the low-level flow. One of the peaks in snowfall intensity for
locations east of Cleveland came on the night of 5-6 December 2010. The surface analysis and
radar mosaic for 04Z on 6 December clearly depict that the heaviest snow was focused into a
narrow but elongated band from the lakeshore southeastward into Youngstown (Figures 6 and 7).
Orographic lift enhanced this band considerably since it stretched from the lakeshore into the
highest hills of Geauga County. After a few more oscillations in intensity, the event reached its
final peak during the afternoon and evening of 8 December 2010. The 12Z DTX sounding on
that day (Figure 8) continued to depict deep-layer northwest flow, though the direction had
veered slightly more west of north. As a result, the bulk of the intense activity was focused into
locations from downtown Cleveland eastward. The one factor that particularly enhanced the
snowfall in this area was a narrow convergence zone that developed along the length of the
lakeshore, as depicted on the 20Z surface analysis for the day (Figure 9). This convergence
combined with the aforementioned parameters already in place set the stage for a very intense
snow band that dropped ten inches of new snow on downtown Cleveland during the peak of the
evening rush hour (Figure 10). The event wrapped up by 00Z on 10 December as 500-hPa
ridging moved into the region causing the flow to shift to southwesterly, advecting warmer air
into northeast Ohio (Figure 11). Figure 12 displays the snowfall distribution throughout the area;
the heaviest amounts in Ohio (eighteen to twenty-four inches) fell across the higher terrain of
Geauga County. Some locations in Crawford County, Pennsylvania saw even higher amounts,
with up to four feet of snow in the northeast part of the county.
Figure 1: 500-hPa heights (dm) and absolute vorticity (*10^-5 s^-1) valid at 00Z on 6 April
2010. The closed upper-level low over Quebec and Ontario would move very little over the next
4 days because it was cut-off from the mean westerly flow. Meanwhile, the omega block over the
Rockies kept any upstream trough from kicking the closed low eastward. This maintained a cold,
northwesterly flow through a deep layer over the Great Lakes throughout the 4-day period,
resulting in a pro-longed lake effect snow event for all five Great Lakes. Image courtesy of
MMM/UCAR.
Figure 2: Skew-T plot of KDTX sounding from 00Z on 6 December 2010. The deep
northwesterly flow is clearly depicted at right, which is a favorable fetch for lake effect snow in
the lee of Lake Erie. Speed shear was fairly low (aside from the surface-900 mb layer) which
allowed parcels to have ample residence time over the lake to become unstable. Steep low-level
lapse rates indicated sufficient lake-induced instability. The inversion above 800 mb was notable,
but was likely not enough to limit snow growth and likely was overcome by the warm waters of
Lake Erie. Most of the dendritic growth zone (DGZ) was sufficiently moist and unstable
allowing for efficient snow production and locally intense snowfall rates. Image Courtesy:
University of Wyoming
Figure 3: 850-hPa composite plot from 00Z on 6 December 2010. Northwesterly flow can be
implied from Minnesota southeastward to the shores of Lake Erie (area outlined in black). This is
a particularly favorable fetch for significant lake effect snow in the lee of Lake Erie because
moisture from Lakes Superior and Michigan contribute to the snow bands in addition to moisture
from Lake Erie itself. Since the upper-level low was stalled over Quebec, this pattern did not
change much over the following four days. The strength of the 850-hPa winds (plotted in knots)
allowed the snow bands to translate rather far inland into northeast Ohio and northwest
Pennsylvania. Image courtesy: Plymouth State Weather Center.
Figure 4: Radar mosaic at around 14Z on 5 December 2010. Area outlined in yellow represents
the general region affected by lake effect snow bands at the time. The lake effect snow bands had
initiated off of all five Great Lakes by this time. The snow was aligned in multiple wind parallel
bands, as is typical with deep-layer northwest flow due to the lack of a single focused axis of
convergence. The bands have an unusually long inland extent due to the strong 850-hPa winds.
Inter-lake connections are also evident as the bands off of Lake Erie were being fed by moisture
from upstream lakes. Image Courtesy: MMM/UCAR
Figure 5: Surface composite plot from 14Z on 5 December 2010. The snow observations match
up with the radar reflectivity in Figure 4 (area outlined in red). The relatively weak surface winds
(around 10 knots throughout northern Ohio) allowed the bands to have sufficient residence time
over the warm waters of the lakes. The winds were strong enough to promote frictional
convergence along the shoreline to enhance the snowfall for downstream locations. Image
Courtesy: Plymouth State Weather Center
Figure 6: Surface composite plot for 04Z on 6 December 2010, around the time of the first peak
in snowfall intensity; moderate snow was reported at KAKR. One key factor that contributed to
the uptick in snowfall intensity around this time was the development of a subtle axis of
convergence (outlined in red). This convergence combined with the orographic lift provided by
the higher terrain south and east of Cleveland (symbolized by the star) enhanced the snowfall in
this region. The surface winds had also increased since the time of Figure 5, which allowed the
bands to extend even further inland, as a far southeast at Pittsburgh.
Figure 7: Radar mosaic from around 04Z on 6 December 2010. The lake effect bands were
much narrower at this time than in Figure 4, but were also locally more intense. The most intense
band off of Lake Erie is outlined in yellow, along with its connection to Lakes Michigan and
Superior. This band was being fed by moisture from upstream lakes, which likely combined with
the other mesoscale influences discussed in Figure 6 to result in locally heavy snowfall in
northeast Ohio. The inland extent of this band is also clearly depicted, as well that of other bands
off of Lake Erie and other lakes. Image Courtesy: MMM/UCAR
Figure 8: Skew-T plot of KDTX sounding from 12Z on 8 December 2010. Compared to Figure
2, the winds are backed slightly and more speed shear is evident (especially in the 800-400 mb
layer, outlined in red). The shear combined with the mid-level dry air in the 750-500 mb layer
resulted in a relative minimum in snow band organization and intensity. However, low-level
lapse rates remained nearly dry adiabatic. As a result, a later uptick in band organization and
intensity occurred downstream of the sounding site that afternoon following the passage of a
surface trough. The subtle wind shift to a more west-northwest origin shifted the bands
northward, as can be seen in Figure 10. The stout inversion above 800 mb was again likely
overcome over the lake.
Figure 9: Surface composite plot for 20Z on 8 December 2010. The axis of convergence (within
the area outlined in red) can be implied by the converging wind barbs in northern Ohio, southeast
Lower Michigan and far southern Ontario. This convergence enhanced the snowfall intensity
from downtown Cleveland (represented by the star) eastward. The more westerly component of
the wind can also be seen. This directed the bulk of the more persistent bands into a zone
oriented west to east from Cleveland to northwest Pennsylvania into western New York, though
the enhanced convergence focused the heaviest snow in a narrow band from Cleveland through
the eastern suburbs. See Figure 10 for a radar mosaic at the same time.
Figure 10: Radar mosaic from around 20Z on 8 December 2010. While the lake effect snow was
winding down off of the Western Great Lakes, the activity in the lee of Lake Erie was focused
into two particularly intense bands (outlined in yellow). These lie within the axis of convergence
outlined in Figure 9 and their intensities were likely enhanced by this as well as orographic lift
from the hills east of Cleveland. The larger of the two bands persisted over downtown Cleveland
into the evening rush hour, resulting in extremely hazardous driving conditions. Image Courtesy:
MMM/UCAR.
Figure 11: Same as Figure 1 except at 00Z on 10 December 2010. The pattern became more
progressive by this time as a “kicker” trough finally arrived to break down the omega block in
the Western United States. This allowed the ridge ( represented by the heavy dashed black line;
in a weakened state compared with that of Figure 1) to progress eastward into the Great Lakes to
veer winds around to the west-southwest, resulting in warm air advection that effectively ended
the lake effect snow. Image courtesy: MMM/UCAR.
Figure 11: Map of storm total snow fall for the entire event for the NWS WFO Cleveland, OH
County Warning Area (CWA). The local maxima in Geauga County, OH as well as Crawford
County, PA (within the area outlined in black) were co-located with local peaks in elevation.
Orographic lift enhanced the snowfall rates in many locations within the black outlined area and
this map clearly shows the results. The effects were even more substantial in Crawford County,
PA, where the snow bands were more persistent, the orographic lift was most pronounced due to
the steeper hills, and additional moisture was added from Lake Huron. Image courtesy: NWS
Cleveland, OH
References
NCAR, 2014: Image Archive. Accessed 9 April 10, 2016. [Available online at
http://www2.mmm.ucar.edu/imagearchive/]
NOAA/GLERL, 2010: Great Lakes Statistics. Accessed 11 April 2016. [Available online at
http://coastwatch.glerl.noaa.gov/statistic/statistic.html]
NOAA/NWS Cleveland, 2010: Early December Heavy Lake Effect Snow. Accessed 9 April
2016. [Available online at http://www.weather.gov/cle/event_20101209_snow]
NOAA/NWS Cleveland, 2011: Notable Weather Events of 2010. Accessed 9 April 10, 2016.
[Available online at http://www.weather.gov/cle/event_2010_notable]
Plymouth State University, 2016: Make Your Own: Product Generator for Real-Time and
Archived Data. Accessed 7 April 2010. [Available online at
http://vortex.plymouth.edu/myo/]
TopoCreator, 2009: State Maps and Elevation Data. Acessed 11 April 2016. [Available online at
https://topocreator.com/ned-jpg/city_a/600/oh.jpg]
University of Wyoming, 2016: Atmospheric Soundings. Accessed 9 April 10, 2016. [Available
online at http://weather.uwyo.edu/upperair/sounding.html]

More Related Content

What's hot

20100418_Herman_Ridderinkhof_Getijden
20100418_Herman_Ridderinkhof_Getijden20100418_Herman_Ridderinkhof_Getijden
20100418_Herman_Ridderinkhof_Getijden
VPRO Beagle
 
Air masses ppt cscope
Air masses ppt cscopeAir masses ppt cscope
Air masses ppt cscope
Jenny Dixon
 
Final Presentation
Final PresentationFinal Presentation
Final Presentation
Ross Harris
 
Little ice age
Little ice ageLittle ice age
Little ice age
lukebudi
 
Notes - Air Masses, Fronts, Global Winds
Notes - Air Masses, Fronts, Global WindsNotes - Air Masses, Fronts, Global Winds
Notes - Air Masses, Fronts, Global Winds
Bantay's Oceanography
 
Phes ch20 Severe Weather
Phes ch20 Severe WeatherPhes ch20 Severe Weather
Phes ch20 Severe Weather
windyridge
 
115. Hydrospheric Effects on Climate Change
115. Hydrospheric Effects on Climate Change115. Hydrospheric Effects on Climate Change
115. Hydrospheric Effects on Climate Change
mgitterm
 
Land and sea breeze
Land and sea breezeLand and sea breeze
Land and sea breeze
champa1
 

What's hot (20)

Weather and climate
Weather and climateWeather and climate
Weather and climate
 
Atmosphere revision booklet 2014 cg malia
Atmosphere revision booklet 2014 cg maliaAtmosphere revision booklet 2014 cg malia
Atmosphere revision booklet 2014 cg malia
 
20100418_Herman_Ridderinkhof_Getijden
20100418_Herman_Ridderinkhof_Getijden20100418_Herman_Ridderinkhof_Getijden
20100418_Herman_Ridderinkhof_Getijden
 
Air masses ppt cscope
Air masses ppt cscopeAir masses ppt cscope
Air masses ppt cscope
 
Energy budgets
Energy budgetsEnergy budgets
Energy budgets
 
Chapt35
Chapt35Chapt35
Chapt35
 
Final Presentation
Final PresentationFinal Presentation
Final Presentation
 
Little ice age
Little ice ageLittle ice age
Little ice age
 
Notes - Air Masses, Fronts, Global Winds
Notes - Air Masses, Fronts, Global WindsNotes - Air Masses, Fronts, Global Winds
Notes - Air Masses, Fronts, Global Winds
 
CAMBRIDGE AS GEOGRAPHY REVISION: ATMOSPHERE AND WEATHER - 2.2 THE GLOBAL ENER...
CAMBRIDGE AS GEOGRAPHY REVISION: ATMOSPHERE AND WEATHER - 2.2 THE GLOBAL ENER...CAMBRIDGE AS GEOGRAPHY REVISION: ATMOSPHERE AND WEATHER - 2.2 THE GLOBAL ENER...
CAMBRIDGE AS GEOGRAPHY REVISION: ATMOSPHERE AND WEATHER - 2.2 THE GLOBAL ENER...
 
93. Angle of the Sun Notes
93. Angle of the Sun Notes93. Angle of the Sun Notes
93. Angle of the Sun Notes
 
GEOGRAPHY IGCSE: WEATHER MEASUREMENTS.
GEOGRAPHY IGCSE: WEATHER MEASUREMENTS.GEOGRAPHY IGCSE: WEATHER MEASUREMENTS.
GEOGRAPHY IGCSE: WEATHER MEASUREMENTS.
 
Phes ch20 Severe Weather
Phes ch20 Severe WeatherPhes ch20 Severe Weather
Phes ch20 Severe Weather
 
Enso as an integrating
Enso as an integratingEnso as an integrating
Enso as an integrating
 
115. Hydrospheric Effects on Climate Change
115. Hydrospheric Effects on Climate Change115. Hydrospheric Effects on Climate Change
115. Hydrospheric Effects on Climate Change
 
Land and sea breeze
Land and sea breezeLand and sea breeze
Land and sea breeze
 
CAMBRIDGE AS GEOGRAPHY REVISION: ATMOSPHERE AND WEATHER - 2.4 THE HUMAN IMPACT
CAMBRIDGE AS GEOGRAPHY REVISION: ATMOSPHERE AND WEATHER - 2.4 THE HUMAN IMPACTCAMBRIDGE AS GEOGRAPHY REVISION: ATMOSPHERE AND WEATHER - 2.4 THE HUMAN IMPACT
CAMBRIDGE AS GEOGRAPHY REVISION: ATMOSPHERE AND WEATHER - 2.4 THE HUMAN IMPACT
 
94. Power of the Sun Notes
94. Power of the Sun Notes94. Power of the Sun Notes
94. Power of the Sun Notes
 
GEOGRAPHY IGCSE: WEATHER SYSTEMS
GEOGRAPHY IGCSE: WEATHER SYSTEMSGEOGRAPHY IGCSE: WEATHER SYSTEMS
GEOGRAPHY IGCSE: WEATHER SYSTEMS
 
Temperature and it’s distribution(ocean)
Temperature and it’s distribution(ocean)Temperature and it’s distribution(ocean)
Temperature and it’s distribution(ocean)
 

Similar to Egan_Case_Study

2013 10-15 skyline climate
2013 10-15 skyline climate2013 10-15 skyline climate
2013 10-15 skyline climate
Elsa von Licy
 
KhanRaphael_AGUPoster_2015
KhanRaphael_AGUPoster_2015KhanRaphael_AGUPoster_2015
KhanRaphael_AGUPoster_2015
Hana Khan
 
Melting glaciers
Melting glaciersMelting glaciers
Melting glaciers
shreeshan09
 
L6 Causes Of Flooding
L6 Causes Of FloodingL6 Causes Of Flooding
L6 Causes Of Flooding
tudorgeog
 
Monthly seasonal outlook
Monthly seasonal outlookMonthly seasonal outlook
Monthly seasonal outlook
climate central
 
LeeSideTroughsGouldUpdate
LeeSideTroughsGouldUpdateLeeSideTroughsGouldUpdate
LeeSideTroughsGouldUpdate
samuelgould
 
Semester Presentation 1
Semester Presentation 1Semester Presentation 1
Semester Presentation 1
Mark Klapheke
 

Similar to Egan_Case_Study (20)

MET 460 Poster
MET 460 PosterMET 460 Poster
MET 460 Poster
 
Eops 2015 3_24
Eops 2015 3_24Eops 2015 3_24
Eops 2015 3_24
 
Sed 4 the water budget
Sed 4 the water budgetSed 4 the water budget
Sed 4 the water budget
 
Sed 4 The Water Budget
Sed 4 The Water BudgetSed 4 The Water Budget
Sed 4 The Water Budget
 
Climate change: changes in the cryosphere
Climate change: changes in the cryosphereClimate change: changes in the cryosphere
Climate change: changes in the cryosphere
 
Are we melting
Are we meltingAre we melting
Are we melting
 
Pristov - 2016
Pristov - 2016Pristov - 2016
Pristov - 2016
 
2013 10-15 skyline climate
2013 10-15 skyline climate2013 10-15 skyline climate
2013 10-15 skyline climate
 
KhanRaphael_AGUPoster_2015
KhanRaphael_AGUPoster_2015KhanRaphael_AGUPoster_2015
KhanRaphael_AGUPoster_2015
 
Mary Edwards - The Big Thaw - Isle of Wight Cafe Sci, Oct 2016
Mary Edwards - The Big Thaw - Isle of Wight Cafe Sci, Oct 2016Mary Edwards - The Big Thaw - Isle of Wight Cafe Sci, Oct 2016
Mary Edwards - The Big Thaw - Isle of Wight Cafe Sci, Oct 2016
 
EOPS_2018_11_06.pdf
EOPS_2018_11_06.pdfEOPS_2018_11_06.pdf
EOPS_2018_11_06.pdf
 
Melting glaciers
Melting glaciersMelting glaciers
Melting glaciers
 
L6 Causes Of Flooding
L6 Causes Of FloodingL6 Causes Of Flooding
L6 Causes Of Flooding
 
EOPS_2021_03_11.pdf
EOPS_2021_03_11.pdfEOPS_2021_03_11.pdf
EOPS_2021_03_11.pdf
 
Monthly seasonal outlook
Monthly seasonal outlookMonthly seasonal outlook
Monthly seasonal outlook
 
Diving into the Hudson Without Getting Wet
Diving into the Hudson Without Getting WetDiving into the Hudson Without Getting Wet
Diving into the Hudson Without Getting Wet
 
LeeSideTroughsGouldUpdate
LeeSideTroughsGouldUpdateLeeSideTroughsGouldUpdate
LeeSideTroughsGouldUpdate
 
Eops 2013 05_20
Eops 2013 05_20Eops 2013 05_20
Eops 2013 05_20
 
Eops 2013 05_20
Eops 2013 05_20Eops 2013 05_20
Eops 2013 05_20
 
Semester Presentation 1
Semester Presentation 1Semester Presentation 1
Semester Presentation 1
 

More from Joseph Egan

ECWS Presentation
ECWS PresentationECWS Presentation
ECWS Presentation
Joseph Egan
 
Joe Egan AMS Poster
Joe Egan AMS PosterJoe Egan AMS Poster
Joe Egan AMS Poster
Joseph Egan
 
Hollings SHE power point
Hollings SHE power pointHollings SHE power point
Hollings SHE power point
Joseph Egan
 
Research Presentation_V3
Research Presentation_V3Research Presentation_V3
Research Presentation_V3
Joseph Egan
 

More from Joseph Egan (6)

joe lumina
joe luminajoe lumina
joe lumina
 
ECWS Presentation
ECWS PresentationECWS Presentation
ECWS Presentation
 
ECWS Paper
ECWS PaperECWS Paper
ECWS Paper
 
Joe Egan AMS Poster
Joe Egan AMS PosterJoe Egan AMS Poster
Joe Egan AMS Poster
 
Hollings SHE power point
Hollings SHE power pointHollings SHE power point
Hollings SHE power point
 
Research Presentation_V3
Research Presentation_V3Research Presentation_V3
Research Presentation_V3
 

Egan_Case_Study

  • 1. Joe Egan Professor Wolf MET 481 April 9, 2016 Mesoscale Case Study: 5-9 December 2010 Lake Effect Snow From 5-9 December 2010, much of northeast Ohio and northwest Pennsylvania were impacted by a widespread, intense lake effect snow event. After a fairly mild and benign November with relatively little snowfall throughout the region, this event was the result of a dramatic pattern change. A closed 500-hPa low became cut-off from the mean westerly flow and stalled over Quebec and Ontario (Figure 1). Northwesterly flow through a deep layer of the atmosphere over the relatively warm water of the Great Lakes resulted in a long-lived lake effect snow event in the lee of all five lakes. The deep-layer northwest flow and substantial lake- induced instability can be seen on the DTX sounding from 00Z on 6 December 2010 (Figure 2). The focus of this case study will be on the portion of the event that impacted northeast Ohio and northwest Pennsylvania. The snow began in northeast Ohio shortly after 00Z on 5 December 2016 following the passage of a weak area of low pressure to the south of the region. The associated trough could be seen on the surface analysis for that time (not shown); following its passage through northern Ohio, winds veered to a northwest-southeast trajectory over a deep layer across the Great Lakes. Of particular importance during this event was the northwest flow that extended horizontally as far north and west as western Lake Superior, particularly at 850 hPa (Figure 3). As a result, moisture from Lake Michigan and Superior was contributing to the lake effect snow bands in the lee of Lake Erie due to the favorable fetch. Snowfall in extreme northeast Ohio and northwest Pennsylvania was also enhanced by Lake Huron moisture. Evidence of these connections can be seen on the radar mosaic from 14Z on 5 December 2016 (Figure 4). Moisture was also more than sufficient, as indicated by the aforementioned sounding and 850-hPa plot. The average water temperature for Lake Erie throughout the event was around 7-8°C while 850-hPa temperature hovered around -12 to -16°C, resulting in surface-850 hPa delta-T’s of 20°C or greater and ample lake-induced instability (NOAA/GLERL, 2010). Wind speeds were also strong enough in the low-levels to translate the bands well inland, but not too strong to tear the bands apart or prevent them from organizing (Figure 5). Frictional convergence and orographic lift enhanced the intensity of the snowfall due to the topography of northeast Ohio and northwest Pennsylvania, which slopes gently upward from around 600 feet MSL in downtown Cleveland to over 1200 feet in the hills south and east of Cleveland and to over 1700 feet in the hills east of Meadville, PA (TopoCreator, 2009). As is the case with almost all multi-day lake effect snow events, heavy snow did not fall continuously throughout the five-day duration of the event. Rather, the snow bands periodically increased and decreased in intensity while migrating at times due to the passage of surface troughs that caused subtle shifts in the low-level flow. One of the peaks in snowfall intensity for locations east of Cleveland came on the night of 5-6 December 2010. The surface analysis and radar mosaic for 04Z on 6 December clearly depict that the heaviest snow was focused into a narrow but elongated band from the lakeshore southeastward into Youngstown (Figures 6 and 7).
  • 2. Orographic lift enhanced this band considerably since it stretched from the lakeshore into the highest hills of Geauga County. After a few more oscillations in intensity, the event reached its final peak during the afternoon and evening of 8 December 2010. The 12Z DTX sounding on that day (Figure 8) continued to depict deep-layer northwest flow, though the direction had veered slightly more west of north. As a result, the bulk of the intense activity was focused into locations from downtown Cleveland eastward. The one factor that particularly enhanced the snowfall in this area was a narrow convergence zone that developed along the length of the lakeshore, as depicted on the 20Z surface analysis for the day (Figure 9). This convergence combined with the aforementioned parameters already in place set the stage for a very intense snow band that dropped ten inches of new snow on downtown Cleveland during the peak of the evening rush hour (Figure 10). The event wrapped up by 00Z on 10 December as 500-hPa ridging moved into the region causing the flow to shift to southwesterly, advecting warmer air into northeast Ohio (Figure 11). Figure 12 displays the snowfall distribution throughout the area; the heaviest amounts in Ohio (eighteen to twenty-four inches) fell across the higher terrain of Geauga County. Some locations in Crawford County, Pennsylvania saw even higher amounts, with up to four feet of snow in the northeast part of the county.
  • 3. Figure 1: 500-hPa heights (dm) and absolute vorticity (*10^-5 s^-1) valid at 00Z on 6 April 2010. The closed upper-level low over Quebec and Ontario would move very little over the next 4 days because it was cut-off from the mean westerly flow. Meanwhile, the omega block over the Rockies kept any upstream trough from kicking the closed low eastward. This maintained a cold, northwesterly flow through a deep layer over the Great Lakes throughout the 4-day period, resulting in a pro-longed lake effect snow event for all five Great Lakes. Image courtesy of MMM/UCAR.
  • 4. Figure 2: Skew-T plot of KDTX sounding from 00Z on 6 December 2010. The deep northwesterly flow is clearly depicted at right, which is a favorable fetch for lake effect snow in the lee of Lake Erie. Speed shear was fairly low (aside from the surface-900 mb layer) which allowed parcels to have ample residence time over the lake to become unstable. Steep low-level lapse rates indicated sufficient lake-induced instability. The inversion above 800 mb was notable, but was likely not enough to limit snow growth and likely was overcome by the warm waters of Lake Erie. Most of the dendritic growth zone (DGZ) was sufficiently moist and unstable allowing for efficient snow production and locally intense snowfall rates. Image Courtesy: University of Wyoming
  • 5. Figure 3: 850-hPa composite plot from 00Z on 6 December 2010. Northwesterly flow can be implied from Minnesota southeastward to the shores of Lake Erie (area outlined in black). This is a particularly favorable fetch for significant lake effect snow in the lee of Lake Erie because moisture from Lakes Superior and Michigan contribute to the snow bands in addition to moisture from Lake Erie itself. Since the upper-level low was stalled over Quebec, this pattern did not change much over the following four days. The strength of the 850-hPa winds (plotted in knots) allowed the snow bands to translate rather far inland into northeast Ohio and northwest Pennsylvania. Image courtesy: Plymouth State Weather Center.
  • 6. Figure 4: Radar mosaic at around 14Z on 5 December 2010. Area outlined in yellow represents the general region affected by lake effect snow bands at the time. The lake effect snow bands had initiated off of all five Great Lakes by this time. The snow was aligned in multiple wind parallel bands, as is typical with deep-layer northwest flow due to the lack of a single focused axis of convergence. The bands have an unusually long inland extent due to the strong 850-hPa winds. Inter-lake connections are also evident as the bands off of Lake Erie were being fed by moisture from upstream lakes. Image Courtesy: MMM/UCAR
  • 7. Figure 5: Surface composite plot from 14Z on 5 December 2010. The snow observations match up with the radar reflectivity in Figure 4 (area outlined in red). The relatively weak surface winds (around 10 knots throughout northern Ohio) allowed the bands to have sufficient residence time over the warm waters of the lakes. The winds were strong enough to promote frictional convergence along the shoreline to enhance the snowfall for downstream locations. Image Courtesy: Plymouth State Weather Center
  • 8. Figure 6: Surface composite plot for 04Z on 6 December 2010, around the time of the first peak in snowfall intensity; moderate snow was reported at KAKR. One key factor that contributed to the uptick in snowfall intensity around this time was the development of a subtle axis of convergence (outlined in red). This convergence combined with the orographic lift provided by the higher terrain south and east of Cleveland (symbolized by the star) enhanced the snowfall in this region. The surface winds had also increased since the time of Figure 5, which allowed the bands to extend even further inland, as a far southeast at Pittsburgh.
  • 9. Figure 7: Radar mosaic from around 04Z on 6 December 2010. The lake effect bands were much narrower at this time than in Figure 4, but were also locally more intense. The most intense band off of Lake Erie is outlined in yellow, along with its connection to Lakes Michigan and Superior. This band was being fed by moisture from upstream lakes, which likely combined with the other mesoscale influences discussed in Figure 6 to result in locally heavy snowfall in northeast Ohio. The inland extent of this band is also clearly depicted, as well that of other bands off of Lake Erie and other lakes. Image Courtesy: MMM/UCAR
  • 10. Figure 8: Skew-T plot of KDTX sounding from 12Z on 8 December 2010. Compared to Figure 2, the winds are backed slightly and more speed shear is evident (especially in the 800-400 mb layer, outlined in red). The shear combined with the mid-level dry air in the 750-500 mb layer resulted in a relative minimum in snow band organization and intensity. However, low-level lapse rates remained nearly dry adiabatic. As a result, a later uptick in band organization and intensity occurred downstream of the sounding site that afternoon following the passage of a surface trough. The subtle wind shift to a more west-northwest origin shifted the bands northward, as can be seen in Figure 10. The stout inversion above 800 mb was again likely overcome over the lake.
  • 11. Figure 9: Surface composite plot for 20Z on 8 December 2010. The axis of convergence (within the area outlined in red) can be implied by the converging wind barbs in northern Ohio, southeast Lower Michigan and far southern Ontario. This convergence enhanced the snowfall intensity from downtown Cleveland (represented by the star) eastward. The more westerly component of the wind can also be seen. This directed the bulk of the more persistent bands into a zone oriented west to east from Cleveland to northwest Pennsylvania into western New York, though the enhanced convergence focused the heaviest snow in a narrow band from Cleveland through the eastern suburbs. See Figure 10 for a radar mosaic at the same time.
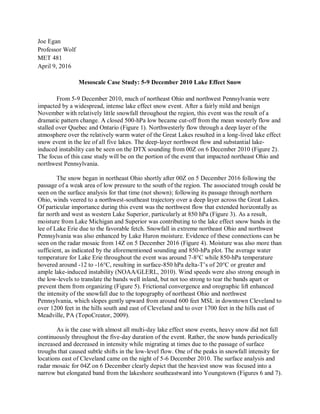
  • 12. Figure 10: Radar mosaic from around 20Z on 8 December 2010. While the lake effect snow was winding down off of the Western Great Lakes, the activity in the lee of Lake Erie was focused into two particularly intense bands (outlined in yellow). These lie within the axis of convergence outlined in Figure 9 and their intensities were likely enhanced by this as well as orographic lift from the hills east of Cleveland. The larger of the two bands persisted over downtown Cleveland into the evening rush hour, resulting in extremely hazardous driving conditions. Image Courtesy: MMM/UCAR.
  • 13. Figure 11: Same as Figure 1 except at 00Z on 10 December 2010. The pattern became more progressive by this time as a “kicker” trough finally arrived to break down the omega block in the Western United States. This allowed the ridge ( represented by the heavy dashed black line; in a weakened state compared with that of Figure 1) to progress eastward into the Great Lakes to veer winds around to the west-southwest, resulting in warm air advection that effectively ended the lake effect snow. Image courtesy: MMM/UCAR.
  • 14. Figure 11: Map of storm total snow fall for the entire event for the NWS WFO Cleveland, OH County Warning Area (CWA). The local maxima in Geauga County, OH as well as Crawford County, PA (within the area outlined in black) were co-located with local peaks in elevation. Orographic lift enhanced the snowfall rates in many locations within the black outlined area and this map clearly shows the results. The effects were even more substantial in Crawford County, PA, where the snow bands were more persistent, the orographic lift was most pronounced due to the steeper hills, and additional moisture was added from Lake Huron. Image courtesy: NWS Cleveland, OH
  • 15. References NCAR, 2014: Image Archive. Accessed 9 April 10, 2016. [Available online at http://www2.mmm.ucar.edu/imagearchive/] NOAA/GLERL, 2010: Great Lakes Statistics. Accessed 11 April 2016. [Available online at http://coastwatch.glerl.noaa.gov/statistic/statistic.html] NOAA/NWS Cleveland, 2010: Early December Heavy Lake Effect Snow. Accessed 9 April 2016. [Available online at http://www.weather.gov/cle/event_20101209_snow] NOAA/NWS Cleveland, 2011: Notable Weather Events of 2010. Accessed 9 April 10, 2016. [Available online at http://www.weather.gov/cle/event_2010_notable] Plymouth State University, 2016: Make Your Own: Product Generator for Real-Time and Archived Data. Accessed 7 April 2010. [Available online at http://vortex.plymouth.edu/myo/] TopoCreator, 2009: State Maps and Elevation Data. Acessed 11 April 2016. [Available online at https://topocreator.com/ned-jpg/city_a/600/oh.jpg] University of Wyoming, 2016: Atmospheric Soundings. Accessed 9 April 10, 2016. [Available online at http://weather.uwyo.edu/upperair/sounding.html]