1. Joshua Rowe
Mesoscale Case Study: August 10, 2015
MET-481-A: Mesoscale Meteorology
This case was extremely interesting, because mesoscale boundaries were the
source of shear for thunderstorms, that allowed many to become strong and some even
severe. Winds in the upper-levels were not very strong, so 0-6km shear was not favorable
for severe weather. In order for severe weather to occur thunderstorms need a tilted
updraft to prevent the downdraft from disrupting the inflow with rain cooled air. In other
words thunderstorms are unable to become intense enough to produce severe weather
without a strong updraft. In this case there were 2 damaging wind reports in Dupage
County and several funnel clouds reported across Northern Illinois with one reported near
Rochelle, Illinois in Ogle County.
In the morning very warm and moist conditions were already present across the
area of Northern Illinois. You can infer that instability was present due to the
combination of these conditions and an approaching cold front moving in from the north.
I would have liked to look at a sounding from Chicago, but the closest archived sounding
site is Lincoln, Illinois, so I could not see the actual CAPE values in the area of focus.
Several boundaries developed throughout the day as a line of thunderstorms moved
across Northern Illinois in the late afternoon. These thunderstorms produced outflow
boundaries across the area, which played a role in the development of the severe
thunderstorm. As surface temperatures rose over land throughout the day a lake breeze
began to develop. Eventually this lake breeze moved inland and interacted with the
outflow boundaries from the previous storms along with the approaching surface cold
front. These boundary interactions provided ample shear, which allowed storms to
develop tilted updrafts for a short period of time. The tilted updrafts permitted storms to
last longer and one of them became severe.
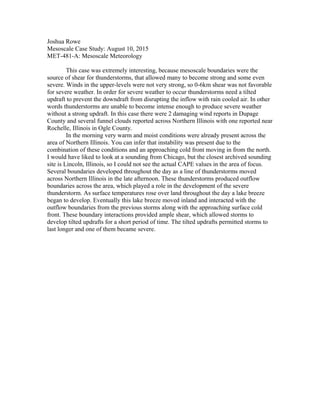
2. Figure 1: Hodograph for Davenport, Iowa on August 11 at 0000 UTC. I chose this time
and site, because it is the closest time to when the thunderstorms occurred and the closest
observation to where the thunderstorms occurred. Good vertical wind shear is associated
with nice long vectors, but as you can see here the wind vectors are very small, in
towards the center of the hodograph. In the most favorable situations for severe weather
the hodograph would have a nice hump to it, showcasing good vertical speed and
curvature wind shear, but neither is present in this hodograph. Image Source: Plymouth
State Data Archive
3. Figure 2: Sounding for Davenport, Iowa on August 11 at 0000 UTC. This sounding
shows weak winds from the surface to almost 300 hPa. Again this showcases the lack of
vertical wind shear that is needed to tilt thunderstorms updrafts. Image Source: Plymouth
State Data Archive
4. Figure 3: Base velocity radar image for the storm that produced damage reports in
Dupage County. The Yellow polygon signifies the severe thunderstorm warning box.
Inbound velocities are shown in green and outbound are shown in red. Outlined in the
yellow circle is the microburst that was the likely cause of the storm reports. The brighter
colors signify stronger winds, so the microburst is where the couplet of brightest colors
is. This does not signify a tornado couplet in this situation, because the winds are
divergent not convergent. Image source NWS Chicago, Illinois.
5. Figure 4: Surface Observations at 1507 UTC on the 10th
. Focus should be put on the
warm temperatures and high dew points in Northern Illinois, which is very favorable for
the development of thunderstorms. It is also important to note that it is already almost 80
degrees at 10:00 A.M. Central time. Source: UCAR Image Archive
6. Figure 5: Surface Observations at 1907 UTC on the 10th
. The lake breeze can clearly be
seen by looking at the winds along the Western lakeshore of Lake Michigan as they are
anomalous to the general surface flow. Winds out of the northeast along the lakeshore
and winds out of the northwest to the west of the lakeshore illustrate the convergent
boundary in the area. In addition to this the temperatures at these obs are substantially
cooler, around 70ºF, than the temperatures just inland, which are in the low to mid 80sºF.
Source: UCAR Image Archive
7. Figure 6: Surface Analysis Map Issued at 1930 UTC on the 10th
. This map is important,
because it shows the general synoptic pattern for the day in which this event occurred. A
weak surface low is shown just to the southeast of the area of focus. This system did not
have much impact on the event of import. The main emphasis should be placed on the
surface low just north of Lake Superior in Canada. This low pressure system had a much
stronger cold front associated with it, which acted as one of the boundaries of enhanced
convergence. Image Source: Storm Prediction Center Map Archive
8. Figure 7: Composite Radar Reflectivity at 1655 UTC on the 10th
. An initial line of non-
severe thunderstorms was over Northern Illinois at this time. This line left an outflow
boundary, which served as one of the major boundaries for storms that developed later
on. It can also be seen that there are storms firing up parallel to the Western Lake
Michigan shoreline in extreme Southeast Wisconsin. These storms likely fired due to the
lake breeze starting to develop, which provided enhanced convergence right along the
lakeshore. Source: UCAR Image Archive
9. Figure 8: Composite Radar Reflectivity at 2055 UTC on the 10th
. A Severe Thunderstorm
Warning was issued near this time for the strongest cell west of the Chicago Metro.
Outflow from the previous line that moved through coupled with the lake breeze as it was
advancing inland provided enough shear for this storm to become severe. In addition to
this the funnel cloud in Ogle County was reported close to this time. This brief spin up
was likely a result of the lake breeze interacting with outflow from single cell
thunderstorms that formed behind the initial line. As they died out the outflow from their
rain cooled air kept progressing to the south and eventually interacted with the lake
breeze. Source: UCAR Image Archive
10. Figure 9: Composite Radar Reflectivity at 2125 UTC on the 10th
. This was the closest
time to the damaging wind reports in the Dupage County. A dominant cell can be noted
just to the south of the Chicago Metro. This dominant cell was the culprit of the
damaging wind in Dupage County. The cell just to the east of Rockford is the storm that
produced the funnel cloud in Ogle County. Source: UCAR Image Archive
Ogle County Cell
Dupage County Cell