SlideShare a Scribd company logo
1 of 19
Egan 1
Joe Egan
Professor Goebbert
MET 373
April 24, 2015
East Coast Snowstorms: A General Overview
I. Introduction
East Coast Snow Storms (ECWSs; Hirsch et. al., 2001) are a clear and present threat to
the Atlantic Coast of the United States, as the 1993 “Storm of the Century” clearly demonstrated.
ECWSs are commonly known in the United States as “Nor’ Easters” due to their typical
northeasterly track along the coast as well as the northeast winds that occur in their northwest
quadrant (the portion which usually affects the East Coast). These storm systems are especially
known for their tendency to “bomb out”, or experience a central pressure drop of at least 24
millibars in 24 hours, off the East Coast or Gulf Coast. For example, the 1993 ECWS (also
known as the “Storm of the Century”) experienced a central pressure decrease of twenty-nine
millibars in twenty-four hours (Kocin et. al. 1995). An extensive amount of research has been
conducted about various aspects of ECWSs, including their basic storm types, cyclogenesis
process, bombo-genesis and climatology/frequency. This paper will function as an overview of
the research that has been completed over the past 60-70 years on ECWSs. Section II will
examine a few factors responsible for the formation and explosive deepening of ECWSs and
Section III will focus on ECWS criteria and storm types. Climatology of ECWSs will be
discussed in Section IV, in addition to the effects of teleconnection patterns on the frequency and
strength of the storms. A relatively new forecasting technique, which can better predict the
impacts from ECWSs, will be looked at in Section V followed by a brief case study of the 1993
Storm of the Century (one of the most memorable and destructive ECWSs) in Section VI.
Egan 2
II. Cyclogenesis and Bombo-genesis Factors
ECWSs develop in very similar ways to other extra-tropical cyclones. They are, like
land-based mid-latitude cyclones, driven by low-level temperature gradients and upper-level
divergence. Most ECWSs develop in the lee of the Appalachian Mountains. As a vortex of air
ascends the mountains, it is typically compressed along isentropic surfaces and as result spins
less cyclonically or even anti-cyclonically. However, the vortex is typically stretched as it
descends the mountains and spins more cyclonically. In the winter, cold air outbreaks and land-
based mid-latitude cyclones combined with cold-core highs over the Unites States result in a
rather tight temperature gradient between the land and the ocean (Miller 1946). The vortex can
develop into a full-fledged cyclone upon encountering this temperature gradient. The fluxes of
sensible and latent heat off the Atlantic Ocean, which are enhanced particularly by the Gulf
Stream, also enhance cyclogenesis (Jacobs et. al., 2005). Heat fluxes combined with the
orographic lift and descent of the vortex across the Appalachians work in tandem to develop
mid-latitude cyclones along the East Coast of the U.S. (Denard and Ellenton 1979).
However, the explosive deepening that is common of ECWSs cannot be explained by
heat fluxes and orographic lift. Denard and Ellenton (1979) found that orographic lift could not
explain the deepening because of the fact that ECWSs are usually over the ocean (well beyond
the Appalachians) by the time they “bomb out”. In addition, heat fluxes were found by Denard
and Ellenton (1979) to not be a factor in the explosive deepening due to the fact that, according
to their own derivation, the Laplacian of the heat fluxes did not favor deepening at the cyclone’s
center. Instead, Denard and Ellenton (1979) found that the rapid pressure fall at the centers of
ECWSs is due to the combined effects of divergence aloft and lack of friction over the ocean.
The latter tends to reduce low-level mass convergence, which, combined with strong divergence
Egan 3
aloft, results in a strongly negative pressure tendency. While surface convergence is necessary
for cyclogenesis (to enhance rising motion), too much can result in a net pressure rise at the
surface which would weaken the cyclone. Another upper-level feature common in rapidly
deepening ECWSs is a strong cyclonic vorticity advection maximum downstream of the surface
low (typically at 500hPa). While vorticity advection cannot explain changes in the strength of an
ECWS, differential cyclonic vorticity advection with height can enhance rising motion
(according to the QG-Omega equation) and increase cyclogenesis. Therefore, a higher-
magnitude differential cyclonic vorticity advection maximum is connected to an explosively
deepening ECWS (Jacobs et. al. 2005). Warm air advection occurring at a level of strong
differential cyclonic vorticity advection provides the other forcing necessary for rising motion.
Jacobs et. al. (2005) also noted that ECWSs were more likely to undergo rapid deepening when
crossing a strong sea-surface temperature gradient.
III. ECWS Criteria and Storm Types
The Glossary of Meteorology defines a Nor’ Easter as a cyclone forming between 30°
and 40° North within 167km of the U.S. East Coast that moves in a north or northeasterly
direction (Hirsch et. al. 2001). However, this definition was found by Hirsch et. al. (2001) to be
too vague since it allowed tropical cyclones to be placed in this category as well as weaker mid-
latitude cyclones that had little or no impact on life or property. Therefore, Hirsch et. al. (2001)
came up with a new set of criteria for ECWS which has been accepted as the formal set of
criteria by others involved in ECWS research, including Stuart and Grumm (2006). Hirsch et. al.
(2001) defines an ECWS as an area of low pressure that: has a closed circulation, is located
within the quadrilateral outlined by solid lines in Figure 1 (an ECWS can form within the dashed
outlined area but must move into the solid outline area during its life cycle), moves in a general
Egan 4
north to northeasterly direction, and contains maximum sustained winds greater than 20 knots for
at least six consecutive hours. These criteria were used by Hirsch et. al. (2001) to identify
ECWSs over a 48 year period including 1948 and 1951-1997, in which they identified 562 low-
pressure systems as ECWSs. Within this set, they defined ECWSs with maximum sustained
winds greater than 45 knots for at least six consecutive hours as “strong ECWSs” (Hirsch et. al.
2001).
FIG. 1. Boundaries of area used to identify low pressure systems (dashed lines) and potential ECWS (solid lines).
Courtesy: Hirsch et. al. (2001)
While Hirsch et. al. (2001) came up with the most formal modern definition of ECWSs,
groundbreaking research into the types of ECWSs as well as how and where each type originates
was conducted by Miller (1946). While Miller’s research was limited in scope by the fact that
upper-air data was almost non-existent in the 1940s, his work helped to identify the basic surface
features of ECWSs and the regions in which they typically form. Two types of cyclones were
Egan 5
identified by Miller (1946): Type-A and Type-B (now known as Miller type-A and Miller type-
B; Stuart and Grumm 2006).
Type-A storms typically form off the Gulf Coast or southeast Atlantic coast of the United
States and track northeast, often affecting a large portion of the East Coast (Stuart and Grumm
2006). The 1993 “Storm of the Century” was a Miller type-A storm. Miller type-A storms
typically form ahead of major cold outbreaks over the eastern United States (Miller 1946). The
synoptic weather pattern prior to the formation of Miller type-A storms is typically characterized
by a cold-core high pressure system over the Great Plains or Midwestern United States, with
anti-cyclonic flow bringing cold air from Canada into the eastern U.S (see Figure 2). The cold,
continental air-mass is met at or just off the coast by warm, moist air-mass (often enhanced by
the Gulf Stream). As mentioned in Section II, if a vortex descending the Appalachian Mountains
encounters this air-mass clash, a cyclone is likely to form. Hirsch et. al. (2001) defined their own
storm types in their study, and Miller type-A storms are synonymous with Hirsch’s “full coast
storm” type. Hirsch et. al. (2001) found that about two-thirds of the “strong ECWSs” that were
identified in their study were full-coast storms.
Egan 6
FIG. 2: Example of a Miller type-A storm just after cyclogenesis.Courtesy: Miller (1946)
The second major type of ECWSs identified by Miller (1946) is known as Miller type-B.
This type of cyclone is more common than Miller type-A and forms under a somewhat different
synoptic setup. Prior to the formation of the Miller type-B storm, a land-based mid-latitude
cyclone (‘primary cyclone”; Miller, 1946) that is either occluding or occluded is usually present
over the Appalachian Mountains or eastern Great Lakes (see Figure 3). The cold air-mass north
and east of the occluded front of the primary cyclone is typically trapped between the
Appalachians and the East Coast, while a warm-moist current of air flowing along the coast
creates a temperature front. As a the vortex associated with the primary cyclone descends the
Appalachians and encounters this air-mass clash, a new low-pressure center often develops just
off the East Coast and moves northeast. This “secondary cyclone” then often moves northeast
and impacts mainly the mid-Atlantic and New England states (Miller 1946). Miller type-B
storms compare well with Hirsch et. al.’s (2001) “northern storm” type.
Egan 7
FIG. 3: Miller type-B storm just after origin. Courtesy: Miller (1946)
Hirsch et. al. (2001) defined a third storm type, “southern storms”, which affect mainly
the Gulf Coast and southeast United States while remaining south of 35° North. While these
storms can and, in winter months, often do produce wintry precipitation if temperature profiles
are favorable, Hirsch et. al. (2001) found that only 8% of the storms identified as ECWSs in their
study were “southern storms”, making them by far the least common type. Due to the lack of
research that has been conducted on southern storms and their overall rarity, this paper will focus
on full coast and northern storms (Miller type-A and B).
IV. Climatology of ECWSs
Hirsch et. al. (2001) found that an average of 12 ECWSs occur each year between the
months of October and April, based on their study and identification of ECWSs from 1948 and
1951-97, although there is high year-to year variability. Over half of these storms were found to
be northern storms, with full coast storms second most frequent followed by southern storms.
Egan 8
Table 1 lists the seasonal statistics for ECWSs according to the study by Hirsch et. al. (2001).
Full coast storms were found to be slightly more common than Stuart and Grumm (2006)
suggest. However, the higher numbers in Hirsch et. al. (2001) may have been caused by some
ECWSs forming just south of 35° North and subsequently moving north of this line which would
result in these ECWSs being classified as full coast. Each storm type was found by Hirsch et. al.
(2001) to peak in a different month, as can be seen in Figure 4; overall storm activity was found
to peak in January. The overall peak in activity in January is likely due to the fact that the tightest
north-south temperature gradient exists over the United States during this period. The coldest
temperatures of the season also typically occur in January, so the difference in temperature
between land and ocean is the greatest during this particular month.
Table 1: ECWS Seasonal Statistics from 1948 and 1951-1997, courtesy of Hirsch et. al. (2001).
Egan 9
FIG. 4: Monthly distribution of storm totals divided by north (dark gray), south (white), and full coast (gray)
ECWS. Relative percentages ofeach storm type are shown inside each bar. Courtesy: Hirsch et. al. (2001)
The high year-to-year variability is often caused by the various teleconnection patterns,
which can significantly affect winter temperatures and jet stream placement over the United
States. Figure 5 shows how ECWS frequency varies with the phase of El Niño-Southern
Oscillation (ENSO), as observed by Hirsch et. al. (2001). Overall storm frequency often
increases considerably during El Niño winters, and all types of ECWS experience an increase
based on Hirsch’s findings except for northern storms. These results were linked by Hirsh et. al.
(2001) to the fact that the subtropical (southern branch) of the jet stream is usually stronger
during El Niño winters whereas the polar jet is typically further north. This pattern, according to
Hirsch, may favor cyclogenesis off the Gulf Coast and southeast Atlantic coast of the U.S. La
Egan 10
Niña conditions do not have quite as clear of an effect on ECWS frequency, according to Hirsch
et. al. (2001). A slight increase in overall activity is still evident, but the frequency of southern
storms decreases significantly while full coast storm frequency does not change all that much.
Only northern storms experience a significant increase in frequency, according the study of
Hirsch et. al. (2001). The increase in northern storm activity during La Niña winters is, according
to Hirsch, likely due to the polar jet being further south (often over the northeastern United
States) during such winters. However, the authors of this study and an additional study (Hirsch
et. al. 2002) are still uncertain about the physical forcings behind the changes in ECWS
frequency during La Niña. The uncertainty exists mainly because the effects of La Niña
conditions in the eastern equatorial Pacific on temperatures in the United State and Atlantic
Ocean are not consistent as some such winters have been warmer than normal while others have
been colder. Some uncertainty does exist regarding the physical forcing behind the effects of El
Niño winters on ECWS frequency as well though more consistencies exist here than with La
Niña. Further research will likely have to be conducted to confirm how ENSO physically affects
ECWS frequency.
Egan 11
FIG 5: Test statistics, t, comparing the average frequency anomalies of ECWS during ENSO months to those during
neutral months over the Oct–Apr period. Positive (negative) values indicate a(n) increase (decrease) in frequency
anomalies. The 5% level of significance based on a two-tailed hypothesis test using the normal distribution is
denoted for reference. The p values obtained using resampling appear on selected bars. Courtesy: Hirsch et. al.
(2001)
Other teleconnection patterns, such as the North Atlantic Oscillation (NAO), were also
found to be tied to ECWS frequency, although these connections are even more unclear.
Regardless, Hirsch et. al. (2002) found that, in general, warm sea-surface temperature (SST)
anomalies off the southeast U.S coast in the summer (common with the positive NAO phase)
tend to lead to active ECWS seasons, while cold SST anomalies off the southeast U.S. coast in
the summer (common with the negative phase of the NAO) tend to be followed by relatively
inactive ECWS seasons. The SST gradient is typically maximized when the Atlantic waters off
the SE U.S. coast are warmer, which, as mentioned previously, is tied to increased cyclogenesis.
Additional research could make the use of these teleconnection pattern indices useful in
predicting the ECWS activity for the upcoming season, but exact location of the storm track will
be critical to determining impacts such as snow totals.
Egan 12
V. Forecasting ECWS Impacts
Predicting the potential impacts of ECWS can be just as challenging as predicting their
seasonal frequency. While observed data and numerical weather prediction (NWP) models do
provide valuable information and guidance regarding current and possible near-future impacts,
neither type of data gives the forecaster a clear idea of how much of a departure from normal that
an ECWS represents. Furthermore, additional data is needed to allow the forecaster to
meaningfully discern the potential for an ECWS to produce significant amounts of snow based
on physical forcing. Studies by Stuart and Grumm, disseminated in 2004 and 2006, found that
the use of 850hPa and 300hPa wind anomaly data from NWP models will assist forecasters in
predicting the impacts of ECWS, especially precipitation intensity and duration.
Low-level (850hPa) wind anomalies were found by Stuart and Grumm (2004) to be
helpful in determining precipitation intensity for an ECWS. They determined that the location of
easterly (-u direction) wind anomalies of at least four standard deviations below normal (strong
easterly winds) at 850hPa was often the location of the most intense precipitation associated with
an ECWS. Such anomalies are typically located to the north of an ECWS and were found by
Stuart and Grumm (2004) to be indicative of strong moisture advection off the Atlantic Ocean,
low-level convergence, and enhanced low-level frontogenesis. The latter two factors contribute
to increased rising motion; all three factors contribute to intense precipitation. This precipitation
may be snow if the temperature profiles are supportive. It is important to note that the same
approach was found by Stuart and Grumm (2006) to work for determining heavy rain as well.
While low-level wind anomalies help forecasters indicate the greatest potential for heavy
precipitation, upper-level easterly wind anomalies (250-300hPa) were found by Stuart and
Grumm (2004) to be helpful in determining whether or not the ECWS is cutoff from the
Egan 13
predominant westerly flow and, therefore, likely to produce prolonged periods of potentially
heavy precipitation since the system is slow-moving. Easterly wind anomalies at 250-300hPa of
at least 2-2.5 standard deviations below normal were found to indicate that the system is likely
cutoff from the westerly flow. Where strong easterly wind anomalies at 850hPa and 250-300hPa
are co-located, Grumm and Stuart (2004) found that prolonged periods of heavy precipitation
(snow if temperature profiles supported this precipitation type) could be expected.
An example of strong 850hPa and 250hPa easterly wind anomalies being co-located in
association with an ECWS can be found in Figures 6 (850hPa) and 7 (300hPa), courtesy of
Stuart and Grumm (2006). These images are from the Christmas 2002 ECWS and are forecasts
from the Eta model of u-winds and anomalies from 850hPa and 300hPa, respectively. The
locations in which the strongest easterly wind anomalies were forecast did not receive the
heaviest snow due to mild temperatures changing the precipitation to rain or ice at times.
However, the heaviest snow (nearly 100cm, or over three feet) fell between Binghamton and
Albany, New York, where 850hPa u-wind anomalies were forecast to be between three and four
standard deviations below normal and 250hPa u-wind anomalies were progged to be between
two and three standard deviations below normal (Stuart and Grumm 2006). The heaviest snow
fell where the strongest upper-level and lower-level easterly wind anomalies were co-located.
Egan 14
FIG 7-8: Eta 6-h forecast valid at 0000 UTC 26 Dec 2002 of 850-hPa heights (m; heavy solid), U winds (kt) and
anomalies (standard deviations from normal, shaded) (Above) and 250-hPa heights (m; heavy solid), U winds (kt)
and anomalies (standard deviations from normal, shaded) (Below). Courtesy: Stuart and Grumm (2006).
Egan 15
It is important to note that u-wind anomalies should always be used in tandem with other
types of data, like observed data and model output of other fields, to ensure the most accurate
and complete forecast. Stuart and Grumm (2004) also point out that the accuracy of wind
anomalies in predicting ECWS impacts still does depend on the accuracy of the model output,
which should always be quality-checked by the forecaster.
VI. 1993 “Storm of the Century”
One of the most memorable ECWSs on record occurred on 12-14 March 1993 and
impacted the entire East Coast of the United States (Kocin et. al 1995). The storm’s track from
the Gulf of Mexico across Florida and up the East Coast (Figure 8) makes it a classic example of
a Miller type-A, or full coast, storm. The storm experienced its most explosive deepening over
the Gulf of Mexico. This is likely because the right entrance region of one jet streak over the
eastern U.S. and the left exit region of another jet streak over the western U.S. were co-located
(Figure 9), resulting in jet coupling and maximized divergence aloft. The divergence combined
with the lack of friction over the Gulf contributing to less convergence at the surface likely led
the cyclone’s central pressure to fall 17mb in 12 hours and 29mb in 24 hours (Kocin et. al.,
1995). At 850hPa, very strong winds were present, most notably at 12 UTC 13 March and 00
UTC 14 March, as can be seen by the extremely tight height gradient (Figures 10 and 11). While
these figures do not show wind anomalies, the very strong winds can safely be assumed to be a
significant departure from normal and thus likely sufficient to promote heavy precipitation north
of the cyclone. Upper-level (300hPa) wind data were not accessible for this ECWS, however the
strength of the system alone was sufficient to produce heavy precipitation for long enough of a
period to cause crippling impacts along the entire East Coast. As Figure 12 shows, the heavy
Egan 16
precipitation fell as snow as far south as Alabama and Georgia; there were even reports of
snowflakes in northern portions of Florida (Kocin et. al. 1995).
FIG 8: 12-14 March 1993 ECWS Track. Courtesy: University of Illinois, Urbana-Champaign.
FIG 9: 500hPa heights and winds 13 March 00 & 12 UTC courtesy: Kocin et. al. (1994)
Egan 17
FIG 10: 850hPa 12 UTC 13 March
Courtesy: Kocin et. al. (1995)
FIG 11: 00 UTC March 14 Courtesy: Kocin et. al. (1995)
Egan 18
FIG 12: 1993 ECWS Snow totals (filled) and stormtrack (dashed red). Courtesy: AccuWeather.com
VII. Conclusion
East Coast Winter Storms (ECWSs) pose a significant threat to life and property each
winter along the East Coast of the United States. A variety of factors are responsible for their
development and “bombo-genesis”, including orographic lift, heat fluxes, and lack of friction
over the ocean combined with divergence aloft. Two most common types of ECWSs exist, with
a third (southern) type not nearly as common as the other two. While ECWS activity typically
peaks in January, these storms can occur throughout the winter months as well as during the
transition months; the 1993 Storm of the Century is one example of a powerful ECWS which
occurred during a transition month (March). Using wind anomalies in tandem with observed data
and model output will help meteorologists continue to improve their ability to predict the impacts
of ECWSs as well as their confidence in predicting ECWS impacts in advance.
Egan 19
References:
Danard, M.B and G.L. Ellenton, 1980: Physical Influences on East Coast Cyclogenesis.
Atmosphere-Ocean, 18, 65-82
Hirsch, M., A. DeGaetano, and S. Colucci, 2000: An East Coast Winter Storm Climatology. J.
Climate, 14, 882-899.
DeGaetano, A., M. Hirsch, and S. Colucci, 2001: Statistical Prediction of Seasonal East
Coast Winter Storm Frequency. J. Climate, 15, 1101-1117.
Jacobs, Neil A., Gary M. Lackmann, and Sethu Raman, 2005: The Combined Effects of Gulf
Stream–Induced Baroclinicity and Upper-Level Vorticity on U.S. East Coast
Extratropical Cyclogenesis. Mon. Wea. Rev., 133, 2494–2501.
Kocin, P. J., P. N. Schumacher, R. F. Morales, and L. W. Uccellini, 1995: Overview of the 12–
14 March 1993 Superstorm. Bull. Amer. Meteor. Soc., 76, 165–182.
Miller, James E., 1946: Cyclogenesis in the Atlantic Coastal Region of the United States. J.
Meteor., 3, 31–44,
Stuart, Neil A. and Richard Grumm, 2004: Evaluating Potential Impact of Significant East Coast
Winter Storms by Analysis of Upper and Low-level Wind Anomalies. Preprints. 20th
Conf. on Weather Analysis and Forecasting, Seattle, WA, Amer. Meteor. Soc., CD-
ROM, 9.2.
Stuart, N. and Richard Grumm, 2006: Using Wind Anomalies to Forecast East Coast Winter
Storms. Weather and Forecasting, 21, 952-964, 966-968.

More Related Content

What's hot

Geostrophic wind & Gradient wind
Geostrophic wind & Gradient windGeostrophic wind & Gradient wind
Geostrophic wind & Gradient windMahmudul Hasan
 
Wind - Introduction, Effects, Forces and Instruments.
Wind - Introduction, Effects, Forces and Instruments.Wind - Introduction, Effects, Forces and Instruments.
Wind - Introduction, Effects, Forces and Instruments.Sheikh Farhan Asim
 
Temperate Cyclones
Temperate CyclonesTemperate Cyclones
Temperate CyclonesJohn Lanser
 
Chapter 6
Chapter 6Chapter 6
Chapter 6ZBTHS
 
What Makes the Wind Blow
What Makes the Wind BlowWhat Makes the Wind Blow
What Makes the Wind Blowdumouchelle
 
Cyclones - Understanding Storm Systems
Cyclones - Understanding Storm SystemsCyclones - Understanding Storm Systems
Cyclones - Understanding Storm SystemsJohn Johnston
 
Midlatitude cyclones
Midlatitude cyclonesMidlatitude cyclones
Midlatitude cycloneslschmidt1170
 
Atmospheric circulation-Climatology Chapter
Atmospheric circulation-Climatology ChapterAtmospheric circulation-Climatology Chapter
Atmospheric circulation-Climatology ChapterKaium Chowdhury
 
fronts and mid latitude cyclones
fronts and mid latitude cyclonesfronts and mid latitude cyclones
fronts and mid latitude cyclonesNagina Nighat
 
Atmospheric and Oceanic Circulation
Atmospheric and Oceanic CirculationAtmospheric and Oceanic Circulation
Atmospheric and Oceanic Circulationrbrindley
 
Atmospheric circulation
Atmospheric circulationAtmospheric circulation
Atmospheric circulationSarah Zurcaled
 
LeeSideTroughsGouldUpdate
LeeSideTroughsGouldUpdateLeeSideTroughsGouldUpdate
LeeSideTroughsGouldUpdatesamuelgould
 

What's hot (20)

Geostrophic wind & Gradient wind
Geostrophic wind & Gradient windGeostrophic wind & Gradient wind
Geostrophic wind & Gradient wind
 
thesis
thesisthesis
thesis
 
Wind - Introduction, Effects, Forces and Instruments.
Wind - Introduction, Effects, Forces and Instruments.Wind - Introduction, Effects, Forces and Instruments.
Wind - Introduction, Effects, Forces and Instruments.
 
Chapter five
Chapter fiveChapter five
Chapter five
 
Temperate Cyclones
Temperate CyclonesTemperate Cyclones
Temperate Cyclones
 
Chapter 6
Chapter 6Chapter 6
Chapter 6
 
What Makes the Wind Blow
What Makes the Wind BlowWhat Makes the Wind Blow
What Makes the Wind Blow
 
Winds
WindsWinds
Winds
 
Cyclones - Understanding Storm Systems
Cyclones - Understanding Storm SystemsCyclones - Understanding Storm Systems
Cyclones - Understanding Storm Systems
 
Midlatitude cyclones
Midlatitude cyclonesMidlatitude cyclones
Midlatitude cyclones
 
Atmospheric circulation-Climatology Chapter
Atmospheric circulation-Climatology ChapterAtmospheric circulation-Climatology Chapter
Atmospheric circulation-Climatology Chapter
 
fronts and mid latitude cyclones
fronts and mid latitude cyclonesfronts and mid latitude cyclones
fronts and mid latitude cyclones
 
Wind [autosaved]
Wind [autosaved]Wind [autosaved]
Wind [autosaved]
 
5
55
5
 
Atmospheric and Oceanic Circulation
Atmospheric and Oceanic CirculationAtmospheric and Oceanic Circulation
Atmospheric and Oceanic Circulation
 
Chapt35
Chapt35Chapt35
Chapt35
 
Air pressure
Air pressureAir pressure
Air pressure
 
Atmospheric circulation
Atmospheric circulationAtmospheric circulation
Atmospheric circulation
 
Earthquake
EarthquakeEarthquake
Earthquake
 
LeeSideTroughsGouldUpdate
LeeSideTroughsGouldUpdateLeeSideTroughsGouldUpdate
LeeSideTroughsGouldUpdate
 

Similar to ECWS Paper

ECWS Presentation
ECWS PresentationECWS Presentation
ECWS PresentationJoseph Egan
 
Atmosphere on the move
Atmosphere on the moveAtmosphere on the move
Atmosphere on the movethompsonlr
 
Understanding Cyclones. Cyclone Freddy being of interest
Understanding Cyclones. Cyclone Freddy being of interestUnderstanding Cyclones. Cyclone Freddy being of interest
Understanding Cyclones. Cyclone Freddy being of interestPeter Maphalla
 
Tropical cyclones and temperate cyclones
Tropical cyclones and temperate cyclonesTropical cyclones and temperate cyclones
Tropical cyclones and temperate cyclonesgeovino
 
Hurricane Theory
Hurricane  TheoryHurricane  Theory
Hurricane Theorymissm
 
Hurricanes
HurricanesHurricanes
HurricanesRaza Ch
 
Natural disaster earthquake
Natural disaster earthquake Natural disaster earthquake
Natural disaster earthquake Viranch Joshi
 
Earthquakes by Godwin Kyle Mangion, 3.03
Earthquakes by Godwin Kyle Mangion, 3.03Earthquakes by Godwin Kyle Mangion, 3.03
Earthquakes by Godwin Kyle Mangion, 3.03geographystudents
 
Pertemuan 03 front
Pertemuan 03 frontPertemuan 03 front
Pertemuan 03 frontEko Efendi
 
A_Partial_Mechanistic_Understanding_of_t
A_Partial_Mechanistic_Understanding_of_tA_Partial_Mechanistic_Understanding_of_t
A_Partial_Mechanistic_Understanding_of_tEhsan Erfani
 
A Pinatubo Climate Modeling Investigation
A Pinatubo Climate Modeling InvestigationA Pinatubo Climate Modeling Investigation
A Pinatubo Climate Modeling InvestigationJody Sullivan
 
4.5 Exploring Global Wind Patterns Pdf Presentation
4.5 Exploring Global Wind Patterns Pdf Presentation4.5 Exploring Global Wind Patterns Pdf Presentation
4.5 Exploring Global Wind Patterns Pdf Presentationastrickland230
 
Wind types by Group 2
Wind types by Group 2Wind types by Group 2
Wind types by Group 2e-twinning
 

Similar to ECWS Paper (20)

ECWS Presentation
ECWS PresentationECWS Presentation
ECWS Presentation
 
Atmosphere on the move
Atmosphere on the moveAtmosphere on the move
Atmosphere on the move
 
Understanding Cyclones. Cyclone Freddy being of interest
Understanding Cyclones. Cyclone Freddy being of interestUnderstanding Cyclones. Cyclone Freddy being of interest
Understanding Cyclones. Cyclone Freddy being of interest
 
Tropical cyclones and temperate cyclones
Tropical cyclones and temperate cyclonesTropical cyclones and temperate cyclones
Tropical cyclones and temperate cyclones
 
Hurricane Theory
Hurricane  TheoryHurricane  Theory
Hurricane Theory
 
Earthquakes
EarthquakesEarthquakes
Earthquakes
 
Hurricanes
HurricanesHurricanes
Hurricanes
 
SevereTCGeorge
SevereTCGeorgeSevereTCGeorge
SevereTCGeorge
 
Natural disaster earthquake
Natural disaster earthquake Natural disaster earthquake
Natural disaster earthquake
 
Tectonics, tectonophysics
Tectonics, tectonophysicsTectonics, tectonophysics
Tectonics, tectonophysics
 
Chapter seven
Chapter sevenChapter seven
Chapter seven
 
Natural disaster
Natural disasterNatural disaster
Natural disaster
 
Earthquakes by Godwin Kyle Mangion, 3.03
Earthquakes by Godwin Kyle Mangion, 3.03Earthquakes by Godwin Kyle Mangion, 3.03
Earthquakes by Godwin Kyle Mangion, 3.03
 
Pertemuan 03 front
Pertemuan 03 frontPertemuan 03 front
Pertemuan 03 front
 
A_Partial_Mechanistic_Understanding_of_t
A_Partial_Mechanistic_Understanding_of_tA_Partial_Mechanistic_Understanding_of_t
A_Partial_Mechanistic_Understanding_of_t
 
Cyclone
CycloneCyclone
Cyclone
 
Enso
EnsoEnso
Enso
 
A Pinatubo Climate Modeling Investigation
A Pinatubo Climate Modeling InvestigationA Pinatubo Climate Modeling Investigation
A Pinatubo Climate Modeling Investigation
 
4.5 Exploring Global Wind Patterns Pdf Presentation
4.5 Exploring Global Wind Patterns Pdf Presentation4.5 Exploring Global Wind Patterns Pdf Presentation
4.5 Exploring Global Wind Patterns Pdf Presentation
 
Wind types by Group 2
Wind types by Group 2Wind types by Group 2
Wind types by Group 2
 

ECWS Paper

  • 1. Egan 1 Joe Egan Professor Goebbert MET 373 April 24, 2015 East Coast Snowstorms: A General Overview I. Introduction East Coast Snow Storms (ECWSs; Hirsch et. al., 2001) are a clear and present threat to the Atlantic Coast of the United States, as the 1993 “Storm of the Century” clearly demonstrated. ECWSs are commonly known in the United States as “Nor’ Easters” due to their typical northeasterly track along the coast as well as the northeast winds that occur in their northwest quadrant (the portion which usually affects the East Coast). These storm systems are especially known for their tendency to “bomb out”, or experience a central pressure drop of at least 24 millibars in 24 hours, off the East Coast or Gulf Coast. For example, the 1993 ECWS (also known as the “Storm of the Century”) experienced a central pressure decrease of twenty-nine millibars in twenty-four hours (Kocin et. al. 1995). An extensive amount of research has been conducted about various aspects of ECWSs, including their basic storm types, cyclogenesis process, bombo-genesis and climatology/frequency. This paper will function as an overview of the research that has been completed over the past 60-70 years on ECWSs. Section II will examine a few factors responsible for the formation and explosive deepening of ECWSs and Section III will focus on ECWS criteria and storm types. Climatology of ECWSs will be discussed in Section IV, in addition to the effects of teleconnection patterns on the frequency and strength of the storms. A relatively new forecasting technique, which can better predict the impacts from ECWSs, will be looked at in Section V followed by a brief case study of the 1993 Storm of the Century (one of the most memorable and destructive ECWSs) in Section VI.
  • 2. Egan 2 II. Cyclogenesis and Bombo-genesis Factors ECWSs develop in very similar ways to other extra-tropical cyclones. They are, like land-based mid-latitude cyclones, driven by low-level temperature gradients and upper-level divergence. Most ECWSs develop in the lee of the Appalachian Mountains. As a vortex of air ascends the mountains, it is typically compressed along isentropic surfaces and as result spins less cyclonically or even anti-cyclonically. However, the vortex is typically stretched as it descends the mountains and spins more cyclonically. In the winter, cold air outbreaks and land- based mid-latitude cyclones combined with cold-core highs over the Unites States result in a rather tight temperature gradient between the land and the ocean (Miller 1946). The vortex can develop into a full-fledged cyclone upon encountering this temperature gradient. The fluxes of sensible and latent heat off the Atlantic Ocean, which are enhanced particularly by the Gulf Stream, also enhance cyclogenesis (Jacobs et. al., 2005). Heat fluxes combined with the orographic lift and descent of the vortex across the Appalachians work in tandem to develop mid-latitude cyclones along the East Coast of the U.S. (Denard and Ellenton 1979). However, the explosive deepening that is common of ECWSs cannot be explained by heat fluxes and orographic lift. Denard and Ellenton (1979) found that orographic lift could not explain the deepening because of the fact that ECWSs are usually over the ocean (well beyond the Appalachians) by the time they “bomb out”. In addition, heat fluxes were found by Denard and Ellenton (1979) to not be a factor in the explosive deepening due to the fact that, according to their own derivation, the Laplacian of the heat fluxes did not favor deepening at the cyclone’s center. Instead, Denard and Ellenton (1979) found that the rapid pressure fall at the centers of ECWSs is due to the combined effects of divergence aloft and lack of friction over the ocean. The latter tends to reduce low-level mass convergence, which, combined with strong divergence
  • 3. Egan 3 aloft, results in a strongly negative pressure tendency. While surface convergence is necessary for cyclogenesis (to enhance rising motion), too much can result in a net pressure rise at the surface which would weaken the cyclone. Another upper-level feature common in rapidly deepening ECWSs is a strong cyclonic vorticity advection maximum downstream of the surface low (typically at 500hPa). While vorticity advection cannot explain changes in the strength of an ECWS, differential cyclonic vorticity advection with height can enhance rising motion (according to the QG-Omega equation) and increase cyclogenesis. Therefore, a higher- magnitude differential cyclonic vorticity advection maximum is connected to an explosively deepening ECWS (Jacobs et. al. 2005). Warm air advection occurring at a level of strong differential cyclonic vorticity advection provides the other forcing necessary for rising motion. Jacobs et. al. (2005) also noted that ECWSs were more likely to undergo rapid deepening when crossing a strong sea-surface temperature gradient. III. ECWS Criteria and Storm Types The Glossary of Meteorology defines a Nor’ Easter as a cyclone forming between 30° and 40° North within 167km of the U.S. East Coast that moves in a north or northeasterly direction (Hirsch et. al. 2001). However, this definition was found by Hirsch et. al. (2001) to be too vague since it allowed tropical cyclones to be placed in this category as well as weaker mid- latitude cyclones that had little or no impact on life or property. Therefore, Hirsch et. al. (2001) came up with a new set of criteria for ECWS which has been accepted as the formal set of criteria by others involved in ECWS research, including Stuart and Grumm (2006). Hirsch et. al. (2001) defines an ECWS as an area of low pressure that: has a closed circulation, is located within the quadrilateral outlined by solid lines in Figure 1 (an ECWS can form within the dashed outlined area but must move into the solid outline area during its life cycle), moves in a general
  • 4. Egan 4 north to northeasterly direction, and contains maximum sustained winds greater than 20 knots for at least six consecutive hours. These criteria were used by Hirsch et. al. (2001) to identify ECWSs over a 48 year period including 1948 and 1951-1997, in which they identified 562 low- pressure systems as ECWSs. Within this set, they defined ECWSs with maximum sustained winds greater than 45 knots for at least six consecutive hours as “strong ECWSs” (Hirsch et. al. 2001). FIG. 1. Boundaries of area used to identify low pressure systems (dashed lines) and potential ECWS (solid lines). Courtesy: Hirsch et. al. (2001) While Hirsch et. al. (2001) came up with the most formal modern definition of ECWSs, groundbreaking research into the types of ECWSs as well as how and where each type originates was conducted by Miller (1946). While Miller’s research was limited in scope by the fact that upper-air data was almost non-existent in the 1940s, his work helped to identify the basic surface features of ECWSs and the regions in which they typically form. Two types of cyclones were
  • 5. Egan 5 identified by Miller (1946): Type-A and Type-B (now known as Miller type-A and Miller type- B; Stuart and Grumm 2006). Type-A storms typically form off the Gulf Coast or southeast Atlantic coast of the United States and track northeast, often affecting a large portion of the East Coast (Stuart and Grumm 2006). The 1993 “Storm of the Century” was a Miller type-A storm. Miller type-A storms typically form ahead of major cold outbreaks over the eastern United States (Miller 1946). The synoptic weather pattern prior to the formation of Miller type-A storms is typically characterized by a cold-core high pressure system over the Great Plains or Midwestern United States, with anti-cyclonic flow bringing cold air from Canada into the eastern U.S (see Figure 2). The cold, continental air-mass is met at or just off the coast by warm, moist air-mass (often enhanced by the Gulf Stream). As mentioned in Section II, if a vortex descending the Appalachian Mountains encounters this air-mass clash, a cyclone is likely to form. Hirsch et. al. (2001) defined their own storm types in their study, and Miller type-A storms are synonymous with Hirsch’s “full coast storm” type. Hirsch et. al. (2001) found that about two-thirds of the “strong ECWSs” that were identified in their study were full-coast storms.
  • 6. Egan 6 FIG. 2: Example of a Miller type-A storm just after cyclogenesis.Courtesy: Miller (1946) The second major type of ECWSs identified by Miller (1946) is known as Miller type-B. This type of cyclone is more common than Miller type-A and forms under a somewhat different synoptic setup. Prior to the formation of the Miller type-B storm, a land-based mid-latitude cyclone (‘primary cyclone”; Miller, 1946) that is either occluding or occluded is usually present over the Appalachian Mountains or eastern Great Lakes (see Figure 3). The cold air-mass north and east of the occluded front of the primary cyclone is typically trapped between the Appalachians and the East Coast, while a warm-moist current of air flowing along the coast creates a temperature front. As a the vortex associated with the primary cyclone descends the Appalachians and encounters this air-mass clash, a new low-pressure center often develops just off the East Coast and moves northeast. This “secondary cyclone” then often moves northeast and impacts mainly the mid-Atlantic and New England states (Miller 1946). Miller type-B storms compare well with Hirsch et. al.’s (2001) “northern storm” type.
  • 7. Egan 7 FIG. 3: Miller type-B storm just after origin. Courtesy: Miller (1946) Hirsch et. al. (2001) defined a third storm type, “southern storms”, which affect mainly the Gulf Coast and southeast United States while remaining south of 35° North. While these storms can and, in winter months, often do produce wintry precipitation if temperature profiles are favorable, Hirsch et. al. (2001) found that only 8% of the storms identified as ECWSs in their study were “southern storms”, making them by far the least common type. Due to the lack of research that has been conducted on southern storms and their overall rarity, this paper will focus on full coast and northern storms (Miller type-A and B). IV. Climatology of ECWSs Hirsch et. al. (2001) found that an average of 12 ECWSs occur each year between the months of October and April, based on their study and identification of ECWSs from 1948 and 1951-97, although there is high year-to year variability. Over half of these storms were found to be northern storms, with full coast storms second most frequent followed by southern storms.
  • 8. Egan 8 Table 1 lists the seasonal statistics for ECWSs according to the study by Hirsch et. al. (2001). Full coast storms were found to be slightly more common than Stuart and Grumm (2006) suggest. However, the higher numbers in Hirsch et. al. (2001) may have been caused by some ECWSs forming just south of 35° North and subsequently moving north of this line which would result in these ECWSs being classified as full coast. Each storm type was found by Hirsch et. al. (2001) to peak in a different month, as can be seen in Figure 4; overall storm activity was found to peak in January. The overall peak in activity in January is likely due to the fact that the tightest north-south temperature gradient exists over the United States during this period. The coldest temperatures of the season also typically occur in January, so the difference in temperature between land and ocean is the greatest during this particular month. Table 1: ECWS Seasonal Statistics from 1948 and 1951-1997, courtesy of Hirsch et. al. (2001).
  • 9. Egan 9 FIG. 4: Monthly distribution of storm totals divided by north (dark gray), south (white), and full coast (gray) ECWS. Relative percentages ofeach storm type are shown inside each bar. Courtesy: Hirsch et. al. (2001) The high year-to-year variability is often caused by the various teleconnection patterns, which can significantly affect winter temperatures and jet stream placement over the United States. Figure 5 shows how ECWS frequency varies with the phase of El Niño-Southern Oscillation (ENSO), as observed by Hirsch et. al. (2001). Overall storm frequency often increases considerably during El Niño winters, and all types of ECWS experience an increase based on Hirsch’s findings except for northern storms. These results were linked by Hirsh et. al. (2001) to the fact that the subtropical (southern branch) of the jet stream is usually stronger during El Niño winters whereas the polar jet is typically further north. This pattern, according to Hirsch, may favor cyclogenesis off the Gulf Coast and southeast Atlantic coast of the U.S. La
  • 10. Egan 10 Niña conditions do not have quite as clear of an effect on ECWS frequency, according to Hirsch et. al. (2001). A slight increase in overall activity is still evident, but the frequency of southern storms decreases significantly while full coast storm frequency does not change all that much. Only northern storms experience a significant increase in frequency, according the study of Hirsch et. al. (2001). The increase in northern storm activity during La Niña winters is, according to Hirsch, likely due to the polar jet being further south (often over the northeastern United States) during such winters. However, the authors of this study and an additional study (Hirsch et. al. 2002) are still uncertain about the physical forcings behind the changes in ECWS frequency during La Niña. The uncertainty exists mainly because the effects of La Niña conditions in the eastern equatorial Pacific on temperatures in the United State and Atlantic Ocean are not consistent as some such winters have been warmer than normal while others have been colder. Some uncertainty does exist regarding the physical forcing behind the effects of El Niño winters on ECWS frequency as well though more consistencies exist here than with La Niña. Further research will likely have to be conducted to confirm how ENSO physically affects ECWS frequency.
  • 11. Egan 11 FIG 5: Test statistics, t, comparing the average frequency anomalies of ECWS during ENSO months to those during neutral months over the Oct–Apr period. Positive (negative) values indicate a(n) increase (decrease) in frequency anomalies. The 5% level of significance based on a two-tailed hypothesis test using the normal distribution is denoted for reference. The p values obtained using resampling appear on selected bars. Courtesy: Hirsch et. al. (2001) Other teleconnection patterns, such as the North Atlantic Oscillation (NAO), were also found to be tied to ECWS frequency, although these connections are even more unclear. Regardless, Hirsch et. al. (2002) found that, in general, warm sea-surface temperature (SST) anomalies off the southeast U.S coast in the summer (common with the positive NAO phase) tend to lead to active ECWS seasons, while cold SST anomalies off the southeast U.S. coast in the summer (common with the negative phase of the NAO) tend to be followed by relatively inactive ECWS seasons. The SST gradient is typically maximized when the Atlantic waters off the SE U.S. coast are warmer, which, as mentioned previously, is tied to increased cyclogenesis. Additional research could make the use of these teleconnection pattern indices useful in predicting the ECWS activity for the upcoming season, but exact location of the storm track will be critical to determining impacts such as snow totals.
  • 12. Egan 12 V. Forecasting ECWS Impacts Predicting the potential impacts of ECWS can be just as challenging as predicting their seasonal frequency. While observed data and numerical weather prediction (NWP) models do provide valuable information and guidance regarding current and possible near-future impacts, neither type of data gives the forecaster a clear idea of how much of a departure from normal that an ECWS represents. Furthermore, additional data is needed to allow the forecaster to meaningfully discern the potential for an ECWS to produce significant amounts of snow based on physical forcing. Studies by Stuart and Grumm, disseminated in 2004 and 2006, found that the use of 850hPa and 300hPa wind anomaly data from NWP models will assist forecasters in predicting the impacts of ECWS, especially precipitation intensity and duration. Low-level (850hPa) wind anomalies were found by Stuart and Grumm (2004) to be helpful in determining precipitation intensity for an ECWS. They determined that the location of easterly (-u direction) wind anomalies of at least four standard deviations below normal (strong easterly winds) at 850hPa was often the location of the most intense precipitation associated with an ECWS. Such anomalies are typically located to the north of an ECWS and were found by Stuart and Grumm (2004) to be indicative of strong moisture advection off the Atlantic Ocean, low-level convergence, and enhanced low-level frontogenesis. The latter two factors contribute to increased rising motion; all three factors contribute to intense precipitation. This precipitation may be snow if the temperature profiles are supportive. It is important to note that the same approach was found by Stuart and Grumm (2006) to work for determining heavy rain as well. While low-level wind anomalies help forecasters indicate the greatest potential for heavy precipitation, upper-level easterly wind anomalies (250-300hPa) were found by Stuart and Grumm (2004) to be helpful in determining whether or not the ECWS is cutoff from the
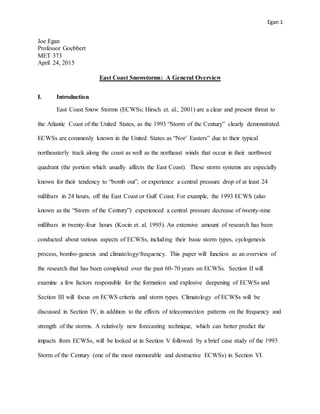
  • 13. Egan 13 predominant westerly flow and, therefore, likely to produce prolonged periods of potentially heavy precipitation since the system is slow-moving. Easterly wind anomalies at 250-300hPa of at least 2-2.5 standard deviations below normal were found to indicate that the system is likely cutoff from the westerly flow. Where strong easterly wind anomalies at 850hPa and 250-300hPa are co-located, Grumm and Stuart (2004) found that prolonged periods of heavy precipitation (snow if temperature profiles supported this precipitation type) could be expected. An example of strong 850hPa and 250hPa easterly wind anomalies being co-located in association with an ECWS can be found in Figures 6 (850hPa) and 7 (300hPa), courtesy of Stuart and Grumm (2006). These images are from the Christmas 2002 ECWS and are forecasts from the Eta model of u-winds and anomalies from 850hPa and 300hPa, respectively. The locations in which the strongest easterly wind anomalies were forecast did not receive the heaviest snow due to mild temperatures changing the precipitation to rain or ice at times. However, the heaviest snow (nearly 100cm, or over three feet) fell between Binghamton and Albany, New York, where 850hPa u-wind anomalies were forecast to be between three and four standard deviations below normal and 250hPa u-wind anomalies were progged to be between two and three standard deviations below normal (Stuart and Grumm 2006). The heaviest snow fell where the strongest upper-level and lower-level easterly wind anomalies were co-located.
  • 14. Egan 14 FIG 7-8: Eta 6-h forecast valid at 0000 UTC 26 Dec 2002 of 850-hPa heights (m; heavy solid), U winds (kt) and anomalies (standard deviations from normal, shaded) (Above) and 250-hPa heights (m; heavy solid), U winds (kt) and anomalies (standard deviations from normal, shaded) (Below). Courtesy: Stuart and Grumm (2006).
  • 15. Egan 15 It is important to note that u-wind anomalies should always be used in tandem with other types of data, like observed data and model output of other fields, to ensure the most accurate and complete forecast. Stuart and Grumm (2004) also point out that the accuracy of wind anomalies in predicting ECWS impacts still does depend on the accuracy of the model output, which should always be quality-checked by the forecaster. VI. 1993 “Storm of the Century” One of the most memorable ECWSs on record occurred on 12-14 March 1993 and impacted the entire East Coast of the United States (Kocin et. al 1995). The storm’s track from the Gulf of Mexico across Florida and up the East Coast (Figure 8) makes it a classic example of a Miller type-A, or full coast, storm. The storm experienced its most explosive deepening over the Gulf of Mexico. This is likely because the right entrance region of one jet streak over the eastern U.S. and the left exit region of another jet streak over the western U.S. were co-located (Figure 9), resulting in jet coupling and maximized divergence aloft. The divergence combined with the lack of friction over the Gulf contributing to less convergence at the surface likely led the cyclone’s central pressure to fall 17mb in 12 hours and 29mb in 24 hours (Kocin et. al., 1995). At 850hPa, very strong winds were present, most notably at 12 UTC 13 March and 00 UTC 14 March, as can be seen by the extremely tight height gradient (Figures 10 and 11). While these figures do not show wind anomalies, the very strong winds can safely be assumed to be a significant departure from normal and thus likely sufficient to promote heavy precipitation north of the cyclone. Upper-level (300hPa) wind data were not accessible for this ECWS, however the strength of the system alone was sufficient to produce heavy precipitation for long enough of a period to cause crippling impacts along the entire East Coast. As Figure 12 shows, the heavy
  • 16. Egan 16 precipitation fell as snow as far south as Alabama and Georgia; there were even reports of snowflakes in northern portions of Florida (Kocin et. al. 1995). FIG 8: 12-14 March 1993 ECWS Track. Courtesy: University of Illinois, Urbana-Champaign. FIG 9: 500hPa heights and winds 13 March 00 & 12 UTC courtesy: Kocin et. al. (1994)
  • 17. Egan 17 FIG 10: 850hPa 12 UTC 13 March Courtesy: Kocin et. al. (1995) FIG 11: 00 UTC March 14 Courtesy: Kocin et. al. (1995)
  • 18. Egan 18 FIG 12: 1993 ECWS Snow totals (filled) and stormtrack (dashed red). Courtesy: AccuWeather.com VII. Conclusion East Coast Winter Storms (ECWSs) pose a significant threat to life and property each winter along the East Coast of the United States. A variety of factors are responsible for their development and “bombo-genesis”, including orographic lift, heat fluxes, and lack of friction over the ocean combined with divergence aloft. Two most common types of ECWSs exist, with a third (southern) type not nearly as common as the other two. While ECWS activity typically peaks in January, these storms can occur throughout the winter months as well as during the transition months; the 1993 Storm of the Century is one example of a powerful ECWS which occurred during a transition month (March). Using wind anomalies in tandem with observed data and model output will help meteorologists continue to improve their ability to predict the impacts of ECWSs as well as their confidence in predicting ECWS impacts in advance.
  • 19. Egan 19 References: Danard, M.B and G.L. Ellenton, 1980: Physical Influences on East Coast Cyclogenesis. Atmosphere-Ocean, 18, 65-82 Hirsch, M., A. DeGaetano, and S. Colucci, 2000: An East Coast Winter Storm Climatology. J. Climate, 14, 882-899. DeGaetano, A., M. Hirsch, and S. Colucci, 2001: Statistical Prediction of Seasonal East Coast Winter Storm Frequency. J. Climate, 15, 1101-1117. Jacobs, Neil A., Gary M. Lackmann, and Sethu Raman, 2005: The Combined Effects of Gulf Stream–Induced Baroclinicity and Upper-Level Vorticity on U.S. East Coast Extratropical Cyclogenesis. Mon. Wea. Rev., 133, 2494–2501. Kocin, P. J., P. N. Schumacher, R. F. Morales, and L. W. Uccellini, 1995: Overview of the 12– 14 March 1993 Superstorm. Bull. Amer. Meteor. Soc., 76, 165–182. Miller, James E., 1946: Cyclogenesis in the Atlantic Coastal Region of the United States. J. Meteor., 3, 31–44, Stuart, Neil A. and Richard Grumm, 2004: Evaluating Potential Impact of Significant East Coast Winter Storms by Analysis of Upper and Low-level Wind Anomalies. Preprints. 20th Conf. on Weather Analysis and Forecasting, Seattle, WA, Amer. Meteor. Soc., CD- ROM, 9.2. Stuart, N. and Richard Grumm, 2006: Using Wind Anomalies to Forecast East Coast Winter Storms. Weather and Forecasting, 21, 952-964, 966-968.