1. The document examines the meteorological impact of mesoscale lee troughs formed along the lee side of the Ouachita Mountains in southeast Oklahoma and western Arkansas.
2. It finds that southerly or southeasterly winds blowing across the mountain range can cause blocking of the airflow, leading to the formation of a lee trough with lower surface pressures on the lee side.
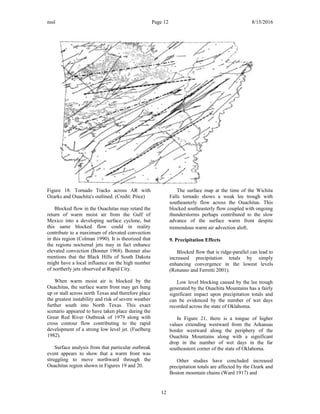
3. This lee trough has significant meteorological effects on the region, influencing wind patterns, pressure fields, and severe weather potential.


![nssl Page 8 8/15/2016
speeds and air flow is then able to more easily
advect northward over the Ouachita Mountains.
Figure 10: Froude results of SE Wind at 8m/s.
(Credit: UCAR)
Figure 11: Froude results of SE Wind at 13m/s.
(Credit: UCAR)
6. Gravity Waves
In the earth's atmosphere, gravity waves are a
physical process that produces the transferal or
exchange of force. The Glossary of Meteorology
(Glickman 2000) defines a gravity wave as “a
wave disturbance in which buoyancy (or reduced
gravity) acts as the restoring force on parcels
displaced from hydrostatic equilibrium.”
Generally, gravity waves in the troposphere are
caused by either mountain or frontal systems.
Lee waves formed by the blocking effect of
mountains can be mathematically represented in
equation 3.
2πV [T /g (γd−γ)]1/ 2 (3)
Where V is the current speed, T the
temperature in Kelvin, g the acceleration of
gravity, and d and the dry adiabatic and
environmental lapse rates respectively.
There are two types of mountain waves,
trapped or vertical propagating waves. Trapped
waves are more common with the Ouachitas and
this is because the wind speed above the
mountains increases sharply and stability
decreases in the atmosphere above the mountain
top stable layer.
8](https://image.slidesharecdn.com/fb47243a-ce6a-423d-bb27-88b75b807c02-161114230206/85/LeeSideTroughsGouldUpdate-8-320.jpg)

![nssl Page 14 8/15/2016
Figure 21: Map of number of % wet days in OK.
(Credit: Daly 2007)
10. Summary
The Ouachita Mountains in southeast
Oklahoma and western Arkansas have a sizable
impact upon various climate and meteorological
phenomena including wind and temperature
climatology, rainfall patterns, atmospheric
pressure, severe weather and winter weather
climatology.
These effects while small can have
significant impacts and implications in a
forecasting environment where detailed and
mesoscale factors need to be considered when
issuing a forecast or when long term
climatological considerations are taken into
account.
It is hoped that this paper has demonstrated
the need to consider that small mountain ranges
are just as important to making local and
mesoscale forecasts as the synoptic and larger
scale features.
It is suggested that other smaller mountain
ranges such as the Black Hills in South Dakota,
the Ozarks and St. Francois in Missouri, and
Misquah Hills or Lutsen Mountains in Minnesota
be important ranges in the local climatology and
meteorology of those regions worthy of study.
ACKNOWLEDGMENTS
The author would first like to thank my wife
Susan whose unwavering support over these last
few years in the online meteorology program has
been most appreciated. Steve Piltz,
Meteorologist In Charge (MIC) of the Tulsa
National Weather Service Office (NWSFO)
whose help in providing guidance and
suggestions was very gratifying. Kevin Lux of
VeroTech lent helpful ideas and reviews when
this work was first presented. The staff at the
Oklahoma Mesonet helped provide data and
steer this research toward operationally
important issues.
REFERENCES
American Meteorological Society, cited 2000:
"lee trough". Glossary of Meteorology.
[Available online at
http://glossary.ametsoc.org/wiki/”lee
trough”]
Arkansas State Parks, cited 2005: "Arkansas'
Highpoint Information” [Available online at
https://www.arkansasstateparks.com/!
userfiles/pdfs/MM%20Highpoint%20bro
%2005.pdf]
Bikos, D., Weaver, J., & Motta, B. 2002: A
satellite perspective of the 3 May 1999 Great
14](https://image.slidesharecdn.com/fb47243a-ce6a-423d-bb27-88b75b807c02-161114230206/85/LeeSideTroughsGouldUpdate-14-320.jpg)
![nssl Page 15 8/15/2016
Plains tornado outbreak within Oklahoma.
Weather and Forecasting, 17, 635-646.
Bonner, William D. 1968: "Climatology of the
low level jet." Mon. Wea. Rev., 96, no. 12,
833-850.
Burgess, D., cited 2014: “The April 10, 1979
Severe Weather Outbreak” [Available online
at http://www.srh.noaa.gov/oun/?n=events
19790410]
Colman, B. R., 1990: Thunderstorms above
frontal surfaces in environments without
positive CAPE. Part I: A climatology. Mon.
Wea. Rev., 118, 1103–1121
Dixon, P. Grady, Andrew E. Mercer, Jinmu
Choi, and Jared S. Allen. "Tornado risk
analysis: is Dixie Alley an extension of
Tornado Alley?."Bulletin of the American
Meteorological Society., 92, no. 4 (2011):
433.
Dale R., and Joseph B. Klemp. 1982: The effects
of moisture on trapped mountain lee waves.
J. Atmos. Sci., 39, 2490-2506.
Daly, C., Gibson, W.P., Taylor, G.H., Doggett,
M.K. and Smith, J.I., 2007: Observer bias in
daily precipitation measurements at United
States cooperative network stations. Bulletin
of the American Meteorological Society,
88(6), p.899-912.
Durran, Dale R., and Joseph B. Klemp. 1982:
The effects of moisture on trapped mountain
lee waves. J. Atmos. Sci., 39, 2490-2506.
Egger, J., 1974: Numerical experiments on lee
cyclogenesis. Mon. Wea. Rev., 102, 847-860.
Fuelberg, H. E., & Jedlovec, G. J. 1982: A
subsynoptic-scale kinetic energy analysis of
the Red River Valley tornado outbreak
(AVE-SESAME I). Mon. Wea. Rev., 110,
2005-2024.
Fujita, T. T., and R. M. Wakimoto, 1982: Effects
of miso- and mesoscale obstructions on PAM
winds obtained during Project NIMROD. J.
Appl. Meteor., 21, 840–858.
Gould, S.L., cited 2016: “Ouachita ASOS
Locations” [Available online at
https://www.google.com/maps/@35.2562861
,-95.571022,8z/data=!3m1!4b1!4m2!6m1!
1s1Ur43Wd3-67Qb60efotxnPBXfaJE?hl=en
]
Muller, B., University Corporation for
Atmospheric Research, cited 2007:
"Mountain and Lee Waves in Satellite
Imagery” [Available online at
http://wx.db.erau.edu/faculty/mullerb/Wx365
/Mountain_waves/mountain_waves.html ]
National Weather Service, cited 1999:
"Automated Surface Observing System”
[Available online at
https://www.nws.noaa.gov/ost/asostech,html
” ]
Oklahoma Meosnet, cited 2016: "Sea-Level
Pressure” [Available online at
http://www.mesonet.org/index.php/weather/
map/sea_level_pressure_map_inhg/pressure ]
Price, L. W., 1981: Mountains and Man: A Study
of Process and Environment., University of
California Press., 64-65 pp.
Rotunno, R., and R. Ferretti, 2001: Mechanisms
of intense Alpine rainfall. J. Atmos. Sci., 58,
1732–1749 Shipman, T. G., 1925: The east
wind and its lifting effects at Forth Smith,
Arkansas. Mon. Wea. Rev., 53, 536-539.
Smebye, S. J., 1958: Computation of
precipitation from large-scale vertical
motion. J. Meteor., 15, 547-560.
Steenburgh, W. J., and C. F. Mass, 1994: The
structure and evolution of a simulated Rocky
Mountain lee trough. Mon. Wea. Rev., 122,
2740–2761.
United States Geological Survey, cited 2016:
"Water Resources NSDI Node”
Physiographic divisions of the conterminous
U.S. [Available online at
15](https://image.slidesharecdn.com/fb47243a-ce6a-423d-bb27-88b75b807c02-161114230206/85/LeeSideTroughsGouldUpdate-15-320.jpg)
![nssl Page 16 8/15/2016
http://water.usgs.gov/GIS/metadata/usgswrd/
XML/physio.xml” ]
University Center for Atmospheric Research,
cited 2006: "Froude Calculator” Landfalling
Fronts and Cyclones. [Available online at
https://www.meted.ucar.edu/mesoprim/lff/fro
ude_calc.htm” ]
University of Arkansas Dept. of Archaeology:
cited 2016: "Arkansas Novaculite”
[Available online at
http://archeology.uark.edu/novaculite/images/
PhysiographicMap.jpg” ]
University of Wyoming Dept. of Atmospheric
Science: cited 2016: "Upper Air Soundings”
[Available online at
http://weather.uwyo.edu/upperair/sounding.ht
ml” ]
Ward, R. De C., 1917: General Meteorology;
Mean Annual Rainfall of the United States.
Mon. Wea. Rev., 45, 338-345.
16](https://image.slidesharecdn.com/fb47243a-ce6a-423d-bb27-88b75b807c02-161114230206/85/LeeSideTroughsGouldUpdate-16-320.jpg)


![Wind [autosaved]](https://cdn.slidesharecdn.com/ss_thumbnails/windautosaved-180708133944-thumbnail.jpg?width=640&height=640&fit=bounds)


