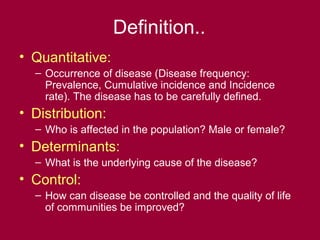
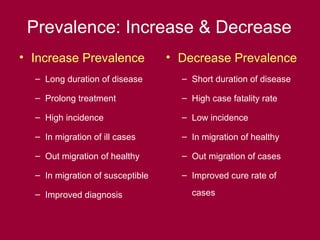
Community Ophthalmology
J. B. Chand, DCEH
Outreach Coordinator
Himalaya Eye Hospital
Pokhara, Nepal
Epidemiology
• It was in 400 B.C, Hippocrates (A Greek
physician) used the term “EPIDEMEION’’
to describe the disease that visit the
community.
• Described distribution by season, age,
climate, body build and habit.
Definition
• Epidemiology can be defined as the
Quantitative study of the Distribution,
Determinants and Control of the
diseases in populations.
Definition..
• Quantitative:
– Occurrence of disease (Disease frequency:
Prevalence, Cumulative incidence and Incidence
rate). The disease has to be carefully defined.
• Distribution:
– Who is affected in the population? Male or female?
• Determinants:
– What is the underlying cause of the disease?
• Control:
– How can disease be controlled and the quality of life
of communities be improved?
Disease Frequency
• The fundamental task in any
epidemiological study is to measure the
occurrence of disease in population
(Disease frequency)
• There are 3 basic related measures of
disease frequency:
– Prevalence - How many NOW % (New & Old cases)
– Cumulative Incidence % (Also known as risk)
– Incident Rate % - Also known as rate (New case only)
Prevalence
• “The proportion of people who have the
disease at the specified point in time”
• Prevalence is usually measured in cross-
sectional studies (Surveys).
• Prevalence is usually presented as a
percentage (number per 100). Very rare
disease it may be presented per 1000.
Prevalence..
• Prevalence is calculated as: a/a+b*100%
• Where,
a =Number of diseased persons (numerator)
b =Number of none diseased person
a+b =Total number of person examined
(denominator)
Blind Not Blind Total
12 1800 1812
Prevalence of blindness:12/1812*100 =0.66%
Cumulative Incidence
• “The proportion of people who develop a
particular condition or disease in a
specified period of time”
• Who were disease free at the beginning
but were at risk of the disease.
• It can be measured in longitudinal
cohort studies.
Cumulative Incidence…
• Calculated as: a/a+b*100% per year or
month
• Where,
a =Number of persons who develop the disease
(numerator)
b =Number of person who do not develop
disease
a+b =Total number of person initially at risk
(denominator)
Cumulative Incidence…
– A longitudinal study with a sample of 620 people aged
40-45 were examined for glaucoma and found none
of them have glaucoma
– The same people were examined 2 year later and 5
were found to have developed glaucoma. None of
original cohort had died or migrated.
• The 2 year cumulative incidence is,
5/620*100% =0.8%
• The 1 year cumulative incidence is,
=0.4% per year
Incident Rate
• This is “Measure of the speed at which a
disease develops in a population”
• It is a rate and when expressed should
always include the “person time at risk”
• Incident rate is true rate since other
measure are only proportion
• Calculated as:
Number of new cases occurring during the follow up period
Total person time (years, months) at risk
Prevalence: Increase & Decrease
• Increase Prevalence
– Long duration of disease
– Prolong treatment
– High incidence
– In migration of ill cases
– Out migration of healthy
– In migration of susceptible
– Improved diagnosis
• Decrease Prevalence
– Short duration of disease
– High case fatality rate
– Low incidence
– In migration of healthy
– Out migration of cases
– Improved cure rate of
cases
Exposure and Outcome
• In any epidemiological study, there are 3
factors which needs to be measured:
– Primary exposure
– Outcome
– Other exposure which may influence the
outcome (Confounders)
Exposure
• Exposure encompass factors that may be
associated with condition or disease of
interest or health
• Common Exposures are:
– Chemical (Dyes, pesticides, Industrial chemical)
– Genetic (HLA type)
– Medical (Previous immunization)
– Behavioral (Smoking, Alcoholic, Exercise, Diet)
– Age and Sex
• Important to identify the main exposure
Outcome
• The outcome measured in a study may
be,
Disease, Disability, Health and Death
• Outcome should be carefully defined and
measurable
• Out of many outcome, identify the main
outcome
Confounder
• A confounder is a risk factor for the
outcome of interest and can give totally
misleading result in the studies
• Example:
– Smoking ALCOHOL Stomach ulcer
– Malnutrition MEASLES Vitamin A deficiency
CONFOUNDERS
Thank You

Epidemiology

  • 1.
    Community Ophthalmology J. B.Chand, DCEH Outreach Coordinator Himalaya Eye Hospital Pokhara, Nepal
  • 2.
    Epidemiology • It wasin 400 B.C, Hippocrates (A Greek physician) used the term “EPIDEMEION’’ to describe the disease that visit the community. • Described distribution by season, age, climate, body build and habit.
  • 3.
    Definition • Epidemiology canbe defined as the Quantitative study of the Distribution, Determinants and Control of the diseases in populations.
  • 4.
    Definition.. • Quantitative: – Occurrenceof disease (Disease frequency: Prevalence, Cumulative incidence and Incidence rate). The disease has to be carefully defined. • Distribution: – Who is affected in the population? Male or female? • Determinants: – What is the underlying cause of the disease? • Control: – How can disease be controlled and the quality of life of communities be improved?
  • 5.
    Disease Frequency • Thefundamental task in any epidemiological study is to measure the occurrence of disease in population (Disease frequency) • There are 3 basic related measures of disease frequency: – Prevalence - How many NOW % (New & Old cases) – Cumulative Incidence % (Also known as risk) – Incident Rate % - Also known as rate (New case only)
  • 6.
    Prevalence • “The proportionof people who have the disease at the specified point in time” • Prevalence is usually measured in cross- sectional studies (Surveys). • Prevalence is usually presented as a percentage (number per 100). Very rare disease it may be presented per 1000.
  • 7.
    Prevalence.. • Prevalence iscalculated as: a/a+b*100% • Where, a =Number of diseased persons (numerator) b =Number of none diseased person a+b =Total number of person examined (denominator) Blind Not Blind Total 12 1800 1812 Prevalence of blindness:12/1812*100 =0.66%
  • 8.
    Cumulative Incidence • “Theproportion of people who develop a particular condition or disease in a specified period of time” • Who were disease free at the beginning but were at risk of the disease. • It can be measured in longitudinal cohort studies.
  • 9.
    Cumulative Incidence… • Calculatedas: a/a+b*100% per year or month • Where, a =Number of persons who develop the disease (numerator) b =Number of person who do not develop disease a+b =Total number of person initially at risk (denominator)
  • 10.
    Cumulative Incidence… – Alongitudinal study with a sample of 620 people aged 40-45 were examined for glaucoma and found none of them have glaucoma – The same people were examined 2 year later and 5 were found to have developed glaucoma. None of original cohort had died or migrated. • The 2 year cumulative incidence is, 5/620*100% =0.8% • The 1 year cumulative incidence is, =0.4% per year
  • 11.
    Incident Rate • Thisis “Measure of the speed at which a disease develops in a population” • It is a rate and when expressed should always include the “person time at risk” • Incident rate is true rate since other measure are only proportion • Calculated as: Number of new cases occurring during the follow up period Total person time (years, months) at risk
  • 12.
    Prevalence: Increase &Decrease • Increase Prevalence – Long duration of disease – Prolong treatment – High incidence – In migration of ill cases – Out migration of healthy – In migration of susceptible – Improved diagnosis • Decrease Prevalence – Short duration of disease – High case fatality rate – Low incidence – In migration of healthy – Out migration of cases – Improved cure rate of cases
  • 13.
    Exposure and Outcome •In any epidemiological study, there are 3 factors which needs to be measured: – Primary exposure – Outcome – Other exposure which may influence the outcome (Confounders)
  • 14.
    Exposure • Exposure encompassfactors that may be associated with condition or disease of interest or health • Common Exposures are: – Chemical (Dyes, pesticides, Industrial chemical) – Genetic (HLA type) – Medical (Previous immunization) – Behavioral (Smoking, Alcoholic, Exercise, Diet) – Age and Sex • Important to identify the main exposure
  • 15.
    Outcome • The outcomemeasured in a study may be, Disease, Disability, Health and Death • Outcome should be carefully defined and measurable • Out of many outcome, identify the main outcome
  • 16.
    Confounder • A confounderis a risk factor for the outcome of interest and can give totally misleading result in the studies • Example: – Smoking ALCOHOL Stomach ulcer – Malnutrition MEASLES Vitamin A deficiency CONFOUNDERS
  • 17.