1. M:FoodMicrobiology
&Safety
Survival of Escherichia coli O157:H7 in Cucumber
Fermentation Brines
Frederick Breidt, Jr. and Jane M. Caldwell
Abstract: Bacterial pathogens have been reported on fresh cucumbers and other vegetables used for commercial fer-
mentation. The Food and Drug Administration currently has a 5-log reduction standard for E. coli O157:H7 and other
vegetative pathogens in acidified pickle products. For fermented vegetables, which are acid foods, there is little data doc-
umenting the conditions needed to kill acid resistant pathogens. To address this knowledge gap, we obtained 10 different
cucumber fermentation brines at different stages of fermentation from 5 domestic commercial plants. Cucumber brines
were used to represent vegetable fermentations because cabbage and other vegetables may have inhibitory compounds
that may affect survival. The 5-log reduction times for E. coli O157:H7 strains in the commercial brines were found to be
positively correlated with brine pH, and ranged from 3 to 24 d for pH values of 3.2 to 4.6, respectively. In a laboratory
cucumber juice medium that had been previously fermented with Lactobacillus plantarum or Leuconostoc mesenteroides (pH
3.9), a 5-log reduction was achieved within 1 to 16 d depending on pH, acid concentration, and temperature. During
competitive growth at 30 ◦
C in the presence of L. plantarum or L. mesenteroides in cucumber juice, E. coli O157:H7 cell
numbers were reduced to below the level of detection within 2 to 3 d. These data may be used to aid manufacturers of
fermented vegetable products determine safe production practices based on fermentation pH and temperature.
Keywords: cucumbers, E. coli O157:H7, fermentation brine, fermented vegetables, survival times
Practical Application: Disease causing strains of the bacterium E. coli may be present on fresh vegetables. Our investigation
determined the time needed to kill E. coli in cucumber fermentation brines and how E. coli strains are killed in competition
with naturally present lactic acid bacteria. Our results showed how brine pH and other brine conditions affected the
killing of E. coli strains. These data can be used by producers of fermented vegetable products to help assure consumer
safety.
Introduction
Acid-resistant, vegetative bacterial pathogens can be present on
fresh produce and ingredients that are used in the manufacture
of fermented and acidified foods. The microflora on fresh fruits,
grains, and vegetables can range from 102
to 109
colony form-
ing units (CFU) per gram (Lund 1992; Nguyen-the and Carlin
1994). On pickling cucumbers, the aerobic microflora are usu-
ally between 104
and 106
CFU/g with lactic acid bacteria (LAB)
around 10 to 104
CFU/g (Fleming and others 1995). A variety
of pathogens, including Salmonella and Shigella species, Aeromonas
hydrophila, Yersinia enterocolitica, Staphylococcus aureus, Campylobacter,
Listeria monocytogenes, E. coli, including acid-resistant enterohem-
orrhagic O157:H7, O145, and other pathogenic serotype strains,
MS 20100970 Submitted 8/27/2010, Accepted 12/21/2010. Authors are with
USDA-ARS, SAA Food Science Research Unit, 322 Schaub Hall, Box 7624,
North Carolina State Univ., Raleigh, NC 27695-7624, U.S.A. Direct inquiries to
author Breidt (E-mail: Fred.Breidt@ars.usda.gov).
Paper nr FSR10-21 of the Journal Series of the Dept. of Food, Bioprocessing
and Nutrition Sciences North Carolina State Univ., Raleigh, NC 27695-7624.
Mention of a trademark or proprietary product does not constitute a guarantee
or warranty of the product by the U.S. Dept. of Agriculture or North Carolina
Agricultural Research Service, nor does it imply approval to the exclusion of
other products that may be suitable.
may be present on vegetables that are used in ready-to-eat and
processed foods (Beuchat 1996, 2002; Brackett 1999; Taormina
and Beuchat 1999). Removal of pathogenic and spoilage bacte-
ria from fresh fruits and vegetables prior to processing is difficult.
Biofilms containing bacteria on fruits and vegetables may be more
resistant to sanitizing agents and organic acid treatments than free
or planktonic cells (Kumar and Anand 1998; Bower and Daeschel
1999; Riordan and others 2001; Sapers 2001). Washing proce-
dures with water or chemical sanitizers typically result in only a 1-
to 2-log decrease in bacterial cell numbers, and bacteria may be
protected in inaccessible locations on fruits and vegetables, such as
the core and calyx of apples (Riordan and others 2001). Attach-
ment of bacteria to wounded or cut surfaces, or entry of bacteria
into the interior of fruits and vegetables through stomata may oc-
cur (Daeschel and Fleming 1981; Seo and Frank 1999; Takeuchi
and Frank 2000; Reina and others 2002). As a result of large
scale commercial processing of vegetables, the spread of pathogens
may occur. Disease outbreaks have occurred in some acid foods
such as apple cider and apple juice (Besser and others, 1993; CDC,
1996), which have pH values around 3.7, similar to many acidified
vegetable products.
Acid and acidified foods are defined in the United States Code
of Federal Regulations (21 CFR part 114) as having a pH value
of ≤ 4.6. This is the pH upper limit that prevents Clostridium
botulinum spore outgrowth and neurotoxin production (Ito and
Journal compilation C 2011 Institute of Food Technologists R
No claim to original US government works
M198 Journal of Food Science r Vol. 76, Nr. 3, 2011 doi: 10.1111/j.1750-3841.2011.02045.x
Further reproduction without permission is prohibited
2. M:FoodMicrobiology
&Safety
Survival of E. coli in brines . . .
others 1976). Acidified foods, to which acid or acid food ingredi-
ents are added to lower the pH below 4.6, include pickled vegeta-
bles sold in hermetically sealed (anaerobic) containers. While the
focus of the regulation is to prevent the growth of C. botulinum
and toxin production, 21 CFR part 114 specifies processing of
acidified foods “to the extent that is sufficient” to destroy vegeta-
tive cells of microorganisms of public health significance. Acidified
vegetable products can be heat processed to assure shelf stability
and safety; and the times and temperatures needed for that pur-
pose have been reported (Breidt and others 2005; Breidt 2006),
and a 5-log reduction standard has been adapted by FDA (Breidt
and others 2010). However, up to half of the $1.5 billion per year
pickled vegetable market consists of products that are preserved
without thermal processing, including fermented products, which
are naturally acidified and defined as acid foods.
Low pH (3 to 4) and organic acids in acidified and fermented
vegetable products prevents the growth of bacterial pathogens and
results in pathogen death. These products have an excellent history
of consumer safety, but definitive data are lacking to show that E.
coli O157:H7, L. monocytogenes, and Salmonella enterica will die off
over the range of conditions under which commercial fermenta-
tions occur. Previous research has shown that E. coli O157:H7 is
the most acid resistant pathogen of concern in acidified vegetables,
and for nonheat processed acidified vegetables containing acetic
acid (pH 3.3 or below), the holding times needed to assure de-
struction of this pathogen are 6 d at 10 ◦
C and 2 d at 25 ◦
C (Breidt
and others 2007). No research has been done to determine the
survival of acid-resistant vegetative pathogens in vegetable fermen-
tations. Of particular concern are fermentations conducted under
colder temperatures such as 10 ◦
C, which increases the survival of
E. coli O157:H7 in acid solutions (Breidt and others 2007).
Our research objectives were to determine the survival of
E. coli O157:H7 in sterile, filtered commercial fermentation
brines, in competitive growth with L. plantarum and L. mesen-
teroides in cucumber juice, and in cucumber juice that has pre-
viously been fermented by these LAB. We examined the effect
of temperature, pH, protonated acid concentrations, NaCl con-
centrations, and other factors on the survival of E. coli O157:H7
in these brines. From these data we determined the times and
temperatures needed to assure safety of vegetable fermentations.
Materials and Methods
Preparation of cucumber brines
Size 2B pickling cucumbers (approximately 3.5 cm diameter)
were obtained from a local supplier. Cucumbers were rinsed and
scrubbed in tap water to remove dirt and debris then processed to
slurry in a Waring blender after 1 : 1 dilution in distilled water
(wt/vol). Slurry was frozen at −20 ◦
C for several days or weeks.
To create cucumber juice medium (CJ), slurry was thawed at 4
◦
C overnight and centrifuged in a Sorval RC-5B plus superspeed
centrifuge (Thermo Electron Corp., Asheville, N.C., U.S.A.) at
7.5k (8539 × g) for 20 min. Supernatant was aspirated from the
solids and the medium was sterilized by filtration using a 0.45
micron bottle filter (430514, Fisher Scientific, Suwanee, Ga.,
U.S.A.). Sodium chloride was added to a final concentration of
2%. Fermented cucumber juice (FCJ) was obtained by inoculating
CJ with a single colony of L. plantarum or L. mesenteroides (Table 1)
and incubating at 30 ◦
C for 96 h, followed by centrifugation and
filtration as described previously. Both CJ and FCJ were stored at
4 ◦
C until use. Fermented cucumber brines (approximately
250 mL) at different stages of fermentation were obtained from
commercial sources, sterilized by filtration (0.45 um) and frozen
at −20 ◦
C until use.
Preparation and handling of bacterial cells
A total of 5 enterotoxigenic E. coli O157:H7 strains (B200 to
B204) were grown independently and combined to form an in-
oculation cocktail (Table 1). E. coli strains were grown statically at
37 ◦
C for 16 h in LB broth (Difco, Becton Dickinson, Sparks,
Md., U.S.A.) supplemented with 1% glucose to induce acid resis-
tance. Overnight cultures were centrifuged at 5k (3000 × g) for 10
min, supernatant was removed, then combined and concentrated
10-fold in sterile saline with approximately equal concentrations
of each bacterial culture. The E. coli cocktail was inoculated at
106
, 108
, and 108
CFU/mL for CJ, FCJ, and commercial brines,
respectively. Brines were incubated for the indicated times and
temperatures, and samples (0.5 mL) were removed and diluted
prior to plating with a spiral plater (Spiral Biotech Inc. Norwood,
Mass., U.S.A.) on nonselective LB agar (Difco). After 24 h incu-
bation at 37 ◦
C, colonies were counted with an automated spiral
plate counter (Q-Count, Spiral Biotech Inc.). The lower detection
limit was between 102
and 103
CFU/mL by this method.
For bacterial competition assays in CJ, L. mesenteroides (LA430)
and L. plantarum (LA445) were grown statically at 30 ◦
C for 16 h in
MRS broth (Difco). Cultures were centrifuged and concentrated
as described for E. coli previously and inoculated at 103
CFU/mL
into CJ containing 106
CFU/mL of the E. coli cocktail. Mixed
culture fermentation samples were serially diluted and plated on
MRS agar (Difco), and LB agar followed by incubation at 30
and 37 ◦
C, respectively. We discovered that E. coli does not form
colonies on MRS agar at 30 ◦
C within 48 h, and L. mesenteroides
and L. plantarum will not grow on LB at 37 ◦
C in 24 h, allowing
independent enumeration of the LAB and the E. coli strains.
Biochemical analysis
Samples (2 mL) were withdrawn aseptically at indicated times
for high-performance liquid chromatography (HPLC), pH, and
NaCl concentrations. The pH was determined with an Accumet
AR25 pH meter (Fisher, Atlanta, Ga., U.S.A.). Sodium chloride
concentration was determined by chloride ion titration using sil-
ver nitrate and fluorescein dye indicator (Collier 1936). Organic
acids, sugars, and ethanol concentrations were measured with a
Thermo Separation Products HPLC (ThermoQuest Inc., San Jose,
Calif., U.S.A.) system consisting of a P1000 pump, an SCM100
solvent degasser, an AS3000 autosampler, and a UV6000 diode
array detector (ThermoQuest) (Breidt and others 2004). A Bio-
Rad HPX-87H column, 300 by 7.8 mm (Bio-Rad, Hercules,
Calif., U.S.A.) was used with a differential refractometer (Waters
model 410 Millipore, Milford, Mass., U.S.A.) and a UV detec-
tor (UV6000LP, Thermo Separation Products, San Jose, Calif.,
U.S.A.) for detection of the analytes. Operating conditions of the
system included a sample tray at 6 ◦
C, a column at 65 ◦
C and
Table 1–Bacterial strains.
Strain ID Strain name Previous ID Origin
B0200 E. coli O157:H7 ATCC 43888 Human feces
B0201 E. coli O157:H7 SRCC 1675 Apple cider outbreak
B0202 E. coli O157:H7 SRCC 1486 Salami outbreak
B0203 E. coli O157:H7 SRCC 2061 Ground beef
B0204 E. coli O157:H7 SRCC 1941 Pork
LA430 L. mesenteroides ATCC 8293 Fermenting olives
LA445 L. plantarum MOP3 Fermenting cucumbers
Vol. 76, Nr. 3, 2011 r Journal of Food Science M199
3. M:FoodMicrobiology
&Safety
Survival of E. coli in brines . . .
0.03 N H2SO4 eluent at a flow rate of 0.9 mL/min. The UV6000
detector was set to 210 nm at a rate of 1 Hz for data collec-
tion and 2 Hz was used for refractive index data. ChromQuest
version 4.1 chromatography software was used to control the sys-
tem and analyze the data, utilizing the peak heights for quan-
titative integration based on standard solutions with 4 different
concentrations.
Regression analysis
The estimated 5-log reduction times and standard errors
for the estimate were determined from the killing curves us-
ing a linear regression algorithm in MatlabTM
(Matlab Central
http://www.mathworks.com/matlabcentral/, F. Breidt and J. A.
Osborne). Regression analysis to determine correlations between
pH, protonated acid, and the predicted 5-log reduction time was
carried out using SigmaPlot software (version 10, Systat Software
Inc., Chicago, Ill., U.S.A.).
Results
A total of 10 commercial brines obtained during the first week
of fermentation were found to have pH values ranging from 3.2
to 4.5, and lactic acid concentrations of 150 mM to nondetectable
levels (less than 1 mM) (Table 2). The average NaCl concentration
for these brines was approximately 6.8%, ranging from 5.5% to
8.7%. All brines contained acetic acid, an occasional additive
to commercial brines to help lower the initial pH, encourage
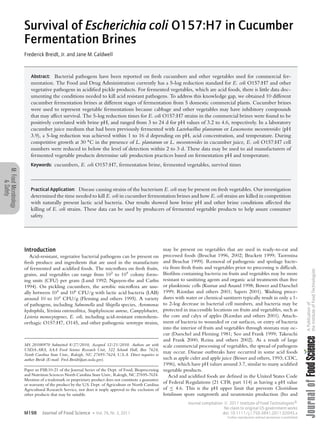
the growth of LAB, and buffer the fermentation. The survival of
the E. coli O157:H7 cocktail in the filtered commercial brines
is shown in Figure 1. The survival curves were approximated by
linear models, with an average R-squared value of 0.876 (data not
shown). From these data, 5-log reduction times were estimated
and the standard error of the estimate determined (Table 2). Sam-
ple A1, which had the highest pH value (4.53), no detectable
lactic acid, and a NaCl concentration of 7.9%, had the highest
5-log reduction time, requiring 22.6 ± 1.3 d at 23 ◦
C.
The 5-log reduction times were used to identify correlations
with brine components. We found a correlation between the pH
of the brine and the 5-log reduction time, with a R-squared value
of 0.71 (Figure 2). A similar trend was found for the correlation
between the log of the protonated acid concentration (calculated
from the Henderson–Hasselbalch equation) and pH, which had
a R-squared value of 0.704 (data not shown). One outlying data
point, brine sample E5, had a relatively short 5-log reduction
time (2 d) but a relatively high pH (3.78) compared to the other
samples. The NaCl concentration for this sample was higher than
the mean for the other samples (7.82% against 6.5%). Although
2 other samples had higher salt concentrations, they also had the
highest pH values for 10 brine samples.
To determine how competition with LAB would affect survival
of the E. coli O157:H7 strains, CJ fermentations were carried
at 30 ◦
C with 2% NaCl. In fermentations with L. mesen-
teroides, the cell numbers for the E. coli O157:H7 strains initially
increased to over 108
CFU/mL but then was reduced to below
Time (days)
0 2 4 6 8 10 12 14 16 18 20 22 24
2
3
4
5
6
7
8
LogCFU/ml
Figure 1–Survival of E. coli O157:H7 in brine from commercial fermenta-
tions at 23 ◦
C under anaerobic conditions. The survival of E. coli O157:H7
strains in brines labeled as shown in Table 1: A1, (filled circle); A2, (filled
triangle up); B1, (filled triangle down); B2, (filled square); C1, (filled dia-
mond); D1, (filled hex); E1, (open triangle up); E2, (open square); E5, (open
diamond); E6, (open hex). The regression lines for A1 data (solid line, R2
=
0.977) and E5 data (dashed line, R2
= 0.881) are shown.
pH
3.0 3.2 3.4 3.6 3.8 4.0 4.2 4.4 4.6
FiveLogReductionTime(days)
0
3
6
9
12
15
18
21
24
A 1
A 2
B 1
B 2
C 1 D 1
E 1
E 2
E 5
E 6
Figure 2–Five log reduction times and pH of commercial brines at 23 ◦
C
under anaerobic conditions. The alpha-numeric code for each data point
corresponds to the code in Table 1. The error bars represent the stan-
dard error for the calculated 5 log reduction times. The R2
value for the
regression line was 0.71.
Table 2–Biochemistry and 5 log reduction times for commercial brines.
Company IDa
pH NaCl (%) Lactic acid (mM) Acetic acid (mM) 5 log reduction (d) SEb
A1 4.53 7.90 0.00 11.76 22.6 1.3
A2 4.22 8.70 0.00 14.98 18.8 1.1
B1 3.89 5.50 35.81 4.39 13.4 1.7
B2 3.45 6.30 42.41 4.19 9.3 1.7
C1 3.87 6.90 24.86 22.83 15.7 1.7
D1 3.99 6.00 0.36 27.31 15.7 3.0
E1 3.92 5.64 31.89 20.06 15.1 3.1
E2 3.16 6.95 150.76 34.00 3.4 0.8
E5 3.78 7.82 50.60 14.20 2.0 0.7
E6 3.61 6.23 50.17 19.30 8.0 1.9
a
Company ID = company identification code.
b
SE represents the standard error of the estimated 5 log reduction time.
M200 Journal of Food Science r Vol. 76, Nr. 3, 2011
4. M:FoodMicrobiology
&Safety
Survival of E. coli in brines . . .
detectable levels (less than 102
CFU/mL) in less than 2.3 d (55 h)
(Figure 3A). During this time, the L. mesenteroides culture grew
from approximately 103
to 107
CFU/mL. In control fermentations
with the E. coli O157:H7 cocktail or the L. mesenteroides culture
grown independently of each other, the cultures grew similarly
within the first 10 to 20 h (to > 108
CFU/mL), but E. coli strains
maintained viability (approximately 107
CFU/mL) during the
55 h of the experiment (Figure 3B). Similar results were seen with
the L. plantarum culture in competition with the E. coli O157:H7
cocktail of strains (Figure 4A and 4B), except the E. coli culture
was reduced to below the limit of detection in mixed culture in
less than 48 h. Interestingly, the final pH values for the mixed cul-
ture fermentations with L. plantarum and the E. coli cocktail were
similar to the L. mesenteriodes—E. coli mixed fermentation (pH 4,
data not shown).
The survival of E. coli in brines of CJ previously fermented with
L. plantarum or L. mesenteroides was determined under the same
conditions as the competitive growth experiment (2% NaCl at
30 ◦
C) (Figure 5). The 5-log reduction for the E. coli O157:H7
strain cocktail, as calculated from the slope of the regression
line, was achieved within 4.3 h ± 0.8 h for CJ previously fer-
mented with L. plantarum, but for CJ previously fermented by
L. mesenteroides 15 ± 1.3 h was needed for a 5-log reduction. At
10 ◦
C, the times needed for a 5-log reduction were found to be
3.2 ± 0.5 d or 16 ± 1.4 d for brine fermented with L. plantarum
or L. mesenteroides, respectively.
Time (hours)
0 5 10 15 20 25 30 35 40 45 50 55
LogCFU/ml
2
3
4
5
6
7
8
9
LogCFU/ml
2
3
4
5
6
7
8
9
Figure 3–Survival of E. coli O157:H7 in competition with L. mesenteroides
at 30 ◦
C under anaerobic conditions. E. coli O157:H7 (triangles) and L.
mesenteroides (squares) cell counts for competitive growth of cells (A) or
cells grown separately (B) in CJ medium. The lines indicating the trends of
growth and death for E. coli O157:H7 strains (solid line) or L. mesenteroides
(dashed line) were 2nd or 3rd order polynomials.
LogCFU/ml
2
3
4
5
6
7
8
9
Time (hours)
0 5 10 15 20 25 30 35 40 45 50 55
LogCFU/ml 2
3
4
5
6
7
8
9
Figure 4–Survival of E. coli O157:H7 in competition with L. plantarum at
30 ◦
C under anaerobic conditions. E. coli O157:H7 (triangles) and L. plan-
tarum(squares)cellcountsforcompetitivegrowthofcells(A)orcellsgrown
separately (B) in CJ medium. The lines indicating the trends of growth and
death for E. coli O157:H7 strains (solid line) or L. plantarum (dashed line)
were 2nd or 3rd order polynomials.
Time (days)
0 2 4 6 8 10 12 14 16 18 20 22 24
LogCFU/ml
2
3
4
5
6
7
8
9
10
Figure 5–Survival of E. coli O157:H7 at 10 ◦
C and 30 ◦
C in brines fer-
mented with L. Plantarum or L. mesenteroides under anaerobic conditions.
SurvivalofE.coli O157:H7infermentedCJ.E.coli O157:H7strains(5-strain
cocktail) were inoculated CJ that had been fermented by L. mesenteroides
(triangles and solid line) or L. plantarum (circles and dashed line). Incuba-
tions were carried out at 10 ◦
C (open symbols) or 30 ◦
C (filled symbols)
The lines depict linear regression for survival in CJ fermented by L. mesen-
teroides (solid line, R2
= 0.82 or 0.96 for 10 ◦
C or 30 ◦
C, respectively) or L.
plantarum (dashed line, R2
= 0.80 or 0.92 for 10 ◦
C or 30 ◦
C, respectively).
Vol. 76, Nr. 3, 2011 r Journal of Food Science M201
5. M:FoodMicrobiology
&Safety
Survival of E. coli in brines . . .
Discussion
Process filings are required for commercial production of shelf-
stable acidified foods in the United States. In addition to main-
taining a pH of 4.6 or below, as required by 21 CFR part 114 to
prevent botulism, manufacturers also achieve a 5-log reduction in
the cell numbers of vegetative pathogens (Breidt and others 2010,
2007, 2005). E. coli O157:H7 has been found to be the most acid-
resistant vegetative pathogen of concern in acidified foods, and a
heat process is typically used to assure safety (Breidt and others
2005, 2007). While fermented foods are exempt from acidified
food regulations, little is known about the rate of killing for acid
resistant vegetative pathogens during fermentation. For cucum-
ber and sauerkraut fermentations, both Gram-positive and Gram-
negative bacteria have been shown to grow during the early stages
(first few days) of fermentation, depending on the initial brine
conditions and temperature (Fleming and others 1995; Plengvid-
hya and others 2007). Currently, most manufacturers of fermented
cucumbers use recycled brine or add acetic acid to the brine, this
can selectively encourage the growth of LAB and accelerate the die
off of enteric organisms. Starter cultures are not typically used in
vegetable fermentations, so the rate of fermentation and competi-
tive growth inhibition of vegetative pathogens can vary depending
on the initial microbiota, temperature, salt and acid concentration,
and brine pH.
This study focused on cucumber fermentations and laboratory
CJ studies because cabbage contains antimicrobial compounds,
which may reduce survival of enteric bacteria in brines (Kyung
and Fleming 1997). In cucumber brine that had been fermented
by L. mesenteroides, E. coli O157:H7 strains required more than
2 wk before a 5-log reduction in cell numbers was achieved.
Interestingly, the E. coli O157:H7 strains did not use significant
amounts of the remaining sugars (10 and 12 mM for glucose and
fructose, respectively) for up to 22 d incubation at 10 ◦
C (Table
3). This indicates the low temperature, external pH, and organic
acids inhibited glycolysis. In competition with L. mesenteroides or
L. plantarum, the E. coli O157:H7 strains initially grew at 30 ◦
C
from 106
CFU/mL to greater than 108
CFU/mL; however, the
LAB strains, which were inoculated in co-culture at approximately
103
CFU/mL were able to predominate in the fermentations,
overcoming the 3-log cycle deficit in initial cell numbers within
approximately 24 h (Figure 3). The final pH values obtained in
the mixed culture fermentations with both L. mesenteroides and L.
plantarum were approximately 4 (data not shown). The growth of
the E. coli strains interfered with the metabolic activity and growth
of the LAB, even though the E. coli strains were killed within 2
to 3 d. The factors influencing competitive growth include the
production of organic acids by both competitive species during
fermentative growth, the reduction in pH, and the utilization of
the main carbon sources as well as other nutrients. Because of the
complexity of these interactions, we used polynomial functions
Table 3—Biochemistry of fermented brines inoculated with
E. coli O157:H7.
Glucose Fructose Lactic Acetic
IDa
Time (h) pH (mM) (mM) (mM) (mM)
FCJ-LM 0 3.70 10.3 n.d. 30.8 24.0
FCJ-LM 24 3.9 10.0 0.0 28.4 23.0
FCJ-LP 0 2.89 10.3 12.8 105.2 0.0
FCJ-LP 24 3.0 9.9 12.0 98.1 0.0
a
ID: FCJ-LM = CJ fermented by L. mesenteroides; FCJ-LP = CJ fermented by L.
plantarum.
to approximate the growth and death curves (Figure 3 and 4).
Further study of mixed culture growth of bacteria and improved
competitive growth models (Breidt and Fleming 1998) may be
used to help determine outcomes of competitive growth.
Brine samples were obtained from 9 different commercial fer-
mentations at 5 different fermentation facilities around the United
States, sterilized by filtration, and used to determine survival of
E. coli O157:H7. The results were similar to the observations
with brines prepared in the laboratory by fermentation of CJ with
L. plantarum or L. mesenteroides (although with lower NaCl concen-
tration, approximately 2%). The data show a striking correlation
between pH and 5-log reduction time. As acid accumulates and
pH is reduced in the brine, the 5-log reduction time is correspond-
ingly reduced. Protonated acid concentrations also correlated well
with 5-log reduction time (not shown). If buffering capacity of
brines and fermentation acid production were similar for the dif-
ferent commercial brines obtained, this result would be expected.
Because pH is much easier to measure then protonated acid con-
centrations, we reported the correlation with pH and 5-log re-
duction times only. Only brine samples were used for this study.
Brine pH and organic acids will rapidly equilibrate between the
brine and the vegetable material in the fermentation (Fleming and
others, 1995). Although the log reduction observed for bacterial
pathogens in the brine was not directly measured using cucumber
fruit, the similar pH and acid concentrations should result in similar
log reduction for cells embedded in and on the vegetable material.
Further research would be necessary to confirm this assumption.
A commercial brine having little or no lactic acid at the start
of fermentation (brine sample A1) had a 5-log reduction time
of approximately 3 wk, compared to 3 d for a fermented brine
with a pH of 3.1 and 150 mM lactic acid (brine sample E2)
(Table 2). Under more favorable conditions (lower temperature)
for the survival of E. coli O157:H7 (2% NaCl, 10 ◦
C with CJ
fermentation by L. mesenteroides, Figure 5), a 5-log reduction at
pH 3.9 required 23 d compared to 16 d for commercial brine
samples at 25 ◦
C with similar pH values (brines C1 and D1,
Table 2). While the trend of increasing survival as temperature is
reduced is similar to that reported by Breidt and others (2007),
further study will be needed to clarify the relationship between
temperature and brine survival of E. coli.
Interestingly, one commercial brine had a 5-log reduction time
that was lower than expected based on pH (brine E5) (Table 2 and
Figure 2). This sample had higher salt (7.82% NaCl) compared
to similar samples (brines E6, C1 with 6.23% and 6.9% NaCl,
respectively), but had a 5-log reduction time at least 6 d shorter
(2 d compared with 8 or 15.7 d). The apparent effect of higher salt
concentration was to increase acid killing, but the there may be
other unidentified factors influencing acid killing, including the
presence of preservatives. Postassium sorbate is sometimes used
in commercial fermentations to prevent the growth of spoilage
microflora, including yeasts (Costilow and Uebersax 1982). But,
in the commercial brines used in this study we found no evidence
of sorbate (<1 mM) by HPLC.
Conclusions
Process filings submitted to FDA for commercial production
of acidified foods have a 5-log reduction standard to assure safety.
While fermented foods are considered acid foods, and are therefore
exempt from acidified food regulations, no published research is
available to determine the survival of E. coli O157:H7 or other
pathogens in these products. Given the most permissive conditions
tested for the survival of E. coli O157:H7 (pH 4.5 for commercial
M202 Journal of Food Science r Vol. 76, Nr. 3, 2011
6. M:FoodMicrobiology
&Safety
Survival of E. coli in brines . . .
brine samples at 23 ◦
C or pH 3.9 with brine fermented by L.
mesenteroides at 10 ◦
C), a 5-log reduction was achieved within
23 d. We also found that pH and 5-log reduction time were
closely correlated for a variety of commercial fermentation brines.
Brine pH values below 3.3 required less than 4 d to achieve a
5-log reduction regardless of temperature (10 ◦
C or higher) with
commercial brines or in active competition with LAB. These data
will help commercial manufacturers assure the safety of fermented
vegetable products.
Acknowledgments
The authors acknowledge Drs. Roger F. McFeeters and Jason
A. Osborne for helpful discussions. We also thank Sandra Parker
for excellent editorial assistance. This study was supported in part
by a grant from Pickle Packers Intl. Inc.
References
Besser RE, Lett SM, Weber JT, Doyle MP, Barrett TJ, Wells JG, Griffin PM. 1993. An outbreak
of diarrhea and hemolytic uremic syndrome from Escherichia coli O157:H7 in fresh pressed
apple cider. JAMA 269:2217–20.
Beuchat LR. 1996. Pathogenic microorganisms associated with fresh produce. J Food Prot
59:204–16.
Beuchat LR. 2002. Ecological factors influencing survival and growth of human pathogens on
raw fruits and vegetables. Micro Infect 4:413–23.
Bower CK, Daeschel MA. 1999. Resistance responses of microorganisms in food environments.
Int J Food Microbiol 50:33–4.
Brackett RE. 1999. Incidence, contributing factors, and control of bacterial pathogens in pro-
duce. Postharvest Biol Technol 15:305–11.
Breidt F Jr. 2006. Safety of minimally processed, acidified and fermented vegetable products.
In: Sapers GM, Gorny JR, Yousef AE, editors. Microbiology of fruits and vegetables. Boca
Raton, Fla.: CRC Press Inc. p 313–35.
Breidt F, Fleming HP. 1998. Modeling of the competitive growth of Listeria monocytogenes and
Lactococcus lactis in vegetable broth. Appl Environ Microbiol 64(9):3159–65.
Breidt F Jr, Hayes JS, McFeeters RF. 2004. Independent effects of acetic acid and pH on
survival of Escherichia coli in simulated acidified pickle products. J Food Prot 67(1):12–
8.
Breidt F, Hayes JS, McFeeters RF. 2007. Determination of 5-log reduction times for food
pathogens in acidified cucumbers during storage at 10 and 25 ◦
C. J Food Prot 70(11):2638–41.
Breidt F Jr, Hayes JS, Osborne JA, McFeeters RF. 2005. Determination of 5-log pathogen
reduction times for heat-processed, acidified vegetable brines. J Food Prot 68(2):305–10.
Breidt F, Sandeep KP, Arritt F. 2010. Use of linear models for thermal processing acidified
foods. Food Prot Trends 30(5):268–72.
Centers for Disease Control and Prevention. 1996. Outbreak of Escherichia coli O157:H7 infec-
tions associated with drinking unpasteurized commercial apple juice–October, 1996. Morbid
Mortal Weekly Report 45:975.
Collier V, 1936. Determination of chlorides in biological materials. J Biol Chem 115(1): 239–45.
Costilow RN, Uebersax M. 1982. Effects of various treatments on the quality of salt-stock
pickles from commercial fermentations purged with air. J Food Sci 47:1866–8.
Daeschel MA, Fleming HP. 1981. Entrance and growth of lactic acid bacteria in gas-exchanged,
brined cucumbers. Appl Environ Microbiol 42:1111–8.
Fleming HP, Kyung KH, Breidt F. 1995. Vegetable fermentations. In: Rehm HJ, Reed G,
editors. Biotechnology. Vol. 9. Enzymes, biomass, food and feed, 2nd ed. New York: VCH
Publishers Inc. p 629–61.
Ito KA, Chen JK, Lerke PA, Seeger ML, Unverferth JA. 1976. Effect of acid and salt concentration
on the growth of Clostridium botulinum spores. Appl Environ Microbiol 32:121–4.
Kumar CG, Anand SK. 1998. Significance of microbial biofilms in food industry: a review. Int
J Food Microbiol 42:9–27.
Kyung KH, Fleming HP. 1997. Antimicrobial activity of sulfur compounds derived from cab-
bage. J Food Prot 60(1):67–71.
Lund BM. 1992. Ecosystems in vegetable foods. J Appl Bacteriol Symp Suppl 73:115S–26S.
Nguyen-the C, Carlin F. 1994. The microbiology of minimally processed fresh fruits and
vegetables. Crit Rev Food Sci Nutr 34:371–401.
Plengvidhya V, Breidt F, Lu Z, Fleming HP. 2007. DNA fingerprinting of lactic acid bacteria
in sauerkraut fermentations by methods. Appl Environ Microbiol 73(23):7697–702.
Reina LD, Fleming HP, Breidt F. 2002. Bacterial contamination of cucumber fruit through
adhesion. J Food Prot 65:1881–7.
Riordan DCR, Sapers GM, Hankinson TR, Magee M, Mattrazzo AM, Annous BA. 2001. A
study of U.S. orchards to identify potential sources of Escherichia coli O157:H7. J Food Prot
64:1320–7.
Sapers GM. 2001. Efficacy of washing and sanitizing methods for disinfection of fresh fruit and
vegetable products. Food Technol Biotechnol 39:305–11.
Seo KH, Frank JF. 1999. Attachment of Escherichia coli O157:H7 to lettuce leaf surface and
bacterial viability in response to chlorine treatment as demonstrated by confocal scanning
laser microscopy. J Food Prot 62:3–9.
Takeuchi K, Frank JF. 2000. Penetration of Escherichia coli O157:H7 into lettuce tissues as affected
by inoculum size and temperature and the effect of chlorine treatment on cell viability. J Food
Prot 63:434–40.
Taormina PJ, Beuchat LR. 1999. Behavior of enterohemorrhagic Escherichia coli O157:H7 on
alfalfa sprouts during the sprouting process as influenced by treatments with various chemicals.
J Food Prot 62:850–6.
Vol. 76, Nr. 3, 2011 r Journal of Food Science M203