

Recommended
Recommended
More Related Content
What's hot
What's hot (18)
Similar to Abc 401k plan grader
Similar to Abc 401k plan grader (20)
Recently uploaded
Recently uploaded (20)
Abc 401k plan grader
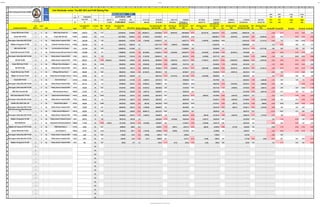
- 1. Confidential 6/29/2017 Page 1 22 23 24 25 26 27 28 29 30 31 32 33 34 35 36 37 38 39 40 41 42 43 44 45 46 47 48 49 50 51 52 53 54 55 56 57 58 59 60 61 62 63 64 65 66 67 68 69 70 G H I J P Q R U W Y AE AF AH AJ AK AN AQ AR AU AX AY BB BE BF BI BL BM BN BO BP BQ Patent Pending Serial Number 62368060 EVAL % OF PLAN: 91% 2016 2015 3 Year 5 Year 22,892,856.63$ 23,078,509.00 =5500 -32% -28% -18% -24% 3% flows 2016 100% 7,667.46 437,807.02$ 50% (14,111.72) 20,785,205 (18,877.78) 18,909,891 -$17,782.96 15,545,603 -$4,909.93 13,700,535 $8,374.05 2016 2015 3 Year 5 Year 1 29 7% (17,039) 21,005,596.00 218,903.51 (598,438) 20,785,205 -$156,200.42 $18,909,891.21 -$432,877.78 15,545,603 -$369,915.19 $13,700,535.01 -$134,577.66 -79% -38% -41% -52% prospectus benchmark 2nd BM=1,0 Level 1 Index name ticker trust assets 2017 DEITZ % of level 1 2017 lag 2017 lag cost trust assets 2016 DEITZ 50% of flows 2016 lag 2016 lag cost trust assets beg 2015 dietz from 5500 2015 lag 2015 lag cost from 5500 trust assets beg 2014 dietz from 5500 2014 lag 2014 lag cost from 5500 trust assets beg 2013 dietz from 5500 2013 lag 2013 lag cost from 5500 trust assets beg 2012 dietz from 5500 2012 lag 2012 lag cost from 5500 fd v bm 2016 fd v bm 2015 fd v bm 3y fd v bm 5y fd v bm 10y Russell 3000 Growth TR USD 0 X No Wells Fargo Growth Inst SGRNX 3,268,010 15% 3.17 3,219,023.00 33,546.08 (8.0) (255,930.71) 3,185,249.04 (2.15) (68,587.55) 2,897,864.68 (8.32) (241,227.70) 2,382,301.07 (0.51) (12,245.96) 2,099,551.82 1.93 (7.95) (2.15) (6.12) (3.64) 1.81 Russell 1000 TR USD 1 X Yes Dreyfus S&P 500 Index PEOPX 2,885,534 12% (0.10) 2,541,189.00 26,482.24 (0.7) (17,934.67) 2,514,526.87 (0.01) 2,287,657.42 (0.09) 1,880,656.74 (1.35) (25,447.94) 1,657,446.37 (0.97) (16,059.36) (0.71) (0.01) (0.26) (0.59) (0.62) Morningstar Lifetime Mod 2020 TR USD 1 X No Fidelity Advisor Freedom® 2020 I FDIFX 1,853,529 8% 1.38 1,694,429.00 17,657.98 (0.4) (7,455.49) 1,676,651.07 1.23 1,525,377.72 (0.78) (11,897.95) 1,253,995.40 (0.03) 1,105,161.87 (1.06) (11,714.72) (0.44) 1.23 0.04 (0.19) (1.12) BBgBarc US Agg Bond TR USD 0 X No Prudential Total Return Bond Q PTRQX 1,650,790 7% 1.02 1,543,371.00 16,083.78 2.2 1,527,177.97 (0.46) (7,090.44) 1,389,390.60 1.29 1,142,201.96 1.11 1,006,636.92 5.74 2.18 (0.46) 0.98 1.93 1.51 MSCI EAFE NR USD 0 X No Ivy International Core Equity I ICEIX 1,307,340 6% 0.76 1,259,997.00 13,130.68 0.7 1,246,777.12 0.08 1,134,288.51 6.28 932,485.48 2.15 821,811.15 (3.33) (27,377.55) 0.66 0.08 2.36 1.28 3.03 Russell Mid Cap Growth TR USD 0 X No Prudential Jennison Mid Cap Growth Q PJGQX 1,233,068 6% 1.67 1,158,680.00 12,074.84 (3.0) (35,193.89) 1,146,523.14 (2.04) (23,433.09) 1,043,079.79 (2.22) (23,136.52) 857,503.85 (7.44) (63,799.21) 755,728.90 0.61 (3.04) (2.04) (2.43) (2.70) 0.20 Morningstar Lifetime Mod 2025 TR USD 1 X No Fidelity Advisor Freedom® 2025 I FITWX 1,208,718 5% 1.28 1,103,641.00 11,501.26 (1.0) (11,367.50) 1,092,061.61 1.38 993,531.97 (0.62) (6,159.90) 816,771.16 (0.07) 719,830.67 (0.79) (5,686.66) (1.03) 1.38 (0.05) (0.20) (0.88) S&P 500 TR USD 0 X No Fidelity Advisor Freedom® 2015 I FFVIX 984,455 4% (1.65) (16,243.51) 902,454.00 9,404.65 (5.0) (45,393.44) 892,985.46 (2.08) (18,574.10) 812,417.17 (8.80) (71,492.71) 667,878.77 (20.80) (138,918.78) 588,609.94 (5.43) (31,961.52) (5.03) (2.08) (5.21) (8.09) (2.69) Russell 3000 Value TR USD 0 X No JPMorgan Value Advantage A JVAAX 985,714 4% (0.19) 830,095.00 8,650.59 (1.9) (15,842.39) 821,385.65 (0.60) (4,965.05) 747,277.35 0.61 614,328.08 (1.10) (6,763.36) 541,415.04 0.77 (1.91) (0.60) (0.62) (0.44) 2.06 S&P 500 TR USD 0 X No Fidelity Advisor Freedom® 2030 I FEFIX 829,139 4% (0.10) 752,478.00 7,841.72 (3.9) (29,647.63) 744,583.01 (2.10) (15,636.24) 677,404.11 (8.21) (55,614.88) 556,886.09 (14.80) (82,419.14) 490,790.70 (2.67) (13,104.11) (3.94) (2.10) (4.67) (6.10) (2.88) Russell Mid Cap Value TR USD 0 X No JPMorgan Mid Cap Value A JAMCX 809,966 3% 0.08 696,492.00 7,258.28 (5.9) (41,343.47) 689,184.41 1.96 627,003.77 (0.15) 515,452.56 (2.12) (10,927.12) 454,274.81 1.35 (5.94) 1.96 (1.15) (0.84) 0.40 BBgBarc US Universal TR USD 0 X No Fidelity Advisor® Strategic Income A FSTAX 726,240 3% 1.28 656,631.00 6,842.88 4.5 649,741.63 (2.27) (14,779.10) 591,119.66 (2.04) (12,076.66) 485,952.64 1.43 428,276.16 5.02 4.52 (2.27) 0.00 1.26 1.00 Russell 2000 TR USD 0 X No Calvert Small Cap A CCVAX 787,849 3% 0.13 644,234.00 6,713.69 (1.3) (8,428.51) 637,474.70 3.33 579,959.50 2.14 476,778.00 2.03 420,190.43 (1.06) (4,439.29) (1.31) 3.33 1.56 1.12 (0.54) Morningstar Lifetime Mod 2040 TR USD 1 X No Fidelity Advisor Freedom® 2040 I FIFFX 637,774 3% 1.18 576,902.00 6,012.01 (2.2) (12,864.91) 570,849.15 2.09 519,345.13 (0.09) 426,947.63 (2.43) (10,374.83) 376,274.31 (1.32) (4,966.82) (2.23) 2.09 - (0.69) (1.29) Morningstar Lifetime Mod 2050 TR USD 1 X No Fidelity Advisor Freedom® 2050 I FFFPX 636,046 3% 0.91 575,234.00 5,994.63 (2.5) (14,323.33) 569,198.65 2.50 517,843.55 0.43 425,713.20 (1.27) (5,406.56) 375,186.38 (0.94) (3,526.75) (2.49) 2.50 0.24 (0.25) (1.28) MSCI EAFE Value GR USD 0 X No MFS International Value A MGIAX 511,079 2% 1.01 481,911.00 5,022.09 (1.8) (8,457.31) 476,854.79 11.70 433,831.28 6.20 356,647.68 3.76 314,318.08 (2.63) (8,251.19) (1.75) 11.70 5.49 3.71 4.51 S&P United States REIT TR USD 1 X No Fidelity Advisor® Real Estate A FHEAX 458,796 2% (0.23) 427,203.00 4,451.97 (3.2) (13,825.05) 422,720.79 0.74 384,581.44 (0.74) (2,848.74) 316,159.95 (0.96) (3,041.03) 278,635.73 0.12 (3.24) 0.74 (1.08) (0.83) (0.28) Morningstar Lifetime Mod 2045 TR USD 1 X No Fidelity Advisor Freedom® 2045 I FFFIX 469,516 2% 1.05 424,781.00 4,426.73 (2.5) (10,534.57) 420,324.20 2.21 382,401.08 0.32 314,367.51 (1.84) (5,784.36) 277,056.03 (1.16) (3,213.85) (2.48) 2.21 0.10 (0.49) (1.23) BofAML USD LIBOR 3 Mon CM 1 X No Fidelity® Money Market SPRXX 300,409 1% (0.06) 293,235.00 3,055.86 (0.3) (887.29) 290,158.38 (0.22) 263,979.27 (0.22) 217,014.31 (0.28) (597.51) 191,257.43 (0.50) (949.82) (0.30) (0.22) (0.25) (0.30) (0.39) Morningstar Lifetime Mod 2055 TR USD 1 X No Fidelity Advisor Freedom® 2055 I FHFIX 323,962 1% 0.87 292,934.00 3,052.72 (2.5) (7,294.06) 289,860.54 2.62 263,708.30 0.80 216,791.55 (0.30) (650.37) 191,061.11 (0.81) (1,547.60) (2.49) 2.62 0.40 0.05 - S&P North American Natural Resources TR 1 X No Fidelity Advisor® Materials A FMFAX 290,362 1% 11.89 254,890.00 2,656.26 (19.2) (48,846.11) 252,215.70 15.36 229,459.91 9.45 188,636.34 5.07 166,247.57 17.63 (19.16) 15.36 4.13 6.86 4.95 Morningstar Lifetime Mod 2035 TR USD 1 X No Fidelity Advisor Freedom® 2035 I FITHX 270,598 1% 1.61 244,838.00 2,551.51 (1.7) (4,186.73) 242,269.16 1.80 220,410.79 (0.29) (639.19) 181,197.16 (1.80) (3,261.55) 159,691.33 (1.11) (1,772.57) (1.71) 1.80 - (0.54) (1.15) BBgBarc US Agg Bond TR USD 0 X No Fidelity Advisor Freedom® Income I FIAFX 202,012 1% 1.80 188,201.00 1,961.28 2.6 186,226.40 (1.19) (2,216.09) 169,424.40 (2.24) (3,795.11) 139,281.84 6.47 122,750.83 2.12 2.55 (1.19) (0.30) 1.55 (0.67) MSCI EM NR USD 0 X No Oppenheimer Developing Markets A ODMAX 171,392 1% (0.46) (795.61) 157,176.00 1,637.96 (4.3) (6,755.99) 155,526.91 0.86 141,494.73 (2.62) (3,704.58) 116,321.18 10.96 102,515.32 2.63 (4.30) 0.86 (1.82) 1.47 2.34 BBgBarc US Treasury US TIPS TR USD 0 X No PIMCO Real Return A PRTNX 49,850 0% 0.51 46,696.00 486.63 (0.1) 46,206.07 (1.70) (786.51) 42,037.19 (0.63) (266.43) 34,558.29 (0.80) (277.46) 30,456.65 1.84 (0.06) (1.70) (0.82) (0.32) (0.20) Russell 1000 Growth TR USD 0 X No Janus Research A JRAAX 31,814 0% (0.23) 30,781.00 320.77 (5.8) (1,791.03) 30,458.05 (0.42) (128.09) 27,710.01 0.78 22,780.08 1.40 20,076.37 1.18 (5.82) (0.42) (1.90) (0.74) (0.24) Morningstar Lifetime Mod 2060 TR USD 1 X No Fidelity Advisor Freedom® 2060 I FDKQX 5,649 0% 0.92 5,108.00 53.23 (2.5) (125.66) 5,054.41 2.64 4,598.38 - 3,780.28 - 3,331.60 - (2.46) 2.64 - - - Morningstar Lifetime Mod 2010 TR USD 1 X No Fidelity Advisor Freedom® 2010 I FCIFX 2,857 0% 1.20 2,634.00 27.45 (0.3) (8.17) 2,606.36 0.97 2,371.21 (0.51) (12.09) 1,949.34 2.07 1,717.98 (0.34) (5.84) (0.31) 0.97 0.07 0.38 (0.87) BBgBarc US Agg Bond TR USD 0 X No Fidelity Advisor Freedom® 2005 I FFIVX 386 0% 2.57 358.00 3.73 3.2 354.24 (1.17) (4.14) 322.28 (1.65) (5.32) 264.94 9.99 233.50 4.35 3.16 (1.17) 0.10 2.92 (0.69) 0 0% - - - - - - 0 0% - - - - - - 1 0% - - - - - - 1 0% - - - - - - 1 0% - - - - - - 1 0% - - - - - - 1 0% - - - - - - 0 0% - - - - - - 1 0% - - - - - - 1 0% - - - - - - 1 0% - - - - - - 1 0% - - - - - - 1 0% - - - - - - 1 0% - - - - - - % Index Calc PlanGrader review: The ABC 401k and Profit Sharing Plan # funds bmck17Patent pending PlanGrader for Morris & Ritchie
- 2. Prepared from IRS Forms 5500 filings by Rick Canipe, EA, MBA IRS Enrolled Agent 77840; to verify the status, email epp@irs.gov or call 855.472.5540. www.Fix401k.com www.MiraCenter.com Data from Morningstar.com 91% TOTAL PAID $971,077 $920,525 $901,185 $1,720,918 ? ? $ 4,513,705 Distributions 2012 2013 2014 2015 2016 2017Q1 -$17,039 -$1,709,048-$134,578 -$369,915 -$432,878 -$156,200 -$598,438 $ Lag 2012 2013 2014 2015 2016 2017Q1 TOTAL LAG "Under trust law, a trustee has a continuing duty to monitor trust investments and remove imprudent ones." 21% What % of the investment menu met or beat their benchmarks in 2016? Values from www.efast.dol.gov--also review and refer to your plan's annual 29 CFR 2550.404a-5 notice % of Plan Assets Reviewed: "...emphasizes a duty to diversify, the avoidance of unjustified costs, and the importance of evaluating the portfolio as a whole…" 82% In 2016, what percent of the evaluated trust was invested in lagging funds? Supreme Court May 18, 2015 Ruling No In 2016, were >50% of assets invested in passive institutional shares? The Third Restatement of Trusts Prudent Investor Rule Adherence “The greater the trustee’s departure from one of the valid passive strategies, the greater is likely to be the burden of justification and also of continuous monitoring.” The ABC 401k and Profit Sharing Plan Federal regulation 2550.408b-2 requires reviewing providers to determine they bring value and are "necessary." Federal regulation 2550.404a-5 requires disclosures to investors so they can evaluate performance versus benchmarks. This document was produced to aid in these efforts. -79% -38% -41% -52% -90% -80% -70% -60% -50% -40% -30% -20% -10% 0% 2016 2015 3 YEAR 5 YEAR % of Funds Lagging Benchmarks (888)PlanLag www.FundLag.com AVERAGE % COST/YR +/- BENCHMARKS 2014-2016 -0.82% -0.39% Participants' Investment Cost v. Return Comparison Prepared using this plan's most recent public IRS/DOL Forms 5500 at www.dol.gov/efast Presented _______________ by R. Canipe, J. Holland or approved advisor
- 3. Prepared from IRS Forms 5500 filings by Rick Canipe, EA, MBA IRS Enrolled Agent 77840; to verify the status, email epp@irs.gov or call 855.472.5540. www.Fix401k.com www.MiraCenter.com Data from Morningstar.com Prepared using this plan's most recent public IRS/DOL Forms 5500 at www.dol.gov/efast Presented _______________ by R. Canipe, J. Holland or approved advisor
- 4. Prepared from IRS Forms 5500 filings by Rick Canipe, EA, MBA IRS Enrolled Agent 77840; to verify the status, email epp@irs.gov or call 855.472.5540. www.Fix401k.com www.MiraCenter.com Data from Morningstar.com 91% Prudent Investor Rule Adherence “The greater the trustee’s departure from one of the valid passive strategies, the greater is likely to be the burden of justification and also of continuous monitoring.” Federal regulation 2550.408b-2 requires reviewing providers to determine they bring value and are "necessary." Federal regulation 2550.404a-5 requires disclosures to investors so they can evaluate performance versus benchmarks. This document was produced to aid in these efforts. The ABC 401k and Profit Sharing PlanAmerican Law Institute Prudent Investor Rule "...emphasizes a duty to diversify, the avoidance of unjustified costs, and the importance of evaluating the portfolio as a whole…" 32% In 2016, what percent of the evaluated trust was invested in lagging funds? Supreme Court May 18, 2015 Ruling Yes In 2016, were >50% of assets invested in passive institutional shares? The Third Restatement of Trusts $ Lag 2012 2013 2014 2015 2016 2017Q1 TOTAL LAG "Under trust law, a trustee has a continuing duty to monitor trust investments and remove imprudent ones." 68% What % of the investment menu met or beat their benchmarks in 2016? Values from www.efast.dol.gov--also review and refer to your plan's annual 29 CFR 2550.404a-5 notice % of Plan Assets Reviewed: $7,667 -$39,641$8,374 -$4,910 -$17,783 -$18,878 -$14,112 TOTAL PAID $971,077 $920,525 $901,185 $1,720,918 ? ? $ 4,513,705 Distributions 2012 2013 2014 2015 2016 2017Q1 -32% -28% -18% -24% -35% -30% -25% -20% -15% -10% -5% 0% 2016 2015 3 YEAR 5 YEAR % of Funds Lagging Benchmarks (888)PlanLag www.FundLag.com AVERAGE % COST/YR +/- BENCHMARKS 2014-2016 -0.18% -0.15% Participants' Investment Cost v. Return Comparison Prepared using this plan's most recent public IRS/DOL Forms 5500 at www.dol.gov/efast Presented _______________ by R. Canipe, J. Holland or approved advisor
- 5. Prepared from IRS Forms 5500 filings by Rick Canipe, EA, MBA IRS Enrolled Agent 77840; to verify the status, email epp@irs.gov or call 855.472.5540. www.Fix401k.com www.MiraCenter.com Data from Morningstar.com Prepared using this plan's most recent public IRS/DOL Forms 5500 at www.dol.gov/efast Presented _______________ by R. Canipe, J. Holland or approved advisor