Recommended

Recommended
More Related Content
What's hot
What's hot (20)
Similar to JLL Pittsburgh Chart of the Week: April 6, 2015
Similar to JLL Pittsburgh Chart of the Week: April 6, 2015 (20)
More from JLL_Midwest_Great_Lakes_Research
More from JLL_Midwest_Great_Lakes_Research (20)
Recently uploaded
Recently uploaded (20)
JLL Pittsburgh Chart of the Week: April 6, 2015
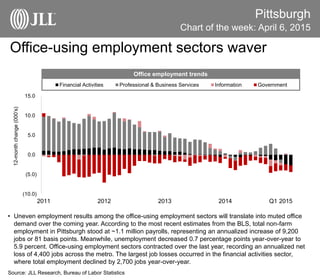
- 1. Office-using employment sectors waver Pittsburgh • Uneven employment results among the office-using employment sectors will translate into muted office demand over the coming year. According to the most recent estimates from the BLS, total non-farm employment in Pittsburgh stood at ~1.1 million payrolls, representing an annualized increase of 9,200 jobs or 81 basis points. Meanwhile, unemployment decreased 0.7 percentage points year-over-year to 5.9 percent. Office-using employment sectors contracted over the last year, recording an annualized net loss of 4,400 jobs across the metro. The largest job losses occurred in the financial activities sector, where total employment declined by 2,700 jobs year-over-year. Source: JLL Research, Bureau of Labor Statistics Chart of the week: April 6, 2015 (10.0) (5.0) 0.0 5.0 10.0 15.0 2011 2012 2013 2014 Q1 2015 Financial Activities Professional & Business Services Information Government Office employment trends 12-monthchange(000’s)