SlideShare a Scribd company logo
1 of 2
Download to read offline
Office construction heating up (s.f.)
Source: JLL Research
Blue Ash/Montgomery net absorption (s.f.)
Source: JLL Research
Class A and Class B rental rates
Source: JLL Research
Rising demand continues to fuel office construction
Rising demand across the Cincinnati office market has sparked a number of new
developments, increasing the level of office product under construction to its
highest level in years. The development pipeline is also active, with numerous
projects lined up in the queue. The largest project awaiting construction kick-off
is 180 Walnut at the Banks, a potential 10-story, 235,000-square-foot speculative
office tower. Carter, the site’s master developer, is still looking for an anchor
tenant to begin construction.
Blue Ash/Montgomery enjoys aggressive leasing rebound
The Blue Ash/Montgomery submarket has experienced a surge in leasing
activity through the first half of 2015 following a trend of declining demand seen
in the years prior. A number of significant lease transactions were signed
recently, including Kroger’s takedown of the entire five-story, 176,000-square-
foot office building at The Landings of Blue Ash, a former CitiBank facility.
Microsoft also recently announced a significant commitment to the submarket,
leasing roughly 17,000 square feet at Lake Forest Place, a seven-story, Class A
property located at 4445 Lake Forest Drive. These along with other significant
transactions are expected to add numerous jobs in the area, further cementing
the Blue Ash/Montgomery submarket’s status as a suburban hotspot.
Rental rates on the rise across Class A and B properties
Asking rents have slowly been on the rise as both Class A and B assets
recorded measured growth in rates over the past year. The average Class A
asking rent currently sits at $21.87, an increase of 2.6 percent, or $0.56, year-
over-year. Meanwhile, Class B asking rents posted an annual gain 2.7 percent,
or $0.42, from $15.42 to $15.84 per square foot. Looking forward, the trend in
rising rents is expected to hold steady, supported by a continually tightening
market and increasing levels of tenant activity.
Rental rates and tenant demand record gains
2,257
Office Insight
Cincinnati | Q2 2015
34,380,853
Total inventory (s.f.)
-313,918
Q2 2015 net absorption (s.f.)
$19.16
Direct average asking rent
2,024,533
Total under construction (s.f.)
19.4%
Total vacancy
-47,008
YTD net absorption (s.f.)
0.9%
12-month rent growth
53.4%
Total preleased
0
500,000
1,000,000
1,500,000
2,000,000
2,500,000
2011 2012 2013 2014 YTD 2015
-100,000
-50,000
0
50,000
100,000
150,000
2011 2012 2013 2014 YTD 2015
$12
$16
$20
$24
2011 2012 2013 2014 Q2 2015
Class A Class B
Current conditions – submarket Historical leasing activity (s.f.)
Source: JLL Research Source: JLL Research
Total net absorption (s.f.)
Source: JLL Research
Total vacancy rate (%)
Source: JLL Research
Direct average asking rent ($ p.s.f.)
Source: JLL Research
-464,648
79,469
143,641
290,120
562,970
-47,008
-600,000
-400,000
-200,000
0
200,000
400,000
600,000
800,000
2010 2011 2012 2013 2014 YTD 2015
$17.39
$17.94
$18.41
$19.68
$19.15 $19.16
$14.00
$16.00
$18.00
$20.00
$22.00
$24.00
2010 2011 2012 2013 2014 YTD 2015
22.7% 22.6% 22.5%
21.3%
19.8% 19.4%
10.0%
15.0%
20.0%
25.0%
2010 2011 2012 2013 2014 YTD 2015
Landlordleverage
Tenantleverage
Peaking
market
Falling
market
Bottoming
market
Rising
market
Kenwood
2,700,000
1,700,000 1,800,000
2,200,000
640,000
0
500,000
1,000,000
1,500,000
2,000,000
2,500,000
3,000,000
2011 2012 2013 2014 YTD 2015
Blue Ash / Montgomery, Midtown,
Fields Ertel / Mason, West Chester
©2015 Jones Lang LaSalle IP, Inc. All rights reserved.For more information, contact: Cody Brooks | cody.brooks@am.jll.com
CBD Peripheral,
NKY Riverfront
CBD, Tri-County East, West
Northern Kentucky

More Related Content

What's hot

JLL Grand Rapids Office Insight & Statistics - Q3 2018
JLL Grand Rapids Office Insight & Statistics - Q3 2018JLL Grand Rapids Office Insight & Statistics - Q3 2018
JLL Grand Rapids Office Insight & Statistics - Q3 2018Harrison West
 
St. Louis Office Insight
St. Louis Office InsightSt. Louis Office Insight
St. Louis Office InsightBlaise Tomazic
 
JLL Grand Rapids Office Insight & Statistics - Q1 2018
JLL Grand Rapids Office Insight & Statistics - Q1 2018JLL Grand Rapids Office Insight & Statistics - Q1 2018
JLL Grand Rapids Office Insight & Statistics - Q1 2018Harrison West
 
JLL Grand Rapids Office Insight & Statistics - Spring 2017
JLL Grand Rapids Office Insight & Statistics - Spring 2017JLL Grand Rapids Office Insight & Statistics - Spring 2017
JLL Grand Rapids Office Insight & Statistics - Spring 2017Harrison West
 
JLL Grand Rapids Office Insight & Statistics - Q2 2019
JLL Grand Rapids Office Insight & Statistics - Q2 2019JLL Grand Rapids Office Insight & Statistics - Q2 2019
JLL Grand Rapids Office Insight & Statistics - Q2 2019Harrison West
 
Chicago Suburbs Office Insight - Q2 2016
Chicago Suburbs Office Insight - Q2 2016Chicago Suburbs Office Insight - Q2 2016
Chicago Suburbs Office Insight - Q2 2016Hailey Harrington
 
JLL Columbus Chart of the Week: November 23, 2015
JLL Columbus Chart of the Week: November 23, 2015 JLL Columbus Chart of the Week: November 23, 2015
JLL Columbus Chart of the Week: November 23, 2015 Ross Bratcher
 
Pittsburgh Office Insight & Stats Q1 2022
Pittsburgh Office Insight & Stats Q1 2022Pittsburgh Office Insight & Stats Q1 2022
Pittsburgh Office Insight & Stats Q1 2022Tobiah Bilski
 
JLL Cleveland Office Outlook: Q1 2018
JLL Cleveland Office Outlook: Q1 2018JLL Cleveland Office Outlook: Q1 2018
JLL Cleveland Office Outlook: Q1 2018Andrew Batson
 
JLL Cleveland Office Outlook: Q1 2018
JLL Cleveland Office Outlook: Q1 2018JLL Cleveland Office Outlook: Q1 2018
JLL Cleveland Office Outlook: Q1 2018Andrew Batson
 
JLL West Michigan Industrial Insight & Statistics - Q2 2018
JLL West Michigan Industrial Insight & Statistics - Q2 2018JLL West Michigan Industrial Insight & Statistics - Q2 2018
JLL West Michigan Industrial Insight & Statistics - Q2 2018Harrison West
 
JLL Louisville Industrial Outlook - Q1 2019
JLL Louisville Industrial Outlook - Q1 2019JLL Louisville Industrial Outlook - Q1 2019
JLL Louisville Industrial Outlook - Q1 2019Alex Westcott
 

What's hot (18)

2021 Q3 Office Austin Report
2021 Q3 Office Austin Report2021 Q3 Office Austin Report
2021 Q3 Office Austin Report
 
JLL Grand Rapids Office Insight & Statistics - Q3 2018
JLL Grand Rapids Office Insight & Statistics - Q3 2018JLL Grand Rapids Office Insight & Statistics - Q3 2018
JLL Grand Rapids Office Insight & Statistics - Q3 2018
 
1 q15 chicago_cbd_sublease_analysis
1 q15 chicago_cbd_sublease_analysis1 q15 chicago_cbd_sublease_analysis
1 q15 chicago_cbd_sublease_analysis
 
St. Louis Office Insight
St. Louis Office InsightSt. Louis Office Insight
St. Louis Office Insight
 
JLL Pittsburgh Industrial Insight - Q2 2015
JLL Pittsburgh Industrial Insight - Q2 2015JLL Pittsburgh Industrial Insight - Q2 2015
JLL Pittsburgh Industrial Insight - Q2 2015
 
JLL Grand Rapids Office Insight & Statistics - Q1 2018
JLL Grand Rapids Office Insight & Statistics - Q1 2018JLL Grand Rapids Office Insight & Statistics - Q1 2018
JLL Grand Rapids Office Insight & Statistics - Q1 2018
 
Q1 2018 | Fort Bend | Submarket Snapshot
Q1 2018 | Fort Bend | Submarket SnapshotQ1 2018 | Fort Bend | Submarket Snapshot
Q1 2018 | Fort Bend | Submarket Snapshot
 
JLL Grand Rapids Office Insight & Statistics - Spring 2017
JLL Grand Rapids Office Insight & Statistics - Spring 2017JLL Grand Rapids Office Insight & Statistics - Spring 2017
JLL Grand Rapids Office Insight & Statistics - Spring 2017
 
JLL Office Insight Q3 2015 - Indianapolis
JLL Office Insight Q3 2015 - IndianapolisJLL Office Insight Q3 2015 - Indianapolis
JLL Office Insight Q3 2015 - Indianapolis
 
JLL Grand Rapids Office Insight & Statistics - Q2 2019
JLL Grand Rapids Office Insight & Statistics - Q2 2019JLL Grand Rapids Office Insight & Statistics - Q2 2019
JLL Grand Rapids Office Insight & Statistics - Q2 2019
 
Chicago Suburbs Office Insight - Q2 2016
Chicago Suburbs Office Insight - Q2 2016Chicago Suburbs Office Insight - Q2 2016
Chicago Suburbs Office Insight - Q2 2016
 
JLL Columbus Chart of the Week: November 23, 2015
JLL Columbus Chart of the Week: November 23, 2015 JLL Columbus Chart of the Week: November 23, 2015
JLL Columbus Chart of the Week: November 23, 2015
 
Pittsburgh Office Insight & Stats Q1 2022
Pittsburgh Office Insight & Stats Q1 2022Pittsburgh Office Insight & Stats Q1 2022
Pittsburgh Office Insight & Stats Q1 2022
 
JLL Cleveland Office Outlook: Q1 2018
JLL Cleveland Office Outlook: Q1 2018JLL Cleveland Office Outlook: Q1 2018
JLL Cleveland Office Outlook: Q1 2018
 
JLL Cleveland Office Outlook: Q1 2018
JLL Cleveland Office Outlook: Q1 2018JLL Cleveland Office Outlook: Q1 2018
JLL Cleveland Office Outlook: Q1 2018
 
JLL West Michigan Industrial Insight & Statistics - Q2 2018
JLL West Michigan Industrial Insight & Statistics - Q2 2018JLL West Michigan Industrial Insight & Statistics - Q2 2018
JLL West Michigan Industrial Insight & Statistics - Q2 2018
 
JLL Louisville Industrial Outlook - Q1 2019
JLL Louisville Industrial Outlook - Q1 2019JLL Louisville Industrial Outlook - Q1 2019
JLL Louisville Industrial Outlook - Q1 2019
 
1 q15 chicago_suburban_sublease_analysis
1 q15 chicago_suburban_sublease_analysis1 q15 chicago_suburban_sublease_analysis
1 q15 chicago_suburban_sublease_analysis
 

Viewers also liked

Able tax draft instructions
Able tax draft instructionsAble tax draft instructions
Able tax draft instructionsPaul Curley, CFA
 
Humanities3 130919101104-phpapp01
Humanities3 130919101104-phpapp01Humanities3 130919101104-phpapp01
Humanities3 130919101104-phpapp01maverick2908
 
Daniels artikel
Daniels artikelDaniels artikel
Daniels artikellillefille
 
Un paraíso soñador
Un paraíso soñadorUn paraíso soñador
Un paraíso soñadorandres
 
Html加css实现圆角表格效果
Html加css实现圆角表格效果Html加css实现圆角表格效果
Html加css实现圆角表格效果mornone
 
Spanish 2 a phone conversation
Spanish 2 a phone conversationSpanish 2 a phone conversation
Spanish 2 a phone conversationBrain415999
 
Грег Уильямс. Лекция специального гостя.
Грег Уильямс. Лекция специального гостя.Грег Уильямс. Лекция специального гостя.
Грег Уильямс. Лекция специального гостя.permforum
 
Conavi avance al 2 de Mayo de 2012
Conavi avance al 2 de Mayo de 2012Conavi avance al 2 de Mayo de 2012
Conavi avance al 2 de Mayo de 2012Sergio Velazco
 

Viewers also liked (14)

Able tax draft instructions
Able tax draft instructionsAble tax draft instructions
Able tax draft instructions
 
Humanities3 130919101104-phpapp01
Humanities3 130919101104-phpapp01Humanities3 130919101104-phpapp01
Humanities3 130919101104-phpapp01
 
Daniels artikel
Daniels artikelDaniels artikel
Daniels artikel
 
Uten
UtenUten
Uten
 
Un paraíso soñador
Un paraíso soñadorUn paraíso soñador
Un paraíso soñador
 
Lact embarazo y tamden
Lact embarazo y tamdenLact embarazo y tamden
Lact embarazo y tamden
 
Latraviata
LatraviataLatraviata
Latraviata
 
Html加css实现圆角表格效果
Html加css实现圆角表格效果Html加css实现圆角表格效果
Html加css实现圆角表格效果
 
Agricia fm
Agricia fmAgricia fm
Agricia fm
 
Extremadura
ExtremaduraExtremadura
Extremadura
 
Spanish 2 a phone conversation
Spanish 2 a phone conversationSpanish 2 a phone conversation
Spanish 2 a phone conversation
 
Грег Уильямс. Лекция специального гостя.
Грег Уильямс. Лекция специального гостя.Грег Уильямс. Лекция специального гостя.
Грег Уильямс. Лекция специального гостя.
 
Charintorn 54261504 inc2 b
Charintorn 54261504 inc2 bCharintorn 54261504 inc2 b
Charintorn 54261504 inc2 b
 
Conavi avance al 2 de Mayo de 2012
Conavi avance al 2 de Mayo de 2012Conavi avance al 2 de Mayo de 2012
Conavi avance al 2 de Mayo de 2012
 

Similar to Cincinnati office insight q2 2015

JLL Cleveland Office Outlook: Q1 2018
JLL Cleveland Office Outlook: Q1 2018JLL Cleveland Office Outlook: Q1 2018
JLL Cleveland Office Outlook: Q1 2018Andrew Batson
 
Office market trends and outlook (Q4 2015)
Office market trends and outlook (Q4 2015) Office market trends and outlook (Q4 2015)
Office market trends and outlook (Q4 2015) JLL
 
2Q16 CBD Market Report
2Q16 CBD Market Report2Q16 CBD Market Report
2Q16 CBD Market ReportAmy Binstein
 
Atlanta Q4 Market Update - Office
Atlanta Q4 Market Update - Office Atlanta Q4 Market Update - Office
Atlanta Q4 Market Update - Office James Koontz
 
Washington, DC Office Sector Report (Q2 2016)
Washington, DC Office Sector Report (Q2 2016)Washington, DC Office Sector Report (Q2 2016)
Washington, DC Office Sector Report (Q2 2016)Savills Studley
 
JLL Cleveland Office Outlook: Q3 2018
JLL Cleveland Office Outlook: Q3 2018JLL Cleveland Office Outlook: Q3 2018
JLL Cleveland Office Outlook: Q3 2018Andrew Batson
 
BSRE Q3 2015 Market Update
BSRE Q3 2015 Market UpdateBSRE Q3 2015 Market Update
BSRE Q3 2015 Market UpdateJon Mook
 
Atlanta Office Sector Report (Q2 2016)
Atlanta Office Sector Report (Q2 2016)Atlanta Office Sector Report (Q2 2016)
Atlanta Office Sector Report (Q2 2016)Savills Studley
 
Pittsburgh Office Insight & Stats Q4 2021
Pittsburgh Office Insight & Stats Q4 2021Pittsburgh Office Insight & Stats Q4 2021
Pittsburgh Office Insight & Stats Q4 2021Tobiah Bilski
 
Q3 2015 Industrial Brief
Q3 2015 Industrial BriefQ3 2015 Industrial Brief
Q3 2015 Industrial BriefRyan Searle
 

Similar to Cincinnati office insight q2 2015 (20)

Office Insight Q3 2015-Grand Rapids
Office Insight Q3 2015-Grand RapidsOffice Insight Q3 2015-Grand Rapids
Office Insight Q3 2015-Grand Rapids
 
JLL Cleveland Office Insight - Q2 2015
JLL Cleveland Office Insight - Q2 2015JLL Cleveland Office Insight - Q2 2015
JLL Cleveland Office Insight - Q2 2015
 
JLL Cleveland Office Outlook: Q1 2018
JLL Cleveland Office Outlook: Q1 2018JLL Cleveland Office Outlook: Q1 2018
JLL Cleveland Office Outlook: Q1 2018
 
Office market trends and outlook (Q4 2015)
Office market trends and outlook (Q4 2015) Office market trends and outlook (Q4 2015)
Office market trends and outlook (Q4 2015)
 
2Q16 CBD Market Report
2Q16 CBD Market Report2Q16 CBD Market Report
2Q16 CBD Market Report
 
Atlanta Q4 Market Update - Office
Atlanta Q4 Market Update - Office Atlanta Q4 Market Update - Office
Atlanta Q4 Market Update - Office
 
Washington, DC Office Sector Report (Q2 2016)
Washington, DC Office Sector Report (Q2 2016)Washington, DC Office Sector Report (Q2 2016)
Washington, DC Office Sector Report (Q2 2016)
 
JLL Cleveland Office Outlook: Q3 2018
JLL Cleveland Office Outlook: Q3 2018JLL Cleveland Office Outlook: Q3 2018
JLL Cleveland Office Outlook: Q3 2018
 
HCMC Market Insights Q32015 (English version)
HCMC Market Insights Q32015 (English version)HCMC Market Insights Q32015 (English version)
HCMC Market Insights Q32015 (English version)
 
JLL Cleveland Industrial Insight - Q2 2015
JLL Cleveland Industrial Insight - Q2 2015JLL Cleveland Industrial Insight - Q2 2015
JLL Cleveland Industrial Insight - Q2 2015
 
BSRE Q3 2015 Market Update
BSRE Q3 2015 Market UpdateBSRE Q3 2015 Market Update
BSRE Q3 2015 Market Update
 
Atlanta Office Sector Report (Q2 2016)
Atlanta Office Sector Report (Q2 2016)Atlanta Office Sector Report (Q2 2016)
Atlanta Office Sector Report (Q2 2016)
 
KM MV Q2 2017
KM MV Q2 2017KM MV Q2 2017
KM MV Q2 2017
 
Pittsburgh Office Insight & Stats Q4 2021
Pittsburgh Office Insight & Stats Q4 2021Pittsburgh Office Insight & Stats Q4 2021
Pittsburgh Office Insight & Stats Q4 2021
 
Houston 2Q15
Houston 2Q15Houston 2Q15
Houston 2Q15
 
Columbus Office Insight - Q1 2015
Columbus Office Insight - Q1 2015Columbus Office Insight - Q1 2015
Columbus Office Insight - Q1 2015
 
Q1 2018 | Houston Office | Research & Forecast Report
Q1 2018 | Houston Office | Research & Forecast ReportQ1 2018 | Houston Office | Research & Forecast Report
Q1 2018 | Houston Office | Research & Forecast Report
 
HN Market Insights Q22015 - Office Sector (ENG)
HN Market Insights Q22015 - Office Sector (ENG)HN Market Insights Q22015 - Office Sector (ENG)
HN Market Insights Q22015 - Office Sector (ENG)
 
Q4 2019 | Austin Office | Research & Forecast Report
Q4 2019 | Austin Office | Research & Forecast ReportQ4 2019 | Austin Office | Research & Forecast Report
Q4 2019 | Austin Office | Research & Forecast Report
 
Q3 2015 Industrial Brief
Q3 2015 Industrial BriefQ3 2015 Industrial Brief
Q3 2015 Industrial Brief
 

More from JLL_Midwest_Great_Lakes_Research

JLL Minneapolis-St. Paul Chart of the Week: September 28, 2015
JLL Minneapolis-St. Paul Chart of the Week: September 28, 2015JLL Minneapolis-St. Paul Chart of the Week: September 28, 2015
JLL Minneapolis-St. Paul Chart of the Week: September 28, 2015JLL_Midwest_Great_Lakes_Research
 

More from JLL_Midwest_Great_Lakes_Research (20)

JLL Indianapolis Chart of the Week
JLL Indianapolis Chart of the WeekJLL Indianapolis Chart of the Week
JLL Indianapolis Chart of the Week
 
Minneapolis–St. Paul Chart of the Week October 20, 2015
Minneapolis–St. Paul Chart of the Week October 20, 2015Minneapolis–St. Paul Chart of the Week October 20, 2015
Minneapolis–St. Paul Chart of the Week October 20, 2015
 
JLL Detroit Chart of the Week: October 19, 2015
JLL Detroit Chart of the Week: October 19, 2015JLL Detroit Chart of the Week: October 19, 2015
JLL Detroit Chart of the Week: October 19, 2015
 
Office Insight Q3 2015 | Minneapolis-St. Paul
Office Insight Q3 2015 | Minneapolis-St. PaulOffice Insight Q3 2015 | Minneapolis-St. Paul
Office Insight Q3 2015 | Minneapolis-St. Paul
 
Office Insight Q3 2015-Chicago CBD
Office Insight Q3 2015-Chicago CBDOffice Insight Q3 2015-Chicago CBD
Office Insight Q3 2015-Chicago CBD
 
Indianapolis JLL Employment Update - October 2015
Indianapolis JLL Employment Update - October 2015Indianapolis JLL Employment Update - October 2015
Indianapolis JLL Employment Update - October 2015
 
Leasing Activity Sheet Q3 2015-Detroit
Leasing Activity Sheet Q3 2015-DetroitLeasing Activity Sheet Q3 2015-Detroit
Leasing Activity Sheet Q3 2015-Detroit
 
Office Insight Q3 2015-Detroit
Office Insight Q3 2015-DetroitOffice Insight Q3 2015-Detroit
Office Insight Q3 2015-Detroit
 
Minneapolis St. Paul - Employment Update October 2015
Minneapolis St. Paul - Employment Update October 2015Minneapolis St. Paul - Employment Update October 2015
Minneapolis St. Paul - Employment Update October 2015
 
Chicago JLL employment update - October 2015
Chicago JLL employment update - October 2015Chicago JLL employment update - October 2015
Chicago JLL employment update - October 2015
 
Jll Detroit Employment Update October 2015
Jll Detroit Employment Update October 2015Jll Detroit Employment Update October 2015
Jll Detroit Employment Update October 2015
 
JLL Chart of the Week - Indianapolis
JLL Chart of the Week - IndianapolisJLL Chart of the Week - Indianapolis
JLL Chart of the Week - Indianapolis
 
JLL Minneapolis-St. Paul Chart of the Week: September 28, 2015
JLL Minneapolis-St. Paul Chart of the Week: September 28, 2015JLL Minneapolis-St. Paul Chart of the Week: September 28, 2015
JLL Minneapolis-St. Paul Chart of the Week: September 28, 2015
 
Chart of the Week - Indianapolis
Chart of the Week - IndianapolisChart of the Week - Indianapolis
Chart of the Week - Indianapolis
 
JLL Detroit Chart of the Week: September 14, 2015
JLL Detroit Chart of the Week: September 14, 2015JLL Detroit Chart of the Week: September 14, 2015
JLL Detroit Chart of the Week: September 14, 2015
 
JLL Chicago Chart of the Week - September 14, 2015
JLL Chicago Chart of the Week - September 14, 2015JLL Chicago Chart of the Week - September 14, 2015
JLL Chicago Chart of the Week - September 14, 2015
 
Indianapolis JLL Employment Update September 2015
Indianapolis JLL Employment Update September 2015Indianapolis JLL Employment Update September 2015
Indianapolis JLL Employment Update September 2015
 
Chicago jll employment update september 2015
Chicago jll employment update september 2015Chicago jll employment update september 2015
Chicago jll employment update september 2015
 
JLL Cleveland Chart of the Week: September 7, 2015
JLL Cleveland Chart of the Week: September 7, 2015JLL Cleveland Chart of the Week: September 7, 2015
JLL Cleveland Chart of the Week: September 7, 2015
 
JLL Pittsburgh Chart of the Week: August 31, 2015
JLL Pittsburgh Chart of the Week: August 31, 2015JLL Pittsburgh Chart of the Week: August 31, 2015
JLL Pittsburgh Chart of the Week: August 31, 2015
 

Cincinnati office insight q2 2015

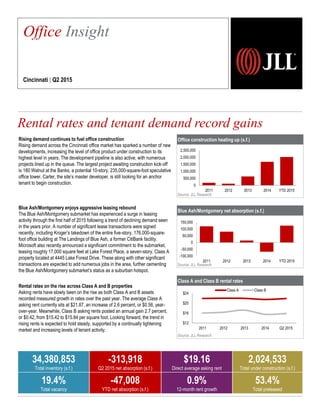
  • 1. Office construction heating up (s.f.) Source: JLL Research Blue Ash/Montgomery net absorption (s.f.) Source: JLL Research Class A and Class B rental rates Source: JLL Research Rising demand continues to fuel office construction Rising demand across the Cincinnati office market has sparked a number of new developments, increasing the level of office product under construction to its highest level in years. The development pipeline is also active, with numerous projects lined up in the queue. The largest project awaiting construction kick-off is 180 Walnut at the Banks, a potential 10-story, 235,000-square-foot speculative office tower. Carter, the site’s master developer, is still looking for an anchor tenant to begin construction. Blue Ash/Montgomery enjoys aggressive leasing rebound The Blue Ash/Montgomery submarket has experienced a surge in leasing activity through the first half of 2015 following a trend of declining demand seen in the years prior. A number of significant lease transactions were signed recently, including Kroger’s takedown of the entire five-story, 176,000-square- foot office building at The Landings of Blue Ash, a former CitiBank facility. Microsoft also recently announced a significant commitment to the submarket, leasing roughly 17,000 square feet at Lake Forest Place, a seven-story, Class A property located at 4445 Lake Forest Drive. These along with other significant transactions are expected to add numerous jobs in the area, further cementing the Blue Ash/Montgomery submarket’s status as a suburban hotspot. Rental rates on the rise across Class A and B properties Asking rents have slowly been on the rise as both Class A and B assets recorded measured growth in rates over the past year. The average Class A asking rent currently sits at $21.87, an increase of 2.6 percent, or $0.56, year- over-year. Meanwhile, Class B asking rents posted an annual gain 2.7 percent, or $0.42, from $15.42 to $15.84 per square foot. Looking forward, the trend in rising rents is expected to hold steady, supported by a continually tightening market and increasing levels of tenant activity. Rental rates and tenant demand record gains 2,257 Office Insight Cincinnati | Q2 2015 34,380,853 Total inventory (s.f.) -313,918 Q2 2015 net absorption (s.f.) $19.16 Direct average asking rent 2,024,533 Total under construction (s.f.) 19.4% Total vacancy -47,008 YTD net absorption (s.f.) 0.9% 12-month rent growth 53.4% Total preleased 0 500,000 1,000,000 1,500,000 2,000,000 2,500,000 2011 2012 2013 2014 YTD 2015 -100,000 -50,000 0 50,000 100,000 150,000 2011 2012 2013 2014 YTD 2015 $12 $16 $20 $24 2011 2012 2013 2014 Q2 2015 Class A Class B
  • 2. Current conditions – submarket Historical leasing activity (s.f.) Source: JLL Research Source: JLL Research Total net absorption (s.f.) Source: JLL Research Total vacancy rate (%) Source: JLL Research Direct average asking rent ($ p.s.f.) Source: JLL Research -464,648 79,469 143,641 290,120 562,970 -47,008 -600,000 -400,000 -200,000 0 200,000 400,000 600,000 800,000 2010 2011 2012 2013 2014 YTD 2015 $17.39 $17.94 $18.41 $19.68 $19.15 $19.16 $14.00 $16.00 $18.00 $20.00 $22.00 $24.00 2010 2011 2012 2013 2014 YTD 2015 22.7% 22.6% 22.5% 21.3% 19.8% 19.4% 10.0% 15.0% 20.0% 25.0% 2010 2011 2012 2013 2014 YTD 2015 Landlordleverage Tenantleverage Peaking market Falling market Bottoming market Rising market Kenwood 2,700,000 1,700,000 1,800,000 2,200,000 640,000 0 500,000 1,000,000 1,500,000 2,000,000 2,500,000 3,000,000 2011 2012 2013 2014 YTD 2015 Blue Ash / Montgomery, Midtown, Fields Ertel / Mason, West Chester ©2015 Jones Lang LaSalle IP, Inc. All rights reserved.For more information, contact: Cody Brooks | cody.brooks@am.jll.com CBD Peripheral, NKY Riverfront CBD, Tri-County East, West Northern Kentucky