Washington, DC Office Sector Report (Q2 2016)
•
0 likes•76 views

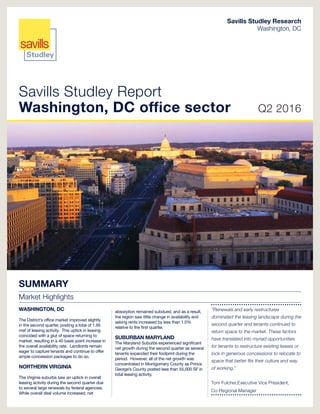
Renewals and early restructures dominated the leasing landscape during the second quarter and tenants continued to return space to the market. These factors have translated into myriad opportunities for tenants to restructure existing leases or lock in generous concessions to relocate to space that better fits their culture and way of working.

Recommended
Recommended
More Related Content
Viewers also liked
Similar to Washington, DC Office Sector Report (Q2 2016)
Similar to Washington, DC Office Sector Report (Q2 2016) (20)
Recently uploaded
Recently uploaded (20)
Washington, DC Office Sector Report (Q2 2016)
- 1. Savills Studley Report Washington, DC office sector Q2 2016 Savills Studley Research Washington, DC SUMMARY Market Highlights WASHINGTON, DC The District’s office market improved slightly in the second quarter, posting a total of 1.95 msf of leasing activity. This uptick in leasing coincided with a glut of space returning to market, resulting in a 40 basis point increase in the overall availability rate. Landlords remain eager to capture tenants and continue to offer ample concession packages to do so. NORTHERN VIRGINIA The Virginia suburbs saw an uptick in overall leasing activity during the second quarter due to several large renewals by federal agencies. While overall deal volume increased, net absorption remained subdued, and as a result, the region saw little change in availability and asking rents increased by less than 1.0% relative to the first quarter. SUBURBAN MARYLAND The Maryland Suburbs experienced significant net growth during the second quarter as several tenants expanded their footprint during the period. However, all of the net growth was concentrated in Montgomery County as Prince George’s County posted less than 55,000 SF in total leasing activity. “Renewals and early restructures dominated the leasing landscape during the second quarter and tenants continued to return space to the market. These factors have translated into myriad opportunities for tenants to restructure existing leases or lock in generous concessions to relocate to space that better fits their culture and way of working.” Tom Fulcher,Executive Vice President, Co-Regional Manager
- 2. 02 Savills Studley Report | Washington, DC Lackluster Performance Ensures Tenant-Favorable Conditions Persist in DC Washington, DC’s office market has thus far failed to reach the heights of 2015’s robust leasing environment, which posted over 6.5 msf of activity after two quarters. This year, leasing activity totals just 3.5 msf at the end of the second quarter – a 46.1% decrease year-over-year. The very top end of Class A product, especially space in newly constructed and trophy quality buildings, remains in demand but the rest of the market is lagging. Owners of non-trophy Class A and B buildings are attempting to bridge the gap via several routes. They are making substantial capital improvements to their properties and offering abated rent periods and improvement allowances. So far, these escalating efforts have not had a significant positive impact on the overall market. This works to the advantage of tenants. They can capitalize on a soft market, often moving to a new location that makes more financial sense and better suits their way of working, or they can restructure their existing deal and reduce their footprint. Tenants have been giving back space at an unprecedented rate, resulting in an availability rate that rose 0.4 pp from last quarter to 12.9% - the equivalent of nearly 600,000 sf of space. The District’s downtown core accounted for the majority of the market’s leasing once again, totaling over 1.4 msf between the CBD and East End/Convention Center submarkets. The CBD was the site of Washington, DC’s largest lease of the quarter – a deal by the Board of Governors of the Federal Reserve System for 218,552 sf at International Square. New construction in fringe markets has sparked interest in areas outside of the core, especially in Southwest where the International Spy Museum inked a deal for 140,000 sf at a new building at 900 L’Enfant Plaza, SW. Despite Some Signs of Growth, Northern Virginia Fundamentals Remain Largely Unchanged After a sluggish start to 2016, total leasing activity in the Virginia suburbs rebounded in the second quarter, rising by 60.0% relative to the first quarter. The increase in leasing activity did not translate into meaningful net new growth as a significant portion of the region’s leasing volume continued to come in the form of renewals and early restructures. As a result, the region’s over-all availability rate remained largely unchanged inching down by just 0.1 pp relative to the first quarter. Average asking rents posted a slight quarter-on-quarter increase but remain just 0.5% above the levels seen one year ago. With nearly 36.0 million square feet of space available in Northern Virginia, leasing fundamentals remain extremely tenant favorable Source: Bureau of Labor Statistics 2007 2008 2009 2010 2011 2012 2013 2014 2015 2016 -8.0% -6.0% -4.0% -2.0% 0.0% 2.0% 4.0% 0.68 0.70 0.72 0.74 0.76 0.78 0.80 Millions WDC. Office Emp. WDC. (% Annual Change) U.S. (% Annual Change) Office-Using Employment Trends $56.58 $51.35 $32.75 $30.75 $27.20$27.33 $10 $20 $30 $40 $50 $60 $70 2Q162Q152Q142Q132Q122Q11 ($/sf) Class A Rental Rate Trends Washington, DC Virginia Maryland Class A Asking Rent Trends 13.2% 10.6% 22.9% 18.7% 21.8% 0% 5% 10% 15% 20% 25% 30% 2Q162Q152Q142Q132Q122Q11 (%) Class A Availability Rate Trends Washington, DC Virginia Maryland Class A Availability Rate Trends
- 3. savills-studley.com/research 03 Q2 2016 Tenant Sq Feet Address Market Area GSA - Transportation Security Administration 551,916 601 & 701 S 12th St Arlington County United States Nuclear Regulatory Commission* 347,922 11545 Rockville Pike Montgomery County Board of Governors of the Federal Reserve System* 218,552 1850 K St NW, 1825 & 1875 Eye St NW Central Business District Abt Associates Inc. 154,951 6130 Executive Blvd Montgomery County Novavax, Inc 147,051 1201 Clopper Rd Montgomery County International Spy Museum 140,000 900 L'enfant Plz SW Southwest Wellstat Management Company LLC 115,255 14200 Shady Grove Rd Montgomery County EY 107,825 1101 New York Ave NW East End/Convention Center GSA - Customs & Border Protection 106,000 7799 Leesburg Pike Fairfax County Grant Thornton LLP 76,000 1000 Wilson Blvd Arlington County Sum of Top 10 Leases 1,965,472 Sum of 2nd Quarter Leasing Activity 5.7 MSF *Savills Studley Deal as landlords continue to offer generous concession packages in order to attract tenants. Suburban Maryland Availability Declines in Response to Significant Net New Growth Overall availability in the Maryland Suburbs decreased sharply during the second quarter, ending the period at 18.2%, the lowest availability rate since the first quarter of 2013. Several tenants signed leases that represented significant growth for the region including Abt Associates full-building lease totaling 154,951 SF at 6130 Executive Blvd in North Bethesda. Abt Associates will relocate from 4550 Montgomery Ave in Downtown Bethesda and will expand their footprint by nearly 25,000 SF. Novavax also signed a full-building lease totaling 147,051 SF at 1201 Clopper Rd in Gaithersburg. University Research Company expanded during the second quarter as well, signing a lease for 53,490 SF at 5404 Wisconsin Ave in Chevy Chase. Submarket Focus Despite being one of Washington DC’s premier office submarkets, East End/Convention Center is saddled with one of the highest availability rates in the District (16.4%), leaving plenty of quality opportunities for tenants seeking a move to the downtown core. Quarterly leasing in the East End increased by 15.7%, totaling nearly 757,000 sf, but that figure is 28.0% lower than the same period last year and year-to-date leasing activity of 1.4 msf is less than half of the total during the first half of 2015. East End’s largest lease of the quarter was completed by EY for 107,825 sf at 1101 New York Ave, NW, which was a reduction of approximately 20,000 sf. Other notable leases include Thomson Reuters’ consolidation into 49,206 sf at 1333 H St NW and Clark Hill’s sublease for 38,640 sf at 1001 Pennsylvania Ave, NW. Arlington County posted 984,954 SF in overall leasing activity during the second quarter, more than doubling the total from the previous quarter. On the surface this may seem like an encouraging sign for Arlington, however, more than half of the County’s quarterly leasing volume can be attributed to the TSA’s short-term renewal in Pentagon City. Supply continued to outpace demand, sustaining the historically high levels of availability seen throughout the submarket. As of the end of the second quarter, Arlington County had a total of 8.1M SF of available space; two thirds of which was comprised of Class A space. Limited net demand and a growing inventory of available space combined to put downward pressure on average rental rates with the Class A rate posting the sharpest decline; a 0.4% quarter- over quarter decrease. North Bethesda/Potomac tallied 613,309 SF in total leasing activity this quarter, accounting for 37.0% of Suburban Maryland’s overall leasing volume. The submarket landed the largest Suburban Maryland transaction of the second quarter when the Nuclear Regulatory Commission completed an early lease restructure for 347,922 SF at Two White Flint. Outlook The District’s office market showed little positive movement to indicate that the tenant- friendly environment is fading. Many firms are still seeking early renewals and restructures and landlords are more than happy to oblige. Owners of underperforming product throughout Washington, DC are being forced to spend substantial amounts of cash up front to bring their buildings up to the standard expected in a Class A building – deals are not materializing at the rate seen in the last two or three years though, compelling landlords to be aggressive in their pursuit of new tenants. Northern Virginia’s office leasing environment will remain tenant-friendly for the foreseeable future. Despite some signs of net new growth during the second quarter, there remains 36.0M SF of office space available throughout the region. Early lease restructures and renewals continue to make up a significant portion of leasing activity, doing little to precipitate a significant decrease in availability. Asking rents are expected to increase slightly; however, effective rents will continue to decline as a result of the record-high concessions currently offered by landlords. While Suburban Maryland has experienced moderate growth in 2016, tenant-favorable conditions are expected to persist for the near to mid-term. Prince George’s County, which only registered 54,500 SF in total leasing activity, is expected to continue to lag behind the rest of the region, putting upward pressure on availability and downward pressure on asking rents. Long-term, Suburban Maryland is likely to benefit from new, mixed-use development along the region’s planned Purple Line. Availability Rate Comparison Rental Rate Comparison Major Transactions $58.53 $56.13 $54.08 $52.06 $51.36 $47.45 $47.25 $42.94 $41.35 $40.81 $38.80 $33.06 $32.83 $30.90 $28.49 $28.00 $26.37 $23.26 $21.65 $0 $10 $20 $30 $40 $50 $60 Capitol Hill E End/Cnv Ctr West End CBD Washington, DC NoMa Southwest Georgetown Capitol Riverfront Uptown Arlington County US Index Alexandria Northern Virginia Montgomery Cty Fairfax County Suburban MD Ldn/Stffrd/Pr Wm Pr George's Cty ($/sf) Overall Rental Rate Comparison 9.0% 9.3% 9.8% 10.1% 10.3% 12.9% 13.4% 16.4% 16.5% 16.7% 17.0% 17.8% 18.2% 19.2% 19.3% 21.4% 21.7% 21.8% 22.7% 0% 5% 10% 15% 20% 25% Capitol Hill Southwest Georgetown CBD NoMa Washington, DC West End E End/Cnv Ctr Ldn/Stffrd/Pr Wm Montgomery Cty US Index Uptown Suburban MD Capitol Riverfront Pr George's Cty Northern Virginia Fairfax County Arlington County Alexandria (%) Availability Rate Comparison
- 4. Savills Studley Report | Washington, DC 04 Submarket Total SF (1000's) Last 12 Months 5 Year Average This Quarter % Change from Last Qtr. Last Quarter Year Ago This Quarter pp Change from Last Qtr. (1) Last Quarter Year Ago This Quarter % Change from Last Qtr. Last Quarter Year Ago Capitol Hill 5,776 332 325 518 -23.7% 522 717 9.0% -2.8% 9.0% 12.4% $58.53 1.8% $57.75 $53.99 Capitol Hill - Class A 2,136 232 162 344 16.9% 295 342 16.1% 2.3% 13.8% 16.0% $60.86 0.9% $60.27 $59.07 Capitol Riverfront 5,343 110 M/A 1,024 1.9% 1,029 784 19.2% 0.4% 19.2% 14.7% $41.35 -0.4% $40.98 $40.94 Capitol Riverfront - Class A 4,088 110 M/A 608 3.2% 613 564 14.9% 0.5% 15.0% 13.8% $44.01 -0.9% $43.19 $42.32 NoMa 12,001 1,116 M/A 1,231 11.0% 1,016 1,469 10.3% 1.0% 8.5% 12.2% $47.45 1.6% $45.89 $45.82 NoMa - Class A 9,661 1,023 M/A 825 12.2% 689 1,010 8.5% 0.9% 7.1% 10.5% $52.60 1.9% $51.04 $51.76 East End/Convention Center 42,972 4,565 3,572 7,044 7.6% 6,548 7,006 16.4% 1.2% 15.2% 16.3% $56.13 0.3% $54.70 $53.45 East End/Convention Center - Class A 29,821 3,516 2,653 4,903 4.2% 4,825 4,953 16.4% 0.7% 16.2% 16.6% $60.89 0.9% $59.02 $57.64 Central Business District 38,664 3,284 3,055 3,915 0.4% 4,060 4,712 10.1% 0.0% 10.5% 12.2% $52.06 0.8% $50.89 $50.52 Central Business District - Class A 14,572 2,371 1,665 1,509 -1.4% 1,634 2,177 10.4% -0.1% 11.2% 14.9% $57.65 0.6% $57.22 $57.16 West End 3,863 151 131 516 10.2% 535 632 13.4% 1.2% 13.8% 16.4% $54.08 0.0% $53.09 $52.24 West End - Class A 2,646 76 106 516 10.2% 535 534 19.5% 1.8% 20.2% 20.2% $54.08 0.0% $53.09 $52.24 Georgetown 2,743 160 202 269 19.1% 216 245 9.8% 1.6% 7.9% 8.9% $42.94 1.8% $40.82 $39.57 Georgetown - Class A 1,190 20 83 112 98.3% 47 52 9.4% 4.7% 3.9% 4.4% $45.72 -1.1% $45.75 $44.78 Southwest 12,852 1,109 932 1,201 -3.4% 1,240 1,579 9.3% -0.3% 9.6% 12.3% $47.25 -0.2% $47.31 $46.90 Southwest - Class A 8,813 573 544 801 -3.4% 828 931 9.1% -0.3% 9.4% 10.6% $48.60 -0.2% $49.06 $49.00 Uptown 6,303 172 379 1,119 3.5% 1,168 1,132 17.8% 0.6% 18.5% 18.0% $40.81 -1.6% $40.80 $40.87 Uptown - Class A 602 8 44 88 4.0% 9,661 18 14.6% 0.6% 12.2% 3.0% $40.11 0.0% $39.79 $44.40 Fairfax County 100,889 4,710 6,307 21,885 -1.5% 22,463 22,100 21.7% -0.3% 22.3% 21.9% $28.00 0.9% $27.96 $27.96 Fairfax County - Class A 60,660 3,412 4,450 14,315 -0.1% 14,869 14,502 23.6% 0.0% 24.5% 23.9% $30.03 0.6% $29.97 $30.15 Alexandria 15,495 983 922 3,520 3.1% 3,863 3,407 22.7% 0.7% 21.6% 22.0% $32.83 3.0% $31.84 $31.12 Alexandria - Class A 7,868 174 449 1,348 8.7% 1,242 1,265 17.1% 1.4% 15.8% 16.1% $32.77 7.0% $30.40 $29.28 Arlington County 37,176 3,387 2,624 8,122 -3.7% 8,687 9,001 21.8% -0.8% 23.4% 24.2% $38.80 -0.1% $38.80 $38.54 Arlington County - Class A 22,364 1,445 1,633 5,182 0.1% 5,129 5,337 23.2% 0.0% 22.9% 23.9% $40.19 -0.2% $40.05 $39.83 Loudoun/Stafford/Prince William 14,993 1,188 686 2,469 11.8% 2,246 2,323 16.5% 1.7% 15.0% 15.5% $23.26 -0.1% $23.69 $23.22 Loudoun/Stafford/Prince William - Class A 6,202 980 481 1,374 13.5% 1,258 1,218 22.2% 2.6% 20.3% 19.6% $25.19 -0.6% $25.81 $25.48 Montgomery County 60,026 3,363 3,298 10,020 -3.8% 10,300 9,980 16.7% -0.7% 17.2% 16.6% $28.49 1.5% $28.43 $27.90 Montgomery County - Class A 31,570 2,195 2,275 5,908 -4.8% 6,051 5,775 18.7% -1.0% 19.2% 18.3% $29.82 1.2% $29.51 $29.73 Prince George's County 23,802 939 919 4,583 -1.7% 4,760 4,811 19.3% -0.3% 20.0% 20.2% $21.65 1.0% $22.00 $20.60 Prince George's County - Class A 11,534 544 624 2,871 -4.3% 3,031 3,132 24.9% -1.1% 26.3% 27.2% $21.58 0.4% $21.75 $20.62 Washington D.C. Total 130,518 10,945 9,504 16,837 3.6% 16,333 18,276 12.9% 0.4% 12.5% 14.0% $51.36 0.3% $50.37 $49.79 Washington D.C. Total - Class A 73,527 7,929 6,082 9,706 4.5% 9,539 10,580 13.2% 0.6% 13.0% 14.4% $56.58 0.5% $55.66 $55.05 Northern Virginia Total 168,582 10,267 10,539 35,996 -0.8% 36,742 36,831 21.4% -0.2% 21.8% 21.8% $30.90 0.9% $30.81 $30.74 Northern Virginia Total - Class A 97,094 6,011 7,012 22,219 1.2% 22,498 22,322 22.9% 0.3% 23.2% 23.0% $32.75 1.2% $32.41 $32.52 Suburban Maryland Total 80,299 4,302 4,241 14,603 -3.1% 15,060 14,792 18.2% -0.6% 18.8% 18.4% $26.37 1.2% $26.47 $25.49 Suburban Maryland Total - Class A 40,215 2,739 2,923 8,779 -4.7% 9,082 8,907 21.8% -1.1% 22.6% 22.1% $27.20 0.7% $27.11 $26.53 Greater Washington D.C. Total 379,399 25,514 24,284 67,436 -0.2% 68,135 69,898 17.8% 0.0% 18.0% 18.4% $35.50 1.0% $35.15 $34.85 Greater Washington D.C. Total - Class A 210,836 16,680 16,017 40,704 0.6% 41,119 41,809 19.3% 0.1% 19.5% 19.8% $37.62 0.9% $37.38 $37.15 Leasing Activity Available SF Availability Rate Asking Rents Per SF @SavillsStudleywww.savills-studley.com Please contact us for further information (1) Percentage point change for availability rates. Unless otherwise noted, all rents quoted throughout this report are average asking gross (full service) rents psf. Statistics are calculated using both direct and sublease information. Short-term sublet spaces (terms under two years) were excluded. The information in this report is obtained from sources deemed reliable, but no representation is made as to the accuracy thereof. Statistics compiled with the support of The CoStar Group. Copyright © 2016 Savills Studley Savills Studley Washington, DC 1201 F Street, N.W., Suite 500 Washington, DC 20004-1225 (202) 628-6000 Washington, DC Region Co-Branch Managers Thomas M. Fulcher Jr., EVP - tfulcher@savills-studley.com Lois A. Zambo, Vice Chairman - lzambo@savills-studley.com Richard P. Rome, EVP - rrome@savills-studley.com David Lipson, EVP - dlipson@savills-studley.com William P. Quinby, EVP - bquinby@savills-studley.com Gary Stein, EVP - gstein@savills-studley.com Savills Studley Suburban Washington 1600 Tysons Blvd. Suite 200 McLean, VA 22102-4865 (703) 442-9000