An analysis of surface temperature trends and variability along the Andes
•
0 likes•743 views

This study analyzed surface temperature trends along the Andes Mountains using over 850 stations in Ecuador, Peru and Chile between 1961-2010. It found that temperatures have generally increased along the Andes, with the strongest warming occurring in earlier decades. However, a cooling trend was observed near sea level along the Pacific coast. The study aimed to determine how much of the overall temperature increase could be attributed to natural climate variability versus human-caused greenhouse gas emissions. It found that climate modes like El Niño and the Pacific Decadal Oscillation influence interannual temperature changes but explain only a small portion of the long-term warming observed.

Recommended
More Related Content
What's hot
What's hot (20)
Viewers also liked
Viewers also liked (20)
Similar to An analysis of surface temperature trends and variability along the Andes
Similar to An analysis of surface temperature trends and variability along the Andes (20)
More from InfoAndina CONDESAN
More from InfoAndina CONDESAN (20)
An analysis of surface temperature trends and variability along the Andes
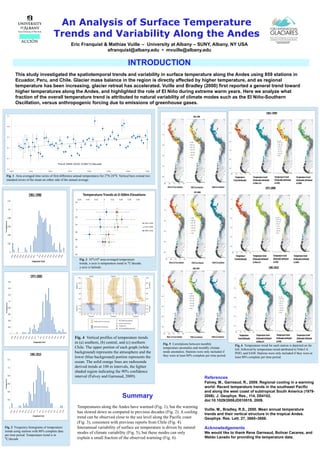
- 1. This study investigated the spatiotemporal trends and variability in surface temperature along the Andes using 859 stations in Ecuador, Peru, and Chile. Glacier mass balance in the region is directly affected by higher temperature, and as regional temperature has been increasing, glacier retreat has accelerated. Vuille and Bradley (2000) first reported a general trend toward higher temperatures along the Andes, and highlighted the role of El Niño during extreme warm years. Here we analyze what fraction of the overall temperature trend is attributed to natural variability of climate modes such as the El Niño-Southern Oscillation, versus anthropogenic forcing due to emissions of greenhouse gases. References Falvey, M., Garreaud, R., 2009. Regional cooling in a warming world: Recent temperature trends in the southeast Pacific and along the west coast of subtropical South America (1979- 2006). J. Geophys. Res., 114, D04102, doi:10.1029/2008JD010519, 2009. Vuille, M., Bradley, R.S., 2000. Mean annual temperature trends and their vertical structure in the tropical Andes. Geophys. Res. Lett. 27, 3885–3888. Acknowledgements We would like to thank Rene Garreaud, Bolivar Caceres, and Waldo Lavado for providing the temperature data. An Analysis of Surface Temperature Trends and Variability Along the Andes Eric Franquist & Mathias Vuille – University at Albany – SUNY, Albany, NY USA efranquist@albany.edu • mvuille@albany.edu INTRODUCTION --85 --80 --75 --70 --65 0 --10 --20 --30 --40 --50 1961-1990 Nino3.4Correlation PDOCorrelation SAMCorrelation <0.0 0.0-0.1 0.1-0.2 0.2-0.3 0.3-0.4 0.4-0.5 >0.5 --85 --80 --75 --70 --65 0 --10 --20 --30 --40 --50 1971-2000 Nino3.4Correlation PDOCorrelation SAMCorrelation <0.0 0.0-0.1 0.1-0.2 0.2-0.3 0.3-0.4 0.4-0.5 >0.5 --85 --80 --75 --70 --65 0 --10 --20 --30 --40 --50 1981-2010 Nino 3.4Correlation PDOCorrelation SAMCorrelation <0.0 0.0-0.1 0.1-0.2 0.2-0.3 0.3-0.4 0.4-0.5 >0.5 1961-1990 -0.3--0.2 -0.2--0.1 -0.1-0 0-0.1 0.1-0.2 0.2-0.3 >0.3 -- 8 0 -- 7 5 -- 7 0 -- 6 5 0 -- 1 0 -- 2 0 -- 3 0 -- 4 0 -- 5 0 Temperature Trend(K/decade) Temperaturetrend (K/decade)attributed toNino3.4 Temperaturetrend (K/decade)attributed toPDO Temperaturetrend (K/decade)attributed toSAM < -0.3 -- 8 5 1971-2000 -0.3--0.2 -0.2--0.1 -0.1-0 0-0.1 0.1-0.2 0.2-0.3 >0.3 --80 --75 --70 --65 0 --10 --20 --30 --40 --50 Temperature Trend(K/decade) Temperaturetrend (K/decade)attributed toNino3.4 Temperaturetrend (K/decade)attributed toPDO Temperaturetrend (K/decade)attributed toSAM <-0.3 --85 1981-2010 -0.3--0.2 -0.2--0.1 -0.1-0 0-0.1 0.1-0.2 0.2-0.3 >0.3 --80 --75 --70 --65 0 --10 --20 --30 --40 --50 Temperature Trend(K/decade) Temperaturetrend (K/decade)attributed toNino3.4 Temperaturetrend (K/decade)attributed toPDO Temperaturetrend (K/decade)attributed toSAM <-0.3 --85 Fig. 2 Frequency histograms of temperature trends using stations with 80% complete data per time period. Temperature trend is in °C/decade Fig. 4 Vertical profiles of temperature trends in (a) southern, (b) central, and (c) northern Chile. The upper portion of each graph (white background) represents the atmosphere and the lower (blue background) portion represents the ocean. The solid orange lines are radiosonde derived trends at 100 m intervals, the lighter shaded region indicating the 90% confidence interval (Falvey and Garreaud, 2009). Fig. 1 Area averaged time series of first difference annual temperatures for 2°N-24°S. Vertical bars extend two standard errors of the mean on either side of the annual average. Fig. 5 Correlations between monthly temperature anomalies and monthly climate mode anomalies. Stations were only included if they were at least 80% complete per time period. Fig. 6 Temperature trend for each station is depicted on far left, followed by temperature trend attributed to Niño3.4, PDO, and SAM. Stations were only included if they were at least 80% complete per time period. Fig. 3 10°x10° area-averaged temperature trends, x-axis is temperature trend in °C/decade, y-axis is latitude. Summary Temperatures along the Andes have warmed (Fig. 1), but the warming has slowed down as compared to previous decades (Fig. 2). A cooling trend can be observed close to the sea level along the Pacific coast (Fig. 3), consistent with previous reports from Chile (Fig. 4). Interannual variability of surface air temperature is driven by natural modes of climate variability (Fig. 5), but these modes can only explain a small fraction of the observed warming (Fig. 6).