La Opala: To keep its growth story, buy for a target of Rs1475 - Firstcall India Equity
•
1 like•666 views


Recommended
Recommended
More Related Content
What's hot
What's hot (20)
Similar to La Opala: To keep its growth story, buy for a target of Rs1475 - Firstcall India Equity
Similar to La Opala: To keep its growth story, buy for a target of Rs1475 - Firstcall India Equity (20)
More from IndiaNotes.com
More from IndiaNotes.com (20)
La Opala: To keep its growth story, buy for a target of Rs1475 - Firstcall India Equity
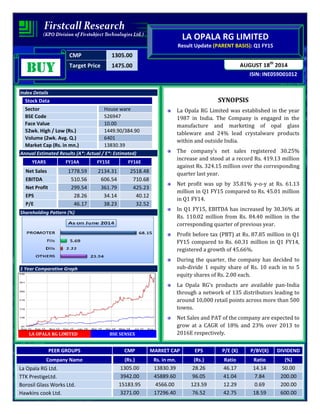
- 1. CMP 1305.00 Target Price 1475.00 LA OPALA RG LIMITED Result Update (PARENT BASIS): Q1 FY15 AUGUST 18th 2014 ISIN: INE059D01012 BBBBUUUUYYYY Index Details Stock Data Sector House ware BSE Code 526947 Face Value 10.00 52wk. High / Low (Rs.) 1449.90/384.90 Volume (2wk. Avg. Q.) 6401 Market Cap (Rs. in mn.) 13830.39 Annual Estimated Results (A*: Actual / E*: Estimated) YEARS FY14A FY15E FY16E Net Sales 1778.59 2134.31 2518.48 EBITDA 510.56 606.54 710.68 Net Profit 299.54 361.79 425.23 EPS 28.26 34.14 40.12 P/E 46.17 38.23 32.52 Shareholding Pattern (%) 1 Year Comparative Graph LA OPALA RG LIMITED B S E SENSEX SYNOPSIS La Opala RG Limited was established in the year 1987 in India. The Company is engaged in the manufacture and marketing of opal glass tableware and 24% lead crystalware products within and outside India. The company’s net sales registered 30.25% increase and stood at a record Rs. 419.13 million against Rs. 324.15 million over the corresponding quarter last year. Net profit was up by 35.81% y-o-y at Rs. 61.13 million in Q1 FY15 compared to Rs. 45.01 million in Q1 FY14. In Q1 FY15, EBITDA has increased by 30.36% at Rs. 110.02 million from Rs. 84.40 million in the corresponding quarter of previous year. Profit before tax (PBT) at Rs. 87.85 million in Q1 FY15 compared to Rs. 60.31 million in Q1 FY14, registered a growth of 45.66%. During the quarter, the company has decided to sub-divide 1 equity share of Rs. 10 each in to 5 equity shares of Rs. 2.00 each. La Opala RG’s products are available pan-India through a network of 135 distributors leading to around 10,000 retail points across more than 500 towns. Net Sales and PAT of the company are expected to grow at a CAGR of 18% and 23% over 2013 to 2016E respectively. PEER GROUPS CMP MARKET CAP EPS P/E (X) P/BV(X) DIVIDEND Company Name (Rs.) Rs. in mn. (Rs.) Ratio Ratio (%) La Opala RG Ltd. 1305.00 13830.39 28.26 46.17 14.14 50.00 TTK PrestigeLtd. 3942.00 45889.60 96.05 41.04 7.84 200.00 Borosil Glass Works Ltd. 15183.95 4566.00 123.59 12.29 0.69 200.00 Hawkins cook Ltd. 3271.00 17296.40 76.52 42.75 18.59 600.00
- 2. Recommendation & Analysis - ‘BUY’ La Opala Rg Limited, Total income has increased by 30.21% to Rs. 422.07 million for the quarter ended June 30, 2014 from Rs. 324.15 million for the quarter ended June 30, 2013. Net profit was up by 35.81% at Rs. 61.13 million in Q1 FY15 compared to Rs. 45.01 million in Q1 FY14. During the quarter ended Q1 FY15, EBITDA has increased by 30.36% y-o-y at Rs. 110.02 million from Rs. 84.40 million in the corresponding quarter of previous year. The over all good performance of the company has been possible due to higher utilization of capacity, aggressive marketing policy, introduction of new designs and improvement in product quality. With the recovery in the economy, in FY 2014-15, the Company plans to continue with the momentum it had achieved in the previous year. To achieve this objective, actions have already been initiated to explore untouched markets, strengthen the distribution network, improve logistics, introduce new product designs and upgrade the quality of the existing portfolio, keeping the pricing tag at an affordable level for the benefit of its customers. The company has a strong marketing Network of 135 Distributors and 10000 dealers across the country and the number is increasing at the rate of 15 per cent annually and also exports 10 per cent of opal ware to 20 countries. Barring unforeseen circumstances, the future of the Company appears to be encouraging. Over 2013-2016E, we expect the company to post a CAGR of 18% and 23% in its top-line and bottom-line respectively. Hence, we recommend ‘BUY’ for ‘LA OPALA RG LIMITED’ with a target price of Rs.1475.00 on the stock. QUARTERLY HIGHLIGHTS (PARENT BASIS) Results updates- Q1 FY15, La Opala RG’s products are available pan-India through a network of 135 distributors leading to around 10,000 retail points across more than 500 towns. Rs. In million JUNE-14 JUNE-13 % Change Net Sales 419.13 321.78 30.25 PAT 61.13 45.01 35.81 EPS 5.77 4.25 35.81 EBITDA 110.02 84.40 30.36 The company has achieved a turnover of Rs. 419.13 million for the 1st quarter of the current year 2014-15 as against Rs. 321.78 million in the corresponding quarter of the previous year. The company has reported an EBITDA of Rs. 110.02 million an increased by 30.36% y-o-y as against prior period of last year. In Q1 FY15, net profit jumps up by 35.81% y-o-y of Rs. 61.13 million against Rs. 45.01 million in the corresponding quarter of the previous year. The company has reported an EPS of Rs. 5.77 for the 1st quarter as against an EPS of Rs. 4.25 in the corresponding quarter of the previous year.
- 3. Break up of Expenditure: During the quarter, Total Expenditure rose by 30 per cent mainly on account of Advertisement & sales promotion by 79%, Depreciation by 32%, Employee benefits expenses by 29%, power and fuel 27% along with other expenditure 87% are the primary attribute for the growth of expenditure when compared to corresponding quarter of previous year. Total Expenditure in Q1 FY15 stood to Rs. 331.26 million as against Rs. 254.32 million in Q1 FY14. Break up of Expenditure (Value in Millions) Q1 FY15 Q1 FY14 Cost of Materials Consumed 82.07 78.16 Power & Fuel 59.43 46.66 Advertisement & Sales Promotion 38.02 21.24 Employee Benefit Expenses 59.04 45.73 Depreciation 19.21 14.57 Other Expenses 69.61 37.24 COMPANY PROFILE Opal Glass making, first perfected in France, was transplanted to India in 1988 by LaOpala, a grand, 70 years presence in the national glass industry. Since then, the company has made it its mission to bring the beauty of opal glass home to Indians and Laopala’s endeavor and commitment has created waves in the lifestyle market. The main object of the company is to manufacture glass and glassware products comprise plates, bowls, dinner sets, cup-saucer sets, coffee mugs, coffee cups, tea sets, soup sets, pudding and dessert sets; its crystalware products comprise barware, vases, bowls and stemware. The company’s headquartered in Kolkata with manufacturing facilities in Madhupur (Jharkhand) and Sitarganj (Uttarakhand).In 1999, Radha Glass and La Opala merged to become La Opala RG Limited. The Company consistently retained its position as one of the largest organised crockery players in India with an installed capacity 13,000 MT TPA as on 31 March 2014. The company with its endeavor to make its presence felt in the international market started exporting its products with the first consignment leaving the Indian port in 1993. Since then the company had registered a phenomenal growth in export and is currently exporting its brands to more than 40 countries which includes US, the UK, Singapore, South Korea, Australia, new Zealand and Spain as well as the Middle East, Africa, Latin America and the ASEAN region.
- 4. Awards The company has been listed, out of 19 Indian companies, in the Top 200 Asian companies in Forbes Asia's Best under a Billion (BUB) list, from a pool of 15,000 stock traded companies in Asia Pacific with revenues between $5 million and $1 billion. Brands • Laopala La Opala, the founders of opalware India have over the years brought together the export fusion of artistry and finesse. Products are not only microwaves safe and Chip resistant, but even white. Match the best across the globe. • Diva from Laopala Classique Collection The classique Collection, Comprises an elegant range of tableware that stands out for its striking milky white glaze and consumer-friendly properties. Its exquisitely chic international designs, make owning this collection, the ultimate reason of pride. Ivory Collection As timeless as tradition its elf, ivory has adorned the walls and plates of kings and nawabs alike. Its soft milky glaze, its smooth texture has been adored through the centuries. Diva brings you a collection as refi ned as ivory. The secret of the classiest dinner parties is now in your hand. Manish Malhotra It isn’t every day that a leading Indian fashion designer feels the urge to create dinnerware designs. Inspired by its designs, Manish Malhotra, designer par excellence, dedicated his designs to all that he is inspired by. Adding to Diva a one-of-a-kind, haute couture collection meant to be collectibles for connoisseurs of high taste and the uber-chic. • Solitaire Solitaire Crystal is handcrafted to protection as per global standards in aesthetic and design. Every cut and every sparkle redefines the spheres of clarity. Renowed Globally, it makes a prominent presence of India in the entire world market of Cruystals.
- 5. FINANCIAL HIGHLIGHT (PARENT BASIS) (A*- Actual, E* -Estimations Rs. In Millions) Balance Sheet as at March31, 2013 -2016E LA OPALA RG LIMITED. FY-13A FY-14A FY-15E FY-16E I EQUITY AND LIABILITIES A) Shareholder's Funds a) Share Capital 105.98 105.98 105.98 105.98 b) Reserves and Surplus 634.71 872.27 1142.67 1462.62 Sub-Total Net worth 740.69 978.25 1248.65 1568.60 B) Non Current Liabilities a) long term borrowing 149.87 0.00 0.00 0.00 b) Deferred Tax Liabilities 75.16 93.54 110.38 128.04 c) Other Long term Liabilities 11.86 13.34 14.67 15.85 d) Long term Provisions 0.90 2.55 3.85 5.01 Sub-Total Non Current Liabilities 237.79 109.43 128.90 148.89 C) Current Liabilities a) Short term borrowings 88.85 141.84 187.23 226.55 b) Trade payables 39.53 34.93 31.09 27.98 c) Other Current Liabilities 153.76 115.09 80.56 49.95 d) Short term Provisions 55.98 69.02 83.51 96.88 Sub-Total Current Liabilities 338.12 360.88 382.39 401.35 TOTAL EQUITY AND LIABILITIES (A + B + C) 1316.60 1448.56 1759.95 2118.84 II ASSETS D) Non-Current Assets: Fixed Assets i. Tangible assets 638.51 731.22 833.59 951.73 ii. Intangible assets 0.01 0.00 0.00 0.00 iii. Capital Work in Progress 8.80 22.02 36.33 51.59 a) Total Fixed Assets 647.32 753.24 869.92 1003.32 b) Non-current investments 0.88 0.88 0.88 0.88 c) Long Term loans and advances 56.48 51.38 58.57 66.18 Sub-Total Non-Current Assets 704.68 805.50 929.37 1070.38 E) Current Assets: a) Current Investment 74.38 0.00 65.70 95.77 b) Inventories 307.84 283.41 266.39 279.71 c) Trade receivables 185.98 214.76 251.27 292.23 d) Cash and Bank Balances 8.30 91.19 164.60 250.18 e) Short-terms loans advances 11.58 29.81 55.15 96.51 f) Other current assets 23.84 23.89 27.47 34.07 Sub-Total Current Assets 611.92 643.06 830.58 1048.47 TOTAL ASSETS (D + E) 1316.60 1448.56 1759.95 2118.84
- 6. Annual Profit Loss Statement for the period of 2013A to 2016E Value(Rs.in.mn) FY13A FY14A FY15E FY16E Description 12m 12m 12m 12m Net Sales 1539.16 1778.59 2134.31 2518.48 Other Income 10.25 10.82 13.20 15.58 Total Income 1549.41 1789.41 2147.51 2534.06 Expenditure -1127.28 -1278.85 -1540.97 -1823.38 Operating Profit 422.13 510.56 606.54 710.68 Interest -41.90 -32.82 -20.35 -23.40 Gross profit 380.23 477.74 586.19 687.28 Depreciation -55.58 -70.13 -86.96 -99.14 Profit Before Tax 324.65 407.61 499.23 588.14 Tax -95.86 -108.07 -137.44 -162.92 Net Profit 228.79 299.54 361.79 425.23 Equity capital 105.98 105.98 105.98 105.98 Reserves 634.72 872.27 1142.67 1462.62 Face value 10.00 10.00 10.00 10.00 EPS 21.59 28.26 34.14 40.12 Quarterly Profit Loss Statement for the period of 31 DEC, 2013 to 30 SEP, 2014E Value(Rs.in.mn) 31-Dec-13 31-Mar-14 30-Jun-14 30-Sep-14E Description 3m 3m 3m 3m Net sales 569.85 488.60 419.13 502.96 Other income 4.64 2.22 2.94 2.12 Total Income 574.49 490.82 422.07 505.07 Expenditure -402.70 -350.55 -312.05 -366.91 Operating profit 171.79 140.27 110.02 138.17 Interest -8.20 -4.06 -2.96 -3.40 Gross profit 163.59 136.21 107.06 134.76 Depreciation -19.07 -18.98 -19.21 -22.28 Profit Before Tax 144.52 117.23 87.85 112.48 Tax -34.18 -31.96 -26.72 -34.53 Net Profit 110.34 85.27 61.13 77.95 Equity capital 105.98 105.98 105.98 105.98 Face value 10.00 10.00 10.00 10.00 EPS 10.41 8.05 5.77 7.35
- 7. Ratio Analysis Particulars FY13A FY14A FY15E FY16E EPS (Rs.) 21.59 28.26 34.14 40.12 EBITDA Margin (%) 27.43 28.71 28.42 28.22 PBT Margin (%) 21.09 22.92 23.39 23.35 PAT Margin (%) 14.86 16.84 16.95 16.88 P/E Ratio (x) 60.45 46.17 38.23 32.52 ROE (%) 30.89 30.62 28.97 27.11 ROCE (%) 48.77 51.84 48.30 45.11 Debt Equity Ratio 0.32 0.14 0.15 0.14 EV/EBITDA (x) 33.13 27.19 22.73 19.29 Book Value (Rs.) 69.89 92.31 117.82 148.01 P/BV 18.67 14.14 11.08 8.82 Charts
- 8. OUTLOOK AND CONCLUSION At the current market price of Rs. 1305.00, the stock P/E ratio is at 38.23 x FY15E and 32.52 x FY16E respectively. Earning per share (EPS) of the company for the earnings for FY15E and FY16E is seen at Rs.34.12 and Rs.40.12 respectively. Net Sales and PAT of the company are expected to grow at a CAGR of 18% and 23% over 2013 to 2016E respectively. On the basis of EV/EBITDA, the stock trades at 22.73 x for FY15E and 19.29 x for FY16E. Price to Book Value of the stock is expected to be at 11.08 x and 8.82 x respectively for FY15E and FY16E. We expect that the company surplus scenario is likely to continue for the next three years, will keep its growth story in the coming quarters also. We recommend ‘BUY’ in this particular scrip with a target price of Rs.1475.00 for Medium to Long term investment. Industry Overview In 2013, global growth remained largely unchanged. As per IMF estimates (January 2014), global GDP growth was estimated at 3% in 2013 vis-à-vis 3.1% in 2012. The year under review was marked by a variance in growth and financial market conditions. The Indian economy slackened in 2012-13 but buoyed by good performance from the farming sector, economic growth in the current fiscal is estimated to rise to 4.9 percent as compared to the growth rate of 4.5 percent in 2012-13. The recovery in growth, although weak, was on the back of abundant rainfall which not only boosted agricultural output but also the overall expansion. nonetheless this growth rate remains below potential as the manufacturing and the mining sectors continue to remain a cause of concern in the ongoing fiscal. Supported by slightly stronger global growth, improving export competitiveness and implementation of recently approved investment projects, India’s growth is expected to get better over the medium-term. Over the last decade, there was a significant growth in rural incomes – an average annual median per capita income increase of 7.2% – inspiring a shift in lifestyles from traditional bone china crockery to modern alternatives. This is expected to plug the extensive crockeryware under-penetration (24%) within India’s total dinner set market. Risks and concerns The principal risks in the sector comprise increased competition, cheaper imports, volatile fuel costs and change in government policies affecting the sector, brand weakness and stiff competition from the unorganised sector.
- 9. Outlook • India is possibly the largest relatively under-explored tableware market in the world. • The product category targets individuals with aspirational lifestyles who are increasingly receptive to branding. • There is a visible transition from conventional crockery to modern equivalents on the one hand and the use of unbranded to branded products on the other. • The use of opal glassware products has gone a transition - from special occasions in the past to everyday use today. • The opal glassware product is considered more durable compared to its bone china equivalent. • The opal glassware product is completely hygienic and vegan, an advantage over its bone china competition that contains animal matter. • There has been a steady growth in urbanisation and nuclear families, catalysing tableware consumption. • The entry of international brands is helping widen the opal glassware market and enhance category visibility. Disclaimer: This document prepared by our research analysts does not constitute an offer or solicitation for the purchase or sale of any financial instrument or as an official confirmation of any transaction. The information contained herein is from publicly available data or other sources believed to be reliable but do not represent that it is accurate or complete and it should not be relied on as such. Firstcall India Equity Advisors Pvt. Ltd. or any of it’s affiliates shall not be in any way responsible for any loss or damage that may arise to any person from any inadvertent error in the information contained in this report. This document is provide for assistance only and is not intended to be and must not alone be taken as the basis for an investment decision.
- 10. Firstcall India Equity Research: Email – info@firstcallindia.com C.V.S.L.Kameswari Pharma U. Janaki Rao Capital Goods B. Anil Kumar Auto, IT FMCG M. Vinayak Rao Diversified C. Bhagya Lakshmi Diversified D.Vasanthi Diversified Firstcall India also provides Firstcall India Equity Advisors Pvt.Ltd focuses on, IPO’s, QIP’s, F.P.O’s,Takeover Offers, Offer for Sale and Buy Back Offerings. Corporate Finance Offerings include Foreign Currency Loan Syndications, Placement of Equity / Debt with multilateral organizations, Short Term Funds Management Debt Equity, Working Capital Limits, Equity Debt Syndications and Structured Deals. Corporate Advisory Offerings include Mergers Acquisitions(domestic and cross-border), divestitures, spin-offs, valuation of business, corporate restructuring-Capital and Debt, Turnkey Corporate Revival – Planning Execution, Project Financing, Venture capital, Private Equity and Financial Joint Ventures Firstcall India also provides Financial Advisory services with respect to raising of capital through FCCBs, GDRs, ADRs and listing of the same on International Stock Exchanges namely AIMs, Luxembourg, Singapore Stock Exchanges and other international stock exchanges. For Further Details Contact: 3rd Floor,Sankalp,The Bureau,Dr.R.C.Marg,Chembur,Mumbai 400 071 Tel. : 022-2527 2510/2527 6077/25276089 Telefax : 022-25276089 E-mail: info@firstcallindiaequity.com www.firstcallindiaequity.com