Downloaded 80 times


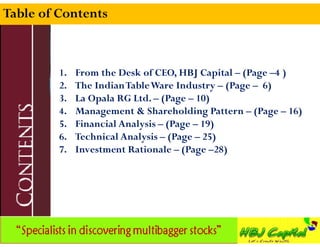
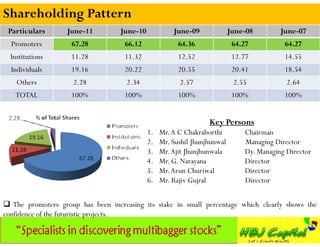
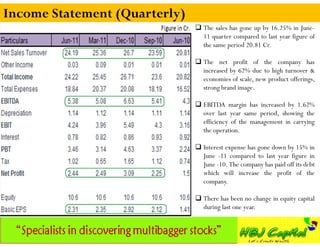
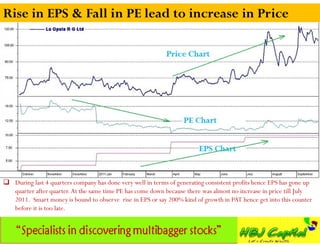
![Systematic buying between INR 80 to 100
2 Phase Buying Strategies Suggested [Always buy in SIP ways]
1st Phase: Buy at the current price range Rs 100-110 [50% of investment]
2nd Phase: Add if the price falls down to Rs75-80 [50% of investment]
>>>Expect at least 4-6 times returns in next 2-3 years time frame!!!](https://image.slidesharecdn.com/laopalargltdcode526947-hbjcapitalsbusinessinsightsforsept11-121203025114-phpapp01/85/La-Opala-RG-Ltd-Code-526947-Multibagger-Stock-Pick-2-320.jpg)

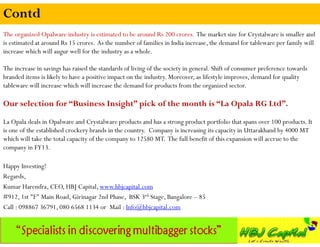


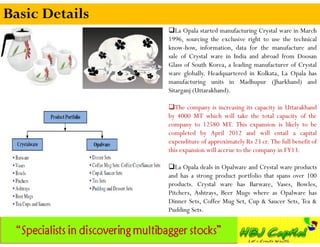
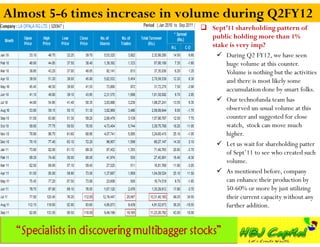
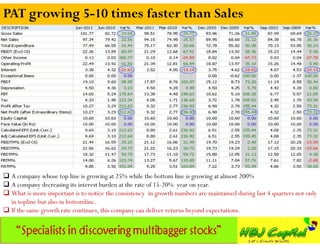
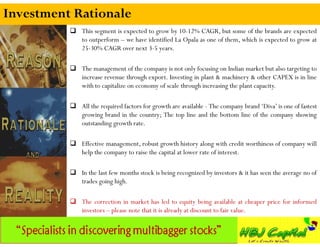
![Snapshot
Trading volume = 43000 shares (approx) per day – The
stock usually trades with low volumes, only during last 2-3
months volume has increased drastically.
EPS ~ 9.69 (TTM) – Company has recorded an EPS of Rs
9.69 during last 12 months.
PE ~ 11.35 - On the basis of TTM earnings. The stock is
available at very moderate PE multiples, whereas, its margins,
ratios, market share, and balance sheet has grown
significantly over last couple of years. It should therefore be
re-rated and trade at higher PE multiples.
CMP = 110.85 Rs (Sep 29th 2011) Shareholdings : No of shares [% Share Holding]
Total Institution: 11.9 Lakhs [11.28%]
Total Individuals Holding: 18.71 Lakhs [19.16%]
52 week’s high/low = Rs 135.8/55.05 – The stock Total Promoters: 71.3 Lakhs [67.28%]
after making a 52 week high in Sep’11 has Total Others : 2.03 Lakhs [2.28 %]
corrected by 18% during the ongoing market
correction. Debt/Equity Ratio = 1.13 [Mar’11]
Current Ratio = 1.33 [Mar’11]
6 Month peak share price = Rs 135.8 –The stock Interest Coverage Ratio = 2.11 times [Mar’11]
scaled a new 6 month high in September 11. The ROCE = 10.83 % [Mar’11]
stock deserves as re-rating both owing to the RONW = 7.49 % [Mar’11]
growth rate and historical valuations. BSE Code: 526947](https://image.slidesharecdn.com/laopalargltdcode526947-hbjcapitalsbusinessinsightsforsept11-121203025114-phpapp01/85/La-Opala-RG-Ltd-Code-526947-Multibagger-Stock-Pick-11-320.jpg)
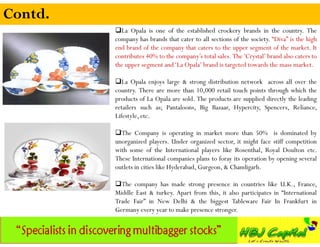
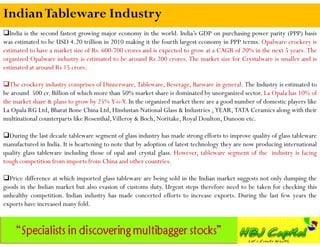
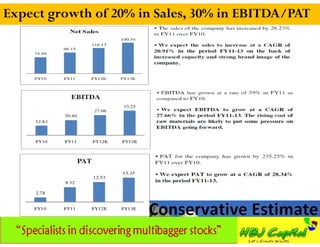
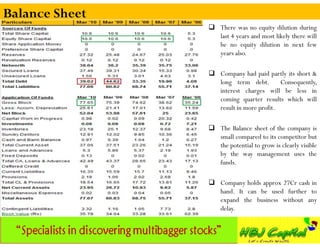
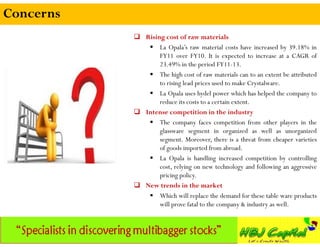
![Capacity utilization can be improved by 50-60%
During 2007 [Plant capacity 4580 MT] – Company has spend Rs 7.73Cr for buying 4952 Metric tons of Chemical
(main raw material).
During 2010 [Plant capacity 8580 MT] – Company has spend Rs 9.03Cr for buying 5543 Metric tons of Chemical
(main raw material).
Conclusion:We have not see much increase in the raw material cost from 2007 to 2010, during the same period we
have seen 87% increase in capacity from 4580 to 8580 MT but there was just 10% increase in the raw material quantity &
just 25% increase in finished product, which clearly shown that they are using better technology or able to reduce the
wastage but they are under utilized at present and there is huge scope of increasing production. Expected capacity during
2012 will be 12580 MT. Think about the increase in product if these capacities can be utilized well.](https://image.slidesharecdn.com/laopalargltdcode526947-hbjcapitalsbusinessinsightsforsept11-121203025114-phpapp01/85/La-Opala-RG-Ltd-Code-526947-Multibagger-Stock-Pick-14-320.jpg)


La Opala RG Ltd, a prominent player in the Indian tableware industry, was founded in 1988 and has over 70 years of experience. The company, which specializes in opalware and crystalware, is expanding its production capacity and aims for substantial growth, targeting a CAGR of 20% in the next five years. With a robust market presence and strong demand attributed to a growing middle class and lifestyle changes, La Opala is positioned for continued success in the competitive tableware sector.


![CARE IPO [Subscribe to this issue] - HBJ Capital](https://cdn.slidesharecdn.com/ss_thumbnails/careiposubscribetotheissue-hbjcapital-121209145812-phpapp02-thumbnail.jpg?width=640&height=640&fit=bounds)


