ONGC Q2FY15 results and outlook
•
1 like•242 views

Using P/E basis, at the CMP the stock quotes at a FY16 P/E of 10.3. We think investors could buy the stock on dips to Rs.365 – Rs.384 band (~9.5-10.00x FY16E EPS and ~5.25-5.5xFY16 EV/EBITDA) for target of Rs.422 (~11.0x FY16E EPS and ~6x FY16 EV/EBITDA) over the next 1 quarter.

Recommended
Recommended
More Related Content
What's hot
What's hot (20)
Viewers also liked
Viewers also liked (12)
Similar to ONGC Q2FY15 results and outlook
Similar to ONGC Q2FY15 results and outlook (20)
More from IndiaNotes.com
More from IndiaNotes.com (20)
Recently uploaded
Recently uploaded (20)
ONGC Q2FY15 results and outlook
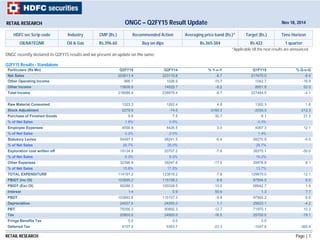
- 1. RETAIL RESEARCH Nov ONGC – Q2FY15 Result Update 18, 2014 HDFC sec Scrip code Industry CMP (Rs.) Recommended Action Averaging price band (Rs.)* Target (Rs.) Time Horizon OILNATEQNR Oil & Gas Rs.396.60 Buy on dips Rs.365-384 Rs.422 1 quarter *Applicable till the next results are announced ONGC recently declared its Q2FY15 results and we present an update on the same: Q2FY15 Results - Standalone Particulars (Rs Mn) Q2FY15 Q2FY14 % Y-o-Y Q1FY15 % Q-o-Q Net Sales 203611.4 223119.8 -8.7 217470.0 -6.4 Other Operating Income 866.1 1026.9 -15.7 1042.7 -16.9 Other Income 13608.9 14829.7 -8.2 8951.8 52.0 Total Income 218086.4 238976.4 -8.7 227464.5 -4.1 Raw Material Consumed 1323.3 1262.4 4.8 1302.3 1.6 Stock Adjustment 2279.9 -74.5 -3160.3 -2030.5 -212.3 Purchase of Finished Goods 9.8 7.5 30.7 8.1 21.0 % of Net Sales 1.8% 0.5% -0.3% Employee Expenses 4558.9 4426.5 3.0 4067.3 12.1 % of Net Sales 2.2% 2.0% 1.9% Statutory Levies 54497.5 58241.5 -6.4 58270.9 -6.5 % of Net Sales 26.7% 26.0% 26.7% Exploration cost written off 19124.9 20707.2 -7.6 38275.1 -50.0 % of Net Sales 8.3% 8.2% 16.2% Other Expenses 32396.9 39247.6 -17.5 29976.8 8.1 % of Net Sales 15.8% 17.5% 13.7% TOTAL EXPENDITURE 114191.2 123818.2 -7.8 129870.0 -12.1 PBIDT (Inc OI) 103895.2 115158.2 -9.8 97594.5 6.5 PBIDT (Exc OI) 90286.3 100328.5 -10.0 88642.7 1.9 Interest 1.4 0.9 55.6 1.3 7.7 PBDT 103893.8 115157.3 -9.8 97593.2 6.5 Depreciation 24537.5 24265.0 1.1 25623.1 -4.2 PBT 79356.3 90892.3 -12.7 71970.1 10.3 Tax 20800.0 24900.0 -16.5 25700.0 -19.1 Fringe Benefits Tax 0.0 0.0 0.0 Deferred Tax 4107.4 5353.7 -23.3 -1547.8 -365.4 RETAIL RESEARCH Page | 1
- 2. Earlier Yrs written off 0.0 0.0 0.0 Reported Profit After Tax 54448.9 60638.6 -10.2 47817.9 13.9 OPM (%) 44.2% 44.8% 40.6% NPM (%) 26.7% 27.2% 22.0% Production Details Crude Oil (MMT) ONGC 5.56 5.57 -0.13 5.51 0.98 JV 0.87 0.92 -5.65 0.95 -8.15 Total 6.43 6.49 -0.91 6.45 -0.36 Gas (BCM) ONGC 5.33 5.82 -8.42 5.65 -5.77 JV 0.35 0.40 -11.65 0.38 -8.88 Total 5.68 6.21 -8.63 6.04 -5.96 (Source: Company Reports, HDFC Sec Research) Particulars (Rs Mn) Q2FY15 Q2FY14 % Y-o-Y Q1FY15 % Q-o-Q Segment Revenues: Offshore 149558.5 160496.7 -6.8 151937.8 -1.6 % of total 72.9% 71.4% 69.3% Onshore 55565.3 64373.3 -13.7 67235.7 -17.4 % of total 27.1% 28.6% 30.7% Total 205123.8 224870.0 -8.8 219173.5 -6.4 Segment Results: Offshore 67777.7 73604.5 -7.9 51936.6 30.5 EBIT % 45.3% 45.9% 34.2% Onshore 3063.5 10413.2 -70.6 16361.8 -81.3 EBIT % 5.5% 16.2% 24.3% Total 70841.2 84017.7 -15.7 68298.4 3.7 EBIT % 34.5% 37.4% 31.2% Less: Interest 1.4 0.9 55.6 1.3 7.7 Less: Unallocated Expense -8516.5 -6875.5 23.9 -3673.0 131.9 RETAIL RESEARCH Page | 2
- 3. PBT 79356.3 90892.3 -12.7 71970.1 10.3 Capital Employed Offshore 660239.1 600221.7 10.0 619854.7 6.5 Onshore 393572.2 309441.3 27.2 383181.6 2.7 Total 1053811.3 909663.0 15.8 1003036.3 5.1 Unallocable 414671.8 432523.3 -4.1 411000.1 0.9 Total 1468483.1 1342186.3 9.4 1414036.4 3.9 (Source: Company Reports, HDFC Sec Research) Q2FY15 Standalone results review The net revenue for Q2FY15 at Rs.203.61 bn fell 8.7% YoY and 6.4% QoQ owing to lower net realizations of crude oil and lower gas production. As per the government notification for Q2FY15 subsidy sharing pattern, the total upstream contribution was at Rs164 bn. For Q2FY15 upstream contribution to total under recoveries was at 73%. During Q2FY15, ONGC’s contribution to the upstream subsidy share was at 83.3% as compared to 82.5% in Q2FY14. Net realizations on sales volumes of crude oil from nominated blocks fell to US$41.35/bbl as compared to US$44.84/bbl in Q2 FY14. ONGC’s subsidy payout stood at Rs.136b (v/s Rs.138b in 2QFY14 and Rs.132b in 1QFY15). The subsidy continued to be ad-hoc at $60.8 per barrel vs $64.2 in Q2FY14. Discount on crude oil fell 5.3% yoy and 2.5% qoq to US$60.8/bbl. Natural gas realization was at Rs.9,547/tscm v/s Rs9,404/tscm in Q2FY14. Oil production (excl. JV) stood at 5.56mmt (flat YoY, +1% QoQ); sales (excl. JV) were at 4.9mmt (+7% YoY and +4.5% QoQ). Gas production (excl. JV) stood at 5.3bcm (-8% YoY, -5.8% QoQ); sales (excl. JV) were at 4.1bcm (-10% YoY, -7% QoQ). JV oil production was 0.87mmt (-5.7% YoY, -8% QoQ), while JV gas production was 0.34bcm (-13% YoY, -11% QoQ). QoQ and YoY gas production decline was led by PMT fields. (Source: Company Reports, HDFC Sec Research) RETAIL RESEARCH Page | 3
- 4. Gas segment revenues fell 8.9% yoy and 6.5% qoq mainly on the back of fall in production and sales volumes. Revenues for the VAP segment saw muted growth of 0.9% yoy and 1.6% qoq. On yoy basis, 26.4% fall in C2‐C3 revenues was offset by 29.4% increase in LPG revenues. (Source: Company Reports, HDFC Sec Research) ONGC reported EBITDA of Rs 90.3bn (-10% YoY, +1.9% QoQ) led by lower net crude oil realisation (-7.7% YoY) leading to a fall of 60bps yoy in OPM to 44.2%. Impact of higher oil volumes were negated by decline in gas volumes. PAT fell to Rs 54.5bn (-10% YoY) on the back of a historic slump in crude oil prices that impacted sales apart from sharing of under-recoveries of downstream firms and lower sales. (Source: Company Reports, HDFC Sec Research) ONGC’s D,D&A + exploration expenses costs fell 4.2% QoQ at Rs.43.66bn versus Rs. 63.89bn in Q1FY15 owing to lower dry wells write-off of Rs.19.1bn during the quarter. Historically it has been observed that the D,D&A charges are normally higher during second half of the year as ONGC typically charges the well RETAIL RESEARCH Page | 4
- 5. write-offs at the end of the year when it reviews its exploration performance. Statutory levies as a percentage of sales, particularly cess which is priced in absolute terms was higher by 67bps as a percentage of net sales. Other income was lower by 8.2% yoy owing to fall in income from short term deposits. Fall in crude prices and diesel de-control has led to reduction in total oil under recovery to Rs 511bn (- 16% YoY) in 1HFY15. However, ONGC’s contribution has increased to Rs. 268bn (+2%). In the conference call management said that production from new projects (such as G1, GS-14, B-193, Cluster 7 etc.) is ramping up and hence FY15 production guidance of 23.5 MMT crude and 24.0 bcm gas should be met. ONGC maintained its target of crude production (standalone) of 23.5 MMT and gas production (standalone) of 24 bcm in FY15, implying YoY increase of 6%/3% respectively. In the earnings call, management stated that despite H1 production (particularly gas) coming in lower than the implied annualized targets, ramp-up of production from new projects should help achieve targets. However, management revised OVL production target to 8.47/8.29 MMTOE for FY15/16E owing to lack of clarity on Sudan/Syria production restart due to ongoing geo-political reasons. Govt. announced new gas price of USD5.6/mmbtu (v/s USD4.2/mmbtu earlier) is effective from November 1, 2014 and will add to ONGC’s earnings. ONGC has a contingent liability of Rs.129.6bn for the differential between royalty on post-discount and pre-discount crude price in Gujarat for Apr’08 to Sep’14 (pending the SC court case). ONGC is currently paying higher royalty to Gujarat (wef Feb’14) but not charging the higher royalty to its P&L, and has accounted the differential of Rs.14.9bn (for Feb-Sep’14) as a deposit. In the call, management mentioned that as of now ONGC has not received claims for higher royalty/VAT from any other state. With regards to the KG Deepwater block the company apprised that the FDP is under progress and will be submitted to the company by the third party by March 2015. Also the DGH has cleared the DoC. The field is expected to commence production in FY19 and scale up to peak levels in FY21 wherein oil production would be at 90,000bbl/day and gas production would be at 22mmscmd. The D1 block is currently producing 31,000bbl/day and is expected to reach 40,000bbl/day by March 2015. For FY16, the company expects 45,000bbl/day. The increase in production will come from 1) increase at D1, 2) Daman development project (gas), 3) Redevelopment of Mumbai High North (approved), 4) Redevelopment of Mumbai High South, which is in pipeline. For FY15, the company has lined up a capital expenditure plan of Rs.360bn. For OVL the company has lined up US$1.6‐2bn. The company’s board also approved a Rs.10,600-crore investment plan for its western offshore fields. The company will spend Rs.6,069 crore for redevelopment of the Mumbai High (South) and expects to increase production by 7.547 million tonnes of crude oil and 3.864 billion cubic metres of gas by 2030. It will also spend Rs.4,620 crore for integrated development of its fields Mukta, Bassein and Panna near the Mumbai coast. The incremental production is expected to start in 2014-15 with peak incremental production rate of 10 mscmd of gas and 950 barrels of oil and around 1100 cubic metres of condensate per day expected to be achieved by 2017-18. The cumulative production till 2027-28 is pegged at 19.56 billion cubic metres of gas, 1.97 million cubic metres of condensate and 1.83 million tonnes of crude oil. Conclusion Set up in 1956, ONGC is India’s largest national oil & gas company, primarily engaged in the exploration, development and production of crude oil and natural gas in both India and abroad. ONGC, through its wholly owned subsidiary ONGC Videsh Ltd, has presence across 14 countries in E&P activities. The company is also present in downstream refining and marketing operations in India through its subsidiary MRPL, which operates a refinery with an installed capacity of 15 MMTPA. Global crude oil price benchmark Brent has slumped to less than $80 a barrel, a four year low on forecasts of depressed demand amid oversupply. Despite a fall in crude oil prices, ONGC’s subsidy burden did not go down sharply. As a public sector oil and gas explorer, ONGC shares a part of the subsidy given to PSU oil marketing companies for selling PDS kerosene and domestic LPG at lower rates. PSU oil and gas exploration and production firms share the subsidy by selling crude oil at a discount. RETAIL RESEARCH Page | 5
- 6. Recently, government approved the Rangarajan committee recommendations on gas price hike. Based on the recommendations, gas price is linked to international gas prices (US – Henry Hub price, UK – National Balancing Point price and Japan LNG Import price) and LNG import price for Petronet LNG term contract. As ONGC is the largest producer, the gas price hike will directly benefit ONGC. Clarity on subsidy sharing mechanism (policy is under discussion) and stable policy regime will lead to increase in valuation multiples. Increase in production and fall in under recovery sharing will be the key triggers for ONGC. If recent weakness in crude price sustains there is a significant downside risk. A transparent subsidy sharing mechanism announced in advance could be helpful. Oil Ministry has suggested a more benign framework that implies an effective 30-35% upstream share. The impending US$2.8bn divestment may weigh on the stock price in the near term. However this raises hope for a quick and sensible decision on subsidy sharing. The country's biggest oil and gas explorer has struggled to lift production from its ageing domestic fields and is aggressively investing overseas to secure energy assets for Asia's third-largest economy. A high burden from subsidised sales of crude to state refiners to keep retail prices in check has squeezed ONGC's margins even as it spends heavily to boost overseas assets and maintain output at its domestic fields. The company's cost of helping subsidise fuel fell slightly to Rs 13,641 crore from Rs 13,796 crore in the same quarter last year. The company, in which the Indian government plans to sell a 5 per cent stake worth close to $3 billion, is expected to benefit from government reforms to free diesel prices and raise natural gas prices. Key risks include higher than expected under recovery share, lower than expected production growth, any subsidy sharing formula for subsidy towards fertilizer companies etc. can be a negative, continued weakness in crude oil prices, and high onshore crude royalty. We are maintaining our estimates for FY15 & FY16 (though top-line could be underachieved). We had issued a Q1FY15 results review note on ONGC dated 20th Aug 2014 and had stated that investors could buy the stock at CMP (Rs.424.0) and add on dips to Rs.384-394 band for a target of Rs.461 over the next quarter. Since then, the stock has hit a low of Rs. 388.65 on 28th Oct 2014 and touched a high of Rs. 457.95 on 09th Sep 2014. Using P/E basis, at the CMP the stock quotes at a FY16 P/E of 10.3. We think investors could buy the stock on dips to Rs.365 – Rs.384 band (~9.5-10.00x FY16E EPS and ~5.25-5.5xFY16 EV/EBITDA) for target of Rs.422 (~11.0x FY16E EPS and ~6x FY16 EV/EBITDA) over the next 1 quarter. Quick Estimates – (Consolidated) Particulars FY11 FY12 FY13 FY14A FY15OE FY16OE Net Sales 1,175,206 1,463,509 1,614,491.5 1732344.9 1,996,700 2,116,930 % Change 15.5% 24.5% 13.6% 7.3% 15.3% 6.0% EBITDA 423,670 532,630.1 493,276.7 497187.0 628,960 681,651 OPM 36.1% 36.4% 30.6% 28.7% 31.5% 32.2% PAT 224,559 281,436 242,196.4 265065.3 311,485 328,124 NPM 19.1% 19.2% 15.0% 15.3% 15.6% 15.5% EPS 26.2 32.9 28.0 31.0 36.4 38.4 E: Estimates (All values in Rs. Mn except per share data) RETAIL RESEARCH Page | 6
- 7. Analyst: Sheetal Poonawala; Email ID: sheetal.poonawala@hdfcsec.com RETAIL RESEARCH Tel: (022) 3075 3400 Fax: (022) 2496 5066 Corporate Office HDFC securities Limited, I Think Techno Campus, Building - B, "Alpha", Office Floor 8, Near Kanjurmarg Station, Opp. Crompton Greaves, Kanjurmarg (East), Mumbai 400 042 Phone: (022) 3075 3400 Fax: (022) 2496 5066 Website: www.hdfcsec.com Email: hdfcsecretailresearch@hdfcsec.com Disclaimer: This document has been prepared by HDFC Securities Limited and is meant for sole use by the recipient and not for circulation. This document is not to be reported or copied or made available to others. It should not be considered to be taken as an offer to sell or a solicitation to buy any security. The information contained herein is from sources believed reliable. We do not represent that it is accurate or complete and it should not be relied upon as such. We may have from time to time positions or options on, and buy and sell securities referred to herein. We may from time to time solicit from, or perform investment banking, or other services for, any company mentioned in this document. This report is intended for non-Institutional Clients This report has been prepared by the Retail Research team of HDFC Securities Ltd. The views, opinions, estimates, ratings, target price, entry prices and/or other parameters mentioned in this document may or may not match or may be contrary with those of the other Research teams (Institutional, PCG) of HDFC Securities Ltd. RETAIL RESEARCH Page | 7