
Recommended
Recommended
More Related Content
What's hot
What's hot (20)
Similar to D04472327
Similar to D04472327 (20)
More from IOSR-JEN
Recently uploaded
Recently uploaded (20)
D04472327
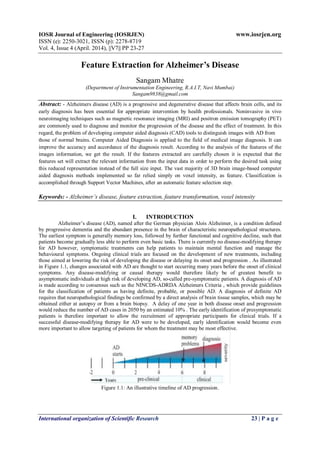
- 1. IOSR Journal of Engineering (IOSRJEN) www.iosrjen.org ISSN (e): 2250-3021, ISSN (p): 2278-8719 Vol. 4, Issue 4 (April. 2014), ||V7|| PP 23-27 International organization of Scientific Research 23 | P a g e Feature Extraction for Alzheimer’s Disease Sangam Mhatre (Department of Instrumentation Engineering, R.A.I.T, Navi Mumbai) Sangam9838@gmail.com Abstract: - Alzheimers disease (AD) is a progressive and degenerative disease that affects brain cells, and its early diagnosis has been essential for appropriate intervention by health professionals. Noninvasive in vivo neuroimaging techniques such as magnetic resonance imaging (MRI) and positron emission tomography (PET) are commonly used to diagnose and monitor the progression of the disease and the effect of treatment. In this regard, the problem of developing computer aided diagnosis (CAD) tools to distinguish images with AD from those of normal brains. Computer Aided Diagnosis is applied to the field of medical image diagnosis. It can improve the accuracy and accordance of the diagnosis result. According to the analysis of the features of the images information, we get the result. If the features extracted are carefully chosen it is expected that the features set will extract the relevant information from the input data in order to perform the desired task using this reduced representation instead of the full size input. The vast majority of 3D brain image-based computer aided diagnosis methods implemented so far relied simply on voxel intensity, as feature. Classification is accomplished through Support Vector Machines, after an automatic feature selection step. Keywords: - Alzheimer’s disease, feature extraction, feature transformation, voxel intensity I. INTRODUCTION Alzheimer’s disease (AD), named after the German physician Alois Alzheimer, is a condition defined by progressive dementia and the abundant presence in the brain of characteristic neuropathological structures. The earliest symptom is generally memory loss, followed by further functional and cognitive decline, such that patients become gradually less able to perform even basic tasks. There is currently no disease-modifying therapy for AD however, symptomatic treatments can help patients to maintain mental function and manage the behavioural symptoms. Ongoing clinical trials are focused on the development of new treatments, including those aimed at lowering the risk of developing the disease or delaying its onset and progression . As illustrated in Figure 1.1, changes associated with AD are thought to start occurring many years before the onset of clinical symptoms. Any disease-modifying or causal therapy would therefore likely be of greatest benefit to asymptomatic individuals at high risk of developing AD, so-called pre-symptomatic patients. A diagnosis of AD is made according to consensus such as the NINCDS-ADRDA Alzheimers Criteria , which provide guidelines for the classification of patients as having definite, probable, or possible AD. A diagnosis of definite AD requires that neuropathological findings be confirmed by a direct analysis of brain tissue samples, which may be obtained either at autopsy or from a brain biopsy. A delay of one year in both disease onset and progression would reduce the number of AD cases in 2050 by an estimated 10% . The early identification of presymptomatic patients is therefore important to allow the recruitment of appropriate participants for clinical trials. If a successful disease-modifying therapy for AD were to be developed, early identification would become even more important to allow targeting of patients for whom the treatment may be most effective. Figure 1.1: An illustrative timeline of AD progression.
- 2. Feature Extraction for Alzheimer’s Disease International organization of Scientific Research 24 | P a g e II. FEATURE SELECTION AND DIMENSIONALITY REDUCTION Dimensionality reduction is one additional component common to most CAD systems both for the ones that use the whole brain and for those that use ROIs. The grounds for this step are linked, once again, to the high dimensionality, low sample size problem. To get a rough idea of the gap between the number of features and the sample size, in the whole brain based systems, the number of voxels easily exceeded tens or even hundreds of thousands, and in the ROIs based systems, this number, despite being smaller, reached a few hundreds in the simplest setting found in the literature. On the other hand, the cardinality of datasets available for study was usually smaller than 200. Distinct approaches have been tested regarding this problem, including methods that study linear combinations of the original variables like Principal Component Analysis (PCA), Linear Discriminant Analysis (LDA) or Nonnegative Matrix Factorization (NMF), and feature selection procedures, more specifically ranking algorithms that assign one measure of relevance to each feature to select the most important ones. From the measures of relevance found in the literature, one can highlight the mutual information , correlation coefficients, the Fisher Discriminant Ratio (FDR) and the absolute value of the two-sample t-test statistic. III. FEATURE EXTRACTION AND FEATURE TRANSFORMATON The main objective of the current paper is to build and study a system for the computer-aided diagnosis of Alzheimer’s disease, using three-dimensional images produced by the FDG-PET neuroimaging technique. For the purpose of feature extraction different approaches were studied. The first uses voxels intensities (VI) which are the features obtained directly from the FDG-PET scan with no further processing and the scale-space of the FDG-PET images was also considered. Voxel Intensity Voxel intensity features are obtained directly from the PET scan and its value V (x, y, z) is a direct measure of the FDG uptake detected in a certain voxel. The image database used in the present work, which was retrieved from the Alzheimer’s Disease Neuroimaging Initiative (ADNI) database, had already undergone a preprocessing stage, resulting in a co-registered and normalized set of images with identical dimensions, specifically, 128 by 128 by 60. The domain of V (x, y, z), denoted by B, can be stated as follows: (3.1) Only one more preprocessing step was carried out on the original images before the feature selection phase. Its aim was to ignore all voxels that lie outside the brain, reducing substantially the dimensionality of the input patterns. To build a binary mask M(x, y, z), where every position inside the brain is set to true or otherwise set to false. First, an average brain was calculated using the whole VI database and then, the subsequent volume was thresholded at 5% of the maximum value. The threshold was determined empirically so that the brain mask would adapt correctly to the brain. The output of this preprocessing step is illustrated in Figure 3.1. Figure 3.1: Binary mask of the brain. On the left, one example of an axial cut of an arbitrary patient. On the right, the same example but with all voxels outside the brain removed. Although the procedure just described could be seen as a feature selection routine, it was presented here because it is constructed based on the VI features and should be used as a preprocessing step, not as the only feature selection operation.
- 3. Feature Extraction for Alzheimer’s Disease International organization of Scientific Research 25 | P a g e Scale-Space Expansion A common characteristic of images is that neighboring pixels are highly correlated and this remains true for the VI features presented in the previous section. As a consequence, a great deal of information present in the original volume is redundant, which can reduce the system’s performance due to the curse of dimensionality. In order to overcome this probable source of performance degradation, a Gaussian pyramid representation of the scale-space of the brain volumes was studied. This pyramid provides representations of an image, in this case of a volume, at different scales and resolutions. A low-pass pyramid is generated by the repetition of two steps. The first one smooths the volume with an appropriate filter, followed by a subsampling step usually by a factor of two in each direction. More formally, the pyramid is recursively defined as follows: (3.2) where Vl represents the level l of the pyramid and w(m, n, o) is a weighting function, also known as “generating kernel”. In this definition of the scale-space, it should be noted that both steps are merged in equation (3.2), the width of the generating kernel was set to five (m, n and o range from -2 up to 2) and the subsampling factor was set to two. A more general definition was not used in order to ease the presentation. On the other hand, the domain of each layer, denoted by B0, B1, B2 and so on, can be defined as follows: (3.3) where l = 1, 2, . . ., the notation stands for the ceiling of a number and xM,l−1, yM,l−1 and zM,l−1 are the domain upper limits of x, y and z coordinates in the previous level. Usually, the generating kernel is constructed so that three properties hold: • Separability: w(m, n, o) = w(m) · w(n) · w(o); • Symmetry: w(−m) = w(m), w(−n) = w(n) and w(−o) = w(o); • Each node at level l should contribute the same total weight to nodes at level l + 1; The generating kernel used in work is the one where w(m) = w(n) = w(o) = 1/16 [1 4 6 4 1], which resembles the Gaussian function and thus gives rise to the Gaussian pyramid’s name. Figure 3.2 shows the generation of the first three levels of the Gaussian pyramid. Figure 3.2: Generation of three levels of the Gaussian pyramid, which are illustrated in the images on the left. The images on the right show the output of the intermediate smoothing step. Note that, although only one slice of each brain is depicted, both smoothing and subsampling steps take place in the three-dimensional volume.
- 4. Feature Extraction for Alzheimer’s Disease International organization of Scientific Research 26 | P a g e Local Variance Although VI is the most evident feature to use, since AD is characterized by a diminished brain metabolism and this feature measures that same information, other attributes of the volume produced by the PET scan might also contain discriminative information. In this section, a transformation of the original volume that captures its local contrast will be presented. The image total variance is one of the many definitions of contrast, known as RMS contrast. However to measure local contrast, one needs to consider the RMS’ local counterpart. In fact, areas with low contrast are fundamentally flat, having therefore low variance, while areas near corners or edges have higher contrast and also higher local variance. In the present work, the 3D nature of the biomarker that is being used for the CAD of AD demands the usage of the variance over a 3D neighborhood, which can be simply defined as the variance of P equidistant sample points xp = (xp, yp, zp) with voxel intensities Vp that lie on a sphere with a predefined radius R and centered at a given point xc = (xc, yc, zc) (Figure 3.3). This definition of neighbor set has one main advantage: it allows for the extraction of features at different scales by varying the radius R. The operator VARP,R can therefore be defined as: (3.4) Hence, if one varies the center xc, the local contrast of each voxel’s neighborhood can be computed. Figure 3.3: Neighbor sets for four different numbers of sampling points. Each neighbor point (red) lies on a sphere and is at the same distance to its closest samples. To be more precise, the equidistant property only holds completely accurate for the cases P = 8 and P = 12, while for the cases P = 24 and P = 98 an approximation is used. Since the voxel intensities in use are sampled at specific coordinates on the sphere, i.e., most samples do not belong to the VI domain, B, an interpolated value of Vp must often be calculated. In this case, trilinear interpolation was applied. Figure 3.4 shows a transformation of an input brain volume based on the operator VAR24,1. Note also that one can and should use the binary mask M(x, y, z) to reduce the number of features. Despite the simple formulation of this operator, equidistant sampling on the sphere has no exact solution for most number of sampling points, and the general task is known as Fejes Toth’s problem. Nevertheless, there are some numerical approximations available. It is stressed that the exact position of the sampling points is not crucial for this type of feature. Figure 3.4: Transformation of an input brain volume by the local variance operator based on a neighbor set of 24 samples located on a sphere of radius 1. After the transformation, voxels outside the brain were removed using the brain mask M described in section 3.2. Only one axial cut is depicted for visualization purposes.
- 5. Feature Extraction for Alzheimer’s Disease International organization of Scientific Research 27 | P a g e IV. CONCLUSION Regarding the VI features from the FDG-PET scan, the scale-space of the brain images was studied, allowing for a reduction of the number of features. Note that the number of voxels is reduced by a factor of eight (two in each space direction) in each level. The dimensionality reduction achieved by the pyramid representation of the scale-space has three main objectives. First, there is the possibility of improving the system’s performance by alleviating the small sample size problem. Second, it reduces the time consumed at the training stage and third, it allows studying how much data could be discarded without jeopardizing the system’s performance. A measure of local contrast, LVAR, was also introduced as the sample variance computed on a given 3D neighborhood. Since this type of feature estimates the variance of the image intensity on a given sphere for each position of the PET scan, the number of neighbors P has to be set high enough so that good estimates of the true variance can be computed. REFERENCES: [1] J. Ramrez D. Salas-Gonzalez M.M. Lpez F. Segovia I.A. Illn, J.M. Grriz. “18F-FDG PET imaging analysis for computer aided Alzheimers diagnosis”. Information Sciences, 181(11):903–916, 2010 Elsevier. [2] A. Lassl D. Salas-Gonzalez E.W. Lang C. G. Puntonet I. AlvarezM. Lpez J. M. Grriz, J. Ramirez and M. Gmez-Rio. “Automatic computer aided diagnosis tool using component-based SVM”. Nuclear Science Symposium Conference Record (NSS08), IEEE, 16(13):4392–4395, 2008. [3] J. M. Grriz J. Ramrez D. Salas-Gonzlez I. lvarez P. Padilla, M. Lpez. “NMF-SVM Based CAD Tool Applied to Functional Brain Images for the Diagnosis of Alzheimers Disease”. IEEE TRANSACTIONS ON MEDICAL IMAGING,FEBRUARY 2012, 31(2):1967–1976, 2012. [4] M. Silveira and J. Marques. “Boosting Alzheimer disease diagnosis using PET images, in Pattern Recognition (ICPR10)”,. Proceedings of the 2010 20th International Conference on. IEEE Computer Society,, 16(13):2556–2559,, 2010. [5] S. Eberl M. Fulham Y. Xia, L. Wen and D. Feng. “Genetic algorithm-based PCA eigenvector selection and weighting for automated identification of dementia using FDG-PET imaging”. Engineering in Medicine and Biology Society, 2008. EMBS 2008. 30th Annual International Conference of the IEEE, 16(13):4812–4815, 2008. [6] UCLA. Laboratory of neuro imaging. http://adni.loni.ucla.edu/about/, December 1,2012.