SlideShare a Scribd company logo
1 of 12
Download to read offline
International Journal of Business Marketing and Management (IJBMM)
Volume 3 Issue 3 March 2018, P.P. 34-45
ISSN: 2456-4559
www.ijbmm.com
International Journal of Business Marketing and Management (IJBMM) Page 34
Market Demand Analysis of Prawn and Milkfish for Cultivation
Business development in Malaka Regency, West Timor-Indonesia
By:
Franchy Ch. Liufeto1,2*
, Nuddin Harahab3
, ArningWilujeng Ekawati3
,
Soemarno4
1
Doctoral Program of Fisheries and Marine Science, Faculty of Fisheries and Marine Science, University of
Brawijaya, Malang, Indonesia
2
Faculty of Fisheries and Marine Science, University of Nusa Cendana, Kupang-East Nusa Tenggara,
Indonesia
3
Faculty of Fisheries and Marine Science, University of Brawijaya, Malang, Indonesia
4
Faculty of Agriculture, University of Brawijaya, Malang, Indonesia
Abstract: This research was conducted to find out the market demand of prawnandmilkfish in West Timor and
East Timor/Timor-Leste. The West Timor market demand survey was organized by involving 28 fish
merchants/seafood restaurant managers which were spread across 6 cities in West Timor. Furthermore, the
demand in East Timor was based on fish trade flows data at the Indonesia - Timor-Leste border post. The
matrix tabulation method was employed for calculating the milkfish and prawn consumption per capita
population of Timor-Leste, and the projection of milkfish and prawn demand in Timor-Leste region in the year
of 2014-2025 which was based on the projected population growth of Timor region. The results indicated that
prawn demand was spread within 6 urban markets in the region of Timor. Meanwhile, milkfish was highly
demanded in the local market. East Timor's prawn market demand forecast in the year of 2014-2025 reached
1,359.87 tons. Milkfish demand on the local market was up to 1,274.45 tons. The number of prawn demand was
much higher than the production at local level. Therefore, prawn could be considered as the main commodity
choice for the development of aquaculture in Malaka.
Keywords: Market demand, milkfish, prawn, aquaculture development
I. INTRODUCTION
Malaka Regency is one of the new autonomous regions in East Nusa Tenggara Province (NTT), which
has direct borders with the Democratic Republic of Timor-Leste (RDTL) and Australia. Based on the written
law number 43 in 2008, this area is responsible for conducting a socio-economic development for the welfare of
its territory. To achieve this goal, the aquaculture sector is one of many sectors that can be developed, especially
brackish water ponds (BPS NTT, 2013, BPP NTT, 2011, DKP Belu, 2012, Widiati, 2007; ATSEF, 2006 and
Liufeto, 2006).
The effort to develop aquaculture in Malaka requires considerable attention due to the existence of
various obstacles such as the low ability of human resources and technology in cultivation, as well as the
limited market information related to market opportunity and the commodity information required by market.
This condition should not be allowed since the development of prawn farming can support the growth and
economic development of border areas, as stated by Nugroho and Dahuri (2012), Bappenas (2011); FAO
(2006a); FAO (2006b); FAO (2004); FAO (2003); Barbier and Cox (2002); Tacon and Foster (2001) Forster
(2000); Francisco (2007); Dey et al. (2003), and Okorie (2003). Cultivation can support the economic
development of the border area because it can possibly become the backbone of the world's demand for seafood.
Furthermore, it may also contribute in increasing public income and international trade for the welfare of the
community.
Market Demand Analysis of Prawn and Milkfish for Cultivation Business development in Malaka….
International Journal of Business Marketing and Management (IJBMM) Page 35
II. LITERATURE REVIEW
2.1 Fishpond Cultivation
Fishpond is artificial pond-shaped wetland containing brackish water or seawater in coastal areas which
is used to cultivate brackish water animals (Wibowo.et al., 1996). According to the Directorate General of
Cultivation (2002), aquaculture is the raising activity and growing aquatic biota in fresh/brackish water pond
within a certain period of time. It employs harvesting to get the results.
According to Anderson (2007), Francisco (2007) and Nash (1995), an important step in the
development of cultivation is to identify species that meets the market demand. Leung et al. (2007) stated that in
a cultivation development effort, the following economic aspects are important to be part of consideration, such
as: the selection of species with a potentially strong market demand; the selection of species with strong
domestic and export markets; the production of the species at a logical cost.
2.2 Cultivation Development
The factors affecting the development of cultivation are composed of internal factor and external
factor. First, the internal factors include species selection and cultivation system. Second, the external factors
deal with environmental factors (physical, chemical, biological), social factors and market demand for certain
species at local, regional and national as well as international levels (Nash 1995).
Anderson (2007) mentioned that the phenomenon that arises in Asia as the leader of fish producers in
the world is shown by the growth of fish production in Asia. The growth of the cultivation sector is accelerating
in some countries (China, Thailand, and Malaysia) due to the abundance of aquatic environment and the rapid
absorption of new cultivation technology. The fish demand and the presence of infrastructure and institutions in
each country also contribute to the realization of potential cultivation in a particular region. The results of
Tajerin and Mohammad's (2004) research indicate that the developed and newly industrialized countries such as
South Korea, Taiwan, Hong Kong-China and Singapore can become a strong economic country due to the tight
competition of fish exports. According to Barbier and Cox (2002), prawn exports significantly increase foreign
exchange number for the countries that produce it.
Ahmed et al. (2004), Garcia et al., (2004), and Huang et al., (2004) explained that 54% of the total
cultivation production in some Asian countries is contributed from freshwater cultivation which is followed by
24% of brackish water cultivation and last, the sea cultivation that reaches 22%. Nash (1995) divides the
cultivation system into 3 basic systems categorizations when he considers the intensity of production. They are
extensive, semi intensive and intensive system.
According to Boers (2001), an intensive prawn pond can provide a high production of prawn with
shorter operational time than the extensive traditional pond cultivation. The criteria and technology applied in
prawn culture can be seen in Table 2.
Table 2. Prawn Cultivation Criteria and Technology
Criteria Cultivation Technology
Intensive Semi Intensive Traditional
Feed Complete formula
feed
Natural and additional feed Natural
Water Management Pumps and aerations Tidal and pump Tidal
Solid Distribution (tail / ha
/ Planting Season)
150,000-500,000 15,000 -150,000 1000-15,000
The size of the pond plot
(ha)
0.1-1 1-5 3-20
Production (ton / Planting
Season)
2-20 0.5-5 0.1-0.5
Length of Farming
(month)
3-4 3-4 4-6
The Impact of Cultivation Very high Moderate – high Insignificant
Source : CP Prima (2002)
2.3 Market Demand towards Aquaculture Commodity
The study of fish demand conducted in 9 Asian countries by World Fish Center from 2001-2004 (M.M.
Dey and Garcia, unpublished report) reported that fish as a source of animal protein, constitutes 13% of total
household expenditure after meat. In general, fish consumption in urban areas is found to be higher than in rural
Market Demand Analysis of Prawn and Milkfish for Cultivation Business development in Malaka….
International Journal of Business Marketing and Management (IJBMM) Page 36
areas. Fish buying expenses are higher within households that have higher incomes than those who have lower
incomes, with an average of 15% and 13%.
According to Dey et al., (2003), one of the perks of the cultivation sector in Asia is the export
orientation. According to Ahmed et al., (2003) countries that acquire food deficits such as Vietnam, Indonesia,
Thailand and Malaysia contribute more than 20% to the total amount of fish trade. In these countries, fish
exports are equivalent to approximately 42% of their food imports.
Theoretically, demand is derived from the consumption theory in which consumers want to ask for an
item at a certain price because it is considered to be useful for them (Hanafie, 2010). The growth of cultivation
sector within a state will remain constrained if the market is limited only at local level, mainly because it has
little economic importance. On the other hand, the demand at regional, national and export levels stand for a
much greater risk since it has to be able to maintain the stability of the volume of products sold. The producer's
choice at this level can be in form of: producer cooperation, producer organization, or owners of core companies
are forming an integrated company.
III. RESEARCH METHOD
This research belonged to explanatory research by utilizing survey method in which the survey was essentially a
method to find out about what was happening in people's life specifically and realistically. Survey research method
according widi(2010) was a research effort by collecting information or data through interview or questionnaire.
3.1Data Collection
This research belonged to explanatory research by utilizing survey method in which the survey was essentially a
method to find out about what was happening in people's life specifically and realistically. Widi’s survey research method
(2010) wan order to get an idea of the market demand for milkfish and prawn, market demand survey was conducted in
seafood restaurants and fish and prawn collectors in East Timor's urban markets which were spread across Kupang, Soe,
Kefa, Atambua, and Malaka. Meanwhile the milkfish and prawn data entered East Timor was collected from East Nusa
Tenggara Fish Quarantine Station and Fish Quarantine Station data located at Motaain and Belu; the border between East
Nusa Tenggara -East Timor.
The secondary data used in this research were as follows: (a) the trading flow of fishery commodities especially
prawn and milkfish to East Timor for the last 4 years; (b) the data of prawn catching production in Malaka and Kupang
Regency as the production areas of Timorese land prawn, and (c) the population of Timorese land for the last 5 years from
various related institutions namely: the Office of Marine and Fisheries of Malaka, the Office of Marine and Fisheries of
Belu, Belu and MalakaCentral Statistics Agency, Central Statistics Agency of East Nusa Tenggara Province, last the East
Kalimantan Fish Quarantine Agencyand Border.
The data of stakeholder support towards the development of aquaculture was carried out by conducting a
stakeholder perception survey toward the cultivators, fishermen, collectors, bureaucrats and legislators, religious figures and
community leaders in Malaka as well as those who were following the history of aquaculture activities in Malaka. Those
respondents were asked to fill in the questioner data on cultivation development that also covered the level of education; the
hope of cultivation development; the enforcement of rules in aquaculture; the role of aquaculture ponds; stakeholders’
support toward the cultivation and safety of aquaculture products; the environmental concerns; market and consumer
demand; the sustainable cultivation development; the comparative advantage of aquaculture in Indonesia with the
neighboring counties, such as East Timor and Australia. Thenumbers ofrespondents involved in this survey were 71 people.
Data collection based on the questionnaire was done by performing in depth interview. Furthermore, field
observation was applied to control the truth of data information. Selection of respondents was conducted for those who were
considered to be really understood and deeply involved in conducting pond farming. The number of total respondents for
cultivators / fishermen reached up to at least 20% of the total cultivators in Wewiku. Then, the sub-district community
leaders, educators, regional leaders, and religious leaders from each region were selected only one person who had adequate
competencies such as experience, reputation, position, and cultivation development knowledge.
3.2 Data Analysis
The analyses of Timor-Leste region’s market demand for prawn and milkfish were including the
amount of sold prawn and milkfish demand in Timor-Leste market through the utilization of data analysis and
cross tabulation. Meanwhile, the projection of market demand for prawn and milkfish was calculated based on
the projected population growth in the territory of Timor Region within the period of 2014-2025.
The analysis of minimum demand of West Timor market for prawn and milkfish was calculated based
on the market demand survey of milkfish and prawn at seafood restaurants and markets which were spread
across five urban areas of Kupang, Soe, Kefa, Atambua and Malaka located at mainland West Timor. Next, the
supporting data on the number of milkfish and prawn traded to Timor Leste (from year 0f 2010 – 2014) was
received from the Fish Quarantine Post at the Motaain Border.
Market Demand Analysis of Prawn and Milkfish for Cultivation Business development in Malaka….
International Journal of Business Marketing and Management (IJBMM) Page 37
The projection of East Timor market demand for milkfish and prawn was carried out through the
following steps: describing milkfish and prawn production data from 2008-2013 in West Timor; calculating the
possibility of milkfish and prawn demand in West Timor with the data supporting of milkfish and prawn trade
flows to East Timor during 2010 -2014; predicting the rate of milkfish consumption and prawn per capita; and
forecasting the demand of milkfish and prawn market for the year of 2014-2025 based on projected population
growth of Timor region with geometric population growth rate calculation Pt = Po (1 + r) t
.
IV. RESULT AND ANALYSIS
4.1 Real Demand and Prawn Production in Malaka
A market demand survey was conducted for 28 seafood restaurants, and prawn and fish sellers in the
urban market which were spread across the mainland of Timor. The data are presented as in Table 1.
Table 1. The Demand Overview of West Timor and East Timor Regional Market in 2014
Location Fulfilled Demand (ton)
Prawn Milkfish
Kupang 9.144 -
SoE 0.72 -
Kefa 1.56 -
Atambua 36.127 -
Malaka 9 576.8
Timor Leste 1.132 0.563
Total Demand 57.683
Average Production Per Year 52 577.5
Lack of natural production (tons) 5.68 -
Table 1 showed that prawn demand in West Timor land reached 57.68 tons or 98% of the total market
demand for prawn market. It consisted of the region of Timor up to East Timor. Meanwhile, there was no
demand for milkfish in the restaurant or the Timorese mainland market. These results indicated that prawn
demand was stronger and more prevalent in cities in West Timor than the milkfish demand that was indicated
only by the local market of Malaka as a producer of milkfish cultivation.
The results of interviews with the managers of seafood restaurants and sellers of prawn and fish
marketed informed that the amount of natural prawn production was very limited between July-December, while
the needs and consumer demand tend to be stable for each week of every month with the price reached IDR
100,000, - per kg. Referring to the above assumptions, the minimum demand for prawn in the market of the
Timor region for one year was calculated 2 times of the fulfilled prawn demand, which was about 115.37 tons of
prawn per year.
The production data in Table 2 displayed the total average of milkfish production in 2014 was 577.5
tons. The demand for milkfish in Malaka local market was 0.998 times of the average milkfish production in
Malaka. Prawn production in Malaka was 52 tons / year, while the demand met for the Timorese market within
one year was 115.37 tons. The figure represented 2.21 times of the average prawn production from Malaka. The
number of prawn and milkfish production in Malaka Regency can be seen in Table 2 and Figure 1.
Market Demand Analysis of Prawn and Milkfish for Cultivation Business development in Malaka….
International Journal of Business Marketing and Management (IJBMM) Page 38
Table 2. Prawn and Milkfish Production from Malaka Regency in 2008-2013
Year White
Prawn
(ton)
Giant
Tiger
Prawn
(ton)
Number
of Prawn
(ton)
Total Capture
Production
(ton)
Milkfish
(ton)
Total
Cultivation
Production
(ton)
2008 72.5 11.8 84.3 1592.7 345.1 353.7
2009 36 4.3 40.3 1762 350.3 627
2010 30.4 4.5 34.9 1845 627 654
2011 44.9 5.1 49.9 2580.3 626.5 644.2
2012 45.8 5.2 50.9 1914.2 722 766.8
2013 46.7 5.3 52 1952.5 794 832.2
Total 340.4 117.4 312.3 11646.6 3464.8 3877.9
Max 72.5 60.5 84.3 2580.3 794 832.2
Min 21.9 4.3 34.9 1592.7 345.1 353.7
Mean 41.8 13.5 52 1941.1 577.5 646.3
Standard
Deviation 14.5 2.9 17.2 338.2 188.8 164.4
%
Production 2.2 0.7
89.3
Source : BPS Belu (2008-2013); BPS Malaka (2014)
Figure 1. Prawn and Milkfish Production in Malaka in 2008-2013
4.2 The Milkfish and Prawn Trade Flow to East Timor during 2010-2014
The data on trade flows of prawns and milkfish to Timor-Leste during 2010-2014 exhibited that
the average of prawn and milkfish supply decreased by 0.03% and 0.001% per year respectively.
Although the supply of milkfish and prawn to Timor-Leste had been decreasing, in Table 3 and Figure 2,
it was also disclosed the amount of prawn trade to Timor- Leste which was much greater than the number
of milkfish trade.
0
100
200
300
400
500
600
700
800
900
2008 2009 2010 2011 2012 2013
Ton
Year
Milk Fish
White Prawn
Giant Tiger Prawn
Market Demand Analysis of Prawn and Milkfish for Cultivation Business development in Malaka….
International Journal of Business Marketing and Management (IJBMM) Page 39
Table 3. Trade Flows Data of Prawns and Milkfish Trade to Timor-Leste
Year Milkfish (ton) Prawn (ton)
Milkfish
Expansion (%)
Prawn
Expansion (%)
2010 1.548 17.262 0 0
2011 3.157 10.727 -0.065 0.016
2012 1.205 10.521 -0.002 -0.001
2013 1.377 2.261 -0.082 0.001
2014 0,.563 1.132 -0.011 0.008
Total 7.85 41.903
Average 1.57 8.381 -0.0322 -0.001
Source: Fish Quarantine Center Motaain (2015)
Figure 2. Graph of Milkfish and Prawn Supply to Timor-Leste
4.3 The Prediction of Milkfish and Prawn Demand through the Timor’s Population Projection
The data of milkfish and shrimp trade flows to Timor-Leste from the Border Fish Quarantine Post in
Motaain revealed that the origin of shrimp traded to Timor-Leste was not solely from Malaka but also from
Kupang Regency as one of the shrimp producers in the region of Timor.
Based on this information, the projection of shrimp demand in the territory of Timor Region was
completed by calculating the production of white shrimp and tiger shrimp originating from Kupang and Malaka
Regency, as shown in Table 4 below.
Table 4. Giant Tiger Prawn and White Prawn Production from KupangandMalakaduring 2008-2013
Year Giant Tiger Prawn White Prawn
Kupang Malaka Kupang Malaka
2008 1.75 11.82 59.8 72.45
2009 1.75 4.3 59.8 35.99
2010 1.85 4.45 61.74 30.43
2011 1.63 5.06 53.31 44.86
0
2
4
6
8
10
12
14
16
18
20
2010 2011 2012 2013 2014
Ton
Year
Milk Fish
Prawn
Market Demand Analysis of Prawn and Milkfish for Cultivation Business development in Malaka….
International Journal of Business Marketing and Management (IJBMM) Page 40
2012 1.54 5.16 50.62 45.76
2013 0.36 5.28 1 46.69
Production Growth
Rate (%) 0.041 0.089 0.003 0.129
Source: BPS KupangdanBelu (2009-2014)
The calculation of projected white prawn and giant tiger prawn production in 2014-2025 was based on
development data of giant tiger prawn and white prawn production from Kupang and Malaka Regency as shown
in Table 4. The results of the calculations are presented in Table 5 and 6.
Table 5. Projection of Giant Tiger Prawn Production in Kupang and Malaka for Year 2014 - 2025
Regency
Average
Production
Production
Growth
Rate of
Giant
Tiger
Prawn
Year of
Projection
(ton)
Year 2013 (ton) 2014 2015 2016 2017 2018 2019 2020 2025
Kupang 1.48 0.041 1.421 1.364 1.309 1.257 1.207 1.158 1.112 0.907
Malaka 6.01 0.089 5.475 4.988 4.544 4.140 3.771 3.435 3.130 1.964
Total 7.49 6.896 6.352 5.853 5.397 4.978 4.594 4.242 2.871
Source : Kupang and Malaka Regency in Numbers (2009-2014) (processed data)
Notes : Calculation of Prawn Production Projection was from:
Base Year Production 2013 * (1 – growth rate)
Table 6. Projection of White Prawn Production in Kupang and Malaka for Year 2014 - 2025
Regency
Average
Production
Production
Growth Rate
of White
Prawn
Year of
Projection
(ton)
Year 2013 (ton) 2014 2015 2016 2017 2018 2019 2020 2025
Kupang 47.71 0.003 47.57 47.42 47.28 47.14 47.00 46.86 46.72 46.02
Malaka 47.38 0.129 41.22 35.86 31.20 27.14 23.62 20.55 17.87 5.10
Total 95.09 0.13 88.79 83.29 78.48 74.28 70.61 67.40 64.59 51.12
Source : Kupang and Malaka Regency in Numbers (2009-2014) (processed data)
Notes : Calculation of Prawn Production Projection was from:
Base Year Production 2013 * (1 – growth rate)
The projected number of white prawn and giant tiger prawn production from Kupang and Malaka in
2013-2025 is presented in Table 7.
Table 7. Projection of Prawn Production (White and Giant Tiger) in Kupang and Malaka Year 2014 - 2025
Year
Data 2013 2014 2015 2016 2017 2018 2019 2020 2025
Prawn
Production
(ton) 102.58 95.68 89.64 84.34 79.68 75.59 72.00 68.83 54.00
The prediction of market demand for milkfish and prawn during the year of 2014-2025 was based on
the calculation of prawn and milkfish per capita numbers multiplied by population of Timor region. To calculate
the population growth of Timor region, the projected population growth of Timor region was based on the
geometric population growth formula Pt = Po (1 + r) t with the basic data of Timor’s region population year of
2009-2013 as presented in Table 8.
Market Demand Analysis of Prawn and Milkfish for Cultivation Business development in Malaka….
International Journal of Business Marketing and Management (IJBMM) Page 41
Table 8. Average of East Region Population Growth Rate in 2009-2013
Total Population
Year
Kupang
City Kupang TTS TTU Belu/Malaka
2009 291.749 297.402 435.039 227.147 382.375
2010 336.239 304.548 441.155 229.803 354.676
2011 342.892 310.573 448.693 232.051 357.650
2012 365.348 321.384 449.881 234.645 362.610
2013 378.425 328.688 451.922 240.686 374.381
Population
Growth Rate 0.324 0.276 0.260 0.265 0.245
Average 0.274
Source: Statistics Indonesia of East Nusa Tenggara, 2010-2014
The calculation of the average rate of prawn consumption per capita population of the West Timor
region was achieved by determining in advance the amount of prawn demanded by the West Timor region
market. In this case, the average natural prawn production in 2014 which was 95.68 tons / year minus the
average of trade flowof prawn to Timor Leste of 8.381 ton / year so that the average of prawn demand reached
by population of West Timor region was 87,299 ton.
The rate of prawn consumption per capita of West Timor population was made by dividing the fulfilled
prawn demand (for 6 months natural prawn production) in 2014. It meant that 87.299 tons divided by population
of East Timor region in 2013 which was 1,774,102 people so that the average prawn consumption rate of West
Timor was 0.0492 kg / capita / 6 months. Meanwhile, the number of prawn trade flows to East Timor was
calculated at 8.381 tons. Then, the number would be divided by the total population of East Timor in 2013
which was 1.17 million so that the demand for prawn to Timor-Leste from NTT met 0.00071 kg / capita / 6
months.
In order to obtain a description of prawn demand in the region of Timor for 1 year, the calculation of
prawn demand per capita for 6 months was multiplied by the number of prawn demand for the region for a year
(2.21 tons). The number was obtained from the sharing number of prawn demand in 2014 (115.37 tons) that
later on would be divided with the average production of Malaka’s prawn (52 tons). This consideration took
place due to the dominant existence of Malaka’s prawn than the Kupang’s Prawn on the market.
Table 9 presented the projection of population growth; the prediction of prawn needs; and the
probability of the prawn number that could be cultivated.
Table 9. Projection of Prawn Demand based on the Numbers of Regional and Timor Population
Projection
Base Year
2013
Year
2014 2015 2016 2017 2018 2019 2020 2025
Regional
Citizen
(inhabitant) 1,774,102 2,255,666.05 2,864,695.884 3,638,163.772 4,620,467.99 5,867,994.348 7,452,352.822 9,464,488.084 31,269,125.36
Fulfilled prawn
demand (kg) 87029.64 110527.64 140370.10 178270.02 226402.93 287531.72 365165.29 463759.92 1657263.64
Prawn demand in
6 months (ton) 87.03 110.53 140.37 178.27 226.40 287.53 365.17 463.76 1657.26
Prawn demand in
1 year (ton) 191.47 243.16 308.81 392.19 498.09 632.57 803.36 1020.27 3645.98
Timor-Leste
Citizen
(inhabitant) 1172390.00 1206389.31 1241374.60 1277374.46 1314418.32 1352536.45 1391760.01 1432121.05 1652177.12
Timor-Leste
demand (kg) 8323.97 8565.36 8813.76 9069.36 9332.37 9603.01 9881.50 10168.06 11730.46
Prawn demand in
6 months (ton) 8.32 8.57 8.81 9.07 9.33 9.60 9.88 10.17 11.73
Prawn demand in
1 year (ton) 18.31 18.84 19.39 19.95 20.53 21.13 21.74 22.37 25.81
Regional demand
and Timor-Leste
(6 months) 95.35 119.09 149.18 187.34 235.74 297.13 375.05 473.93 1668.99
Market Demand Analysis of Prawn and Milkfish for Cultivation Business development in Malaka….
International Journal of Business Marketing and Management (IJBMM) Page 42
Regional demand
and Timor-Leste
(1 year) 209.78 262.00 328.20 412.15 518.62 653.70 825.10 1042.64 3671.79
Prawn production
(ton) 102.58 95.68 89.63 84.33 79.68 75.59 71.99 68.83 53.99
Production
shortage (ton/6
months) 7.23 23.41 59.55 103.01 156.06 221.54 303.06 405.10 1615.00
Production
shortage
(ton/year) 107.20 166.32 238.57 327.82 438.94 578.11 753.11 973.81 3617.80
Notes:
*1). Projection of Regional Citizens = Citizens in Base Year 2013 * (1+0.27)n
*2). Prawn Demand from TB Region= Prawn consumption average 0.0492* citizen (inhabitant)
*3). Prawn Demand from Timor-Leste = Prawn consumption average 0.039* Timor-Leste citizens
*4). 1 year demand= 2.2 x demand for 6 months
*5) Production shortage = Demand – nature production
Based on data from Table 9 above, the recapitulation of demand and prawn production opportunities was shown
in Table 10 below.
Table 10. Prediction of Prawn Demand from Regional and Timor-Leste in 2013 - 2025
Year
Prawn Demand (ton)
Total
Demand(ton)
Nature
Supply
(ton)
Production
Shortage
(ton)
Regional
Timor-
Leste
2013 191.46 18.31 209.77 102.58 107.19
2014 243.16 18.84 262 95.68 166.32
2015 308.82 19.39 328.21 89.63 238.58
2016 392.19 19.95 412.14 84.33 327.81
2017 498.09 20.53 518.62 79.68 438.94
2018 632.57 21.13 653.7 75.59 578.11
2019 803.36 21.74 825.1 71.99 753.11
2020 1020.27 22.37 1042.64 68.83 973.81
2025 3645.98 25.81 3671.79 53.99 361.8
Meanwhile, the projection of milkfish production in Malaka regency was obtained by calculating the
average growth of milkfish production in Malaka over the period of 5 years from 2008-2013 as in Table 11.
Table 11. Milkfish Production and Production Average in Malaka during 2008-2013
Year Total Production
Production
Increase (ton)
Milkfish Cultivation
2008 345.05 353.73 0
2009 350.25 627 5.2
2010 627 654 276.75
2011 626.5 644.2 -0.5
2012 722 766.81 95.5
2013 794 832.2 72
Total 3464.800 3877.940 448.950
Mean 577.467 646.323 64.136
Standard Deviation 188.828 164.387 107.070
Average of Increase
(%) 0.111
Market Demand Analysis of Prawn and Milkfish for Cultivation Business development in Malaka….
International Journal of Business Marketing and Management (IJBMM) Page 43
Table 12 depicted the average of milkfish export increase to Timor Leste based on the trading growth rate.
Table 12. Average of Milkfish Export Value from East Nusa to Timor-Leste in 2010-2014
Year Average of Milkfish Export (Ton)
Production
Increase
2010 1.548 0
2011 3.157 1.609
2012 1.205 -1.952
2013 1.377 0.172
2014 5.749 4.372
Mean 2.6072 0. 8402
Production (%) 0.00145
The production and demand for milkfish based on the projected population growth of Malaka was
presented in table 13 below by looking at local milkfish demand with milkfish production growth rate that
reached 0.111% and also the milkfish trade rate to Timor-Leste (0.8402%).
Table 13. Average Prediction of Milkfish Production in Malaka Year 2015 - 2035
Demand Projection / Year 2013 2014 2015 2016 2017 2018 2019 2020 2025
Milkfish Production (ton) 577.5 641.6 712.8 791.9 879.8 977.5 1086 1206.5 2042.2
Export Demand (ton) 2.6072 2.611 2.6148 2.6186 2.6224 2.6262 2.63 2.6338 2.6529
Demand from Malaka
(version 1) (ton) 575.0 639.0 710.0 789.0 877.0 975.0 1083.0 1204.0 2040.0
Malaka Citizens 171079.0 173033.0 175009.0 177007.0 179029.0 181073.0 183141.0 198293.0 209877.0
Prediction of Milkfish
Demand based on
Population (Kg) 577460.1 584055.6 590725.4 597469.4 604294.5 611193.8 618174.1 669318.2 789960.2
Prediction of Milkfish
Demand based on
Population (ton) 577.5 584.1 590.7 597.5 604.3 611.2 618.2 669.3 790.0
Local Demand from
MalakaCitizens (version
2) 574.9 581.4 588.1 594.9 601.7 608.6 615.5 666.7 787.3
Notes:
Milkfish Production = Average of production increase 0.111 x milkfish production in 2013
Average of Milkfish Export = 0.00145 * milkfish production in 2013
Local Consumption Version 1 = Milkfish Production – Export Average
Malaka Citizens = base year of 2013 was 171,079 with growth rate by 0.01142/year
Prediction of Milkfish Demand = Average of Milkfish Consumption from Malaka (3.375 kg/capita/year) x
total
population
Local Consumption Version 2 = Demand Prediction based on Population – average of export
The factual information regarding prawns and milkfish demand in the region of Timor has not existed
yet, so this data is expected to be able to provide preliminary information in seeking the priority opportunities in
the development of aquaculture fishpond especially for prawn and milkfish commodities in Malaka. Diana
(2009) said that population growth and increasing individual consumption rate indicate that seafood products are
gradually becoming more important than just as an additional food source. It is in relation to what Zainal et
al.(2017), FAO (2006) has shown that world seafood demand is projected to be multiplied. It is due to the drive
of population growth, intense urbanization (often associated with increasing number of animal’s protein
consumption) and rising incomes.
The fact revealed that milkfish demand which was only favored in Malaka’s local market was not
significant. It was only IDR 30,000 / kg with a small risk because not all commodities were harvested at the
same time and yet harvesting was not organized at any time. On the other hand, prawns create an opportunity to
be developed as a leading commodity for the development of aquaculture in Malaka since it has high selling
Market Demand Analysis of Prawn and Milkfish for Cultivation Business development in Malaka….
International Journal of Business Marketing and Management (IJBMM) Page 44
value with high demand rate dispersed across all regency cities in the Timor region. Nash (1995) explained that
in remote rural areas, the structure of product marketing is often very traditional and the farmers simply adapt to
existing local market systems by providing cheap fish to keep them available to local people with low
purchasing power. This situation can still be found in Malaka in which milkfish marketing only meets the local
market need and sometimes, the trading process even employs barter system.
Furthermore, Nash (1995) said that the cultivation development in a region or country will always be
limited if its development is constrained to local level with little economic interest. To meet the needs of the
regional market, all cultivated organisms must be harvested at the same time, for immediate processing and sale.
Consumers are centrally located in larger urban centers or into institutional markets with large volumes of
potentially feasible products. Consumers in this market have more purchasing power and demand more choices,
so the consequence is the cultivators should be able to produce products with additional value and to provide a
variety of species according to local technical skills and environmental resources.
Leung et al. (2007) explained that the economic aspect required to be considered in the development of
cultivation is to select the correct species. It should have large market potentials with strong demand in the
available market segments. It is expected also on the following aspects: financially feasible to be cultivated;
having potential domestic and export markets; open to an opportunity of a value-added product; having a high
selling price; and can be produced at a logical cost. FAO (2006) assures that many policies aimed at the
employment of cultivation in the role of improving food security, in addition to the concentration and attention
to bring in foreign exchange and encourage economic growth.
Moreover, Anderson (2007) also implies that the development of sustainable cultivation is also an
economical sustainable cultivation. The other type of sustain abilities, such as socio-political sustainability and
environmental sustainability, will not be relevant if there is no economic sustainability. According to FAO
(2010), the forces that drive prawn cultivation are: the limited and unstable of natural prawn production; the
value of profits from prawn farming; and the high demand of prawn in global markets. Next, the international
trade in fishery products in most developing countries aims to promote economic growth and poverty
alleviation (Diana, 2009). According to Rivera-Ferre (2009) prawn is the most widely traded seafood products
in the international market. In 2008, prawn farming is ranked 2nd in the world for production value category
and is placed as 4th for the worldwide production number (FAO, 2010b).
V. CONCLUSION
Market demand of prawn and milkfish in West Timor and East Timor/Timor-Leste has been predicted
very high.The results indicated that prawn demand was spread within 6 urban markets in the region of Timor.
Meanwhile, milkfish was highly demanded in the local market. East Timor's prawn market demand forecast in
the year of 2014-2025 reached 1,359.87 tons. Milkfish demand on the local market was up to 1,274.45 tons. The
number of prawn demand was much higher than the production at local level. Therefore, prawn could be
considered as the main commodity choice for the development of aquaculture in Malaka.
REFERENCES
[1] Abidin, Z. NuddinHarahab, Boimin. (2017). Analysis of Marketing Mix on Purchase Decision of Softboned-Milkfish “Mrs. 30
Jeni” in Malang City of East Java. ECSOFiM: Economic and Social of Fisheries and Marine Journal. Vol.5 (1): 30-41 Available
online at http://ecsofim.ub.ac.id/
[2] Ahmed M., M.A.Rab., M.M. Dey,2003. Changing structure on fish supplydemand and trade in developing countries
inMahffuzudin Ahmed, Madan M. Dey., Yolanda Garcia, 2007. The role of species and growth of aquaculture in Asia : Need and
prospect In Leung et al.,., 2007. Species and system selection for sustainable aquaculture, Blacwell Publishing IOWA USA.
[3] Ahmed M., M.M. Hossain, N.M Humayun., M.B Hossain., M.S Haque., R.K Talukder., dan S. Alam, 2004. Final country report
:Bhangladesh. Strategies and options for increasing and sustaining fisheries and aquaculture production to benefit poor household
in Asia. Project inMahffuzudin Ahmed, Madan M. Dey., Yolanda Garcia, 2007. The role of species and growth of aquaculture in
Asia : Need and prospect In Leung et al.,., 2007. Species and system selection for sustainable aquaculture, Blacwell Publishing
IOWA USA.
[4] Anderson 2007. Sustainable aquaculture : what does it mean and How do we get there ? In Leung et al.,., 2007. Species and
system selection for sustainable aquaculture, Blacwell Publishing IOWA USA Anderson
[5] BPS- Central Bureau Statistics Belu Regency, 2012. Belu Regency in Figure.
[6] Barbier, E.B danCox,M. 2002. Economic and demography factors affecting mangrove lloss in the coastal provinces of Thailand, 1979-1996. Ambio,
(31):351-357.
[7] Boers, 2001. Sustainable coastal aquaculture. The economic and environmental rehabilitation of traditional aquaculture ponds at Sinjai, South
Sulawesi,Indonesia.Collaborative Environmental Project InIndonesia, Jakarta Indonesia. 64 pp.
Market Demand Analysis of Prawn and Milkfish for Cultivation Business development in Malaka….
International Journal of Business Marketing and Management (IJBMM) Page 45
[8] Dey and Ahmed, 2005. Aquaculture – Food and livelihood for the poor in Asia : A brief overview of the issues. Aquaculture
economic and management 9(1-2) : 1-10 inMahffuzudin Ahmed, Madan M. Dey., Yolanda Garcia, 2007. The role of species and
growth of aquaculture in Asia : Need and prospect In Leung et al., 2007. Species and system selection for sustainable
aquaculture, Blacwell Publishing IOWA USA.
[9] Department of Marine and Fisheries Belu, 2012. Report on Assessment and Determination of Minapolitan Area of Belu Regency.
[10] Diana,J.S.,2009.AquacultureproductionandBiodiversityConservation.BioSciense(59):27-38.
[11] Directorate General of Aquaculture, 2002. Principal thoughts of Coastal Management's draft law. Jakarta
[12] FAO, 2003. Fisheries statistic. Food and Agriculture Organization of the United Nations, Rome Italy.
ftp://ftp.fao/org/docrep/fao/009/a0597e/a-597e.pdfinMahffuzudin Ahmed, Madan M. Dey., Yolanda Garcia, 2007. The role of
species and growth of aquaculture in Asia : Need and prospect In Leung et al.,., 2007. Species and system selection for
sustainable aquaculture, Blacwell Publishing IOWA USA.
[13] FAO, 2004. The State of world Fisheries and Aquaculture 2004. Fisheries Departement, Food and Agriculture Organization of the United Nations.
RomeItaly
[14] FAO, 2005. Fish Statplus. Food and AgroicultureOrganitation of The United Nations Rome Italy. Http:
www.fao,org/fi/statist/FISOFT/FISHPLUS.asp
[15] FAO,2006a.FishStat.FisheriesDepartement,FoodandAgricultureOrganizationoftheUnitedNation.RomeItaly.
[16] FAO, 2006b. Production : Environment, species, quatities and values. Chapter 2 in Expert Workshop on Global Review on Status and Trens in
Aquaculture and Prospective analysys of Future Aquaculture Development. Guangzhou City, Guangdong, China.12-15 March 2006. Food and
AgricultureOrganizationoftheUnitedNations,RomeItaly.
[17] FAO, 2010., Yearbook of fishery statistics, htpp : //www.fao.org. Retrieved on 1 March 2011.
[18] Francisco, 2007. Socioeconomics Aspects of Species and System Selection For Sustainable Aquaculture Development in Mexico : Historic Overview
and Current General Trends In Species and System Selection by Leung Ping Sun, Cheng Sheng Lee and Patricio J O’Brian. Blackwell Publishing,
IOWA USA
[19] Fragedous, K. 2002. Shrimp Farming in The Mekong Delta. Its develompent and impact on the economy and local society. OIKOS Environmen
Resouces. A report submitted in partial fullfilment of the GAMBAS Project Contract 99/362-B7/6200 Ifremer/European Commission DG
Development,19pp
[20] Hanafie, R. 2010. Introduction to Agricultural Economics. Publisher CV ANDI.
[21] Ministry of Marine Affairs and Fisheries In Figures, 2012.
[22] Leung., P.S., C.S. Lee and P.J. O’Bryen., 2007. Species and system selection for sustainable aquaculture.Blackwell publishing,
IOWA-USA.
[23] Liufeto, F. 2006. Fishery Feasibility Survey Report in NTT Province. Cooperation Team IPB and Ministry of Marine Affairs and
Fisheries RI. Not Published.
[24] Nash, C., 1995. Aquaculture Sector Planning and management. The University Press, Cambridge.
[25] Nash, C. 2004. Achieving Policy Objectives to Increase the Value of The Seafood Industry In The United States : The Technical
Feasibility and Associated Constraints. Food Policy, 29 (6) : 621-641
[26] Nugroho I and R. Dahuri, 2013. Regional Development: Economic, Social and Environmental Perspectives. Jakarta - LP3ES.
[27] Okorie, 2003. Nigeria Fisheries at the time of economic paradigm shift. AA Eyo (ed). IsheriesSocietty of Niger, FISON. In
Proceeding of 18th
Annual conference of fisheries society of Nigeria . pp 16-21
[28] Tacon, AGJ. 2001. Increasing the Contribution od Aquaculture for Food Security and Poverty Alleviation . In A Tacon (ed) Aquaculture in third
millennium.Bangkok,Thailand,20-25Februari2000.NACA,FAO,Romepp66-71
[29] Tajerin and Mohammad. Noor, 2004. Indonesia Shrimp Competitiveness in the international market: An analysis with market
share approach using econometric model. Economic Journal of Development, State Economic Review, p. 187-191.
[30] Wibowo, P., Ch.E. Nirarita, S. Susanti, D.Padmawinata, Kumarini, M.Syarif., Y. Hendriani, Kusniangsih, L. Br Sinulingga.
1996. Indonesia Wetland Ecosystem: A Guide Book for Teachers and Educational Practitioners. Wetlands International-
Indonesia Program Bogor.
[31] Widiati, A. 2007. Policy and strategy of spatial planning of border areas between countries in NTT Province.Journal of Science
and Technology Indonesia Vol 9 No. 3 December 2007. P 110-119.
[32] Widi, R.K. 2010. Principles of Research Methodology.

More Related Content

What's hot

Postharvest Loss Assessment of Banana at Jimma Town Market.
Postharvest Loss Assessment of Banana at Jimma Town Market.Postharvest Loss Assessment of Banana at Jimma Town Market.
Postharvest Loss Assessment of Banana at Jimma Town Market.
Premier Publishers
 
20170131 enhancing the fav seedling business models in ethiopia final report
20170131 enhancing the fav seedling business models in ethiopia final report20170131 enhancing the fav seedling business models in ethiopia final report
20170131 enhancing the fav seedling business models in ethiopia final report
Ntalemu
 
The Influence Of Socio-Economic Characteristics on Consumers’ Preference on F...
The Influence Of Socio-Economic Characteristics on Consumers’ Preference on F...The Influence Of Socio-Economic Characteristics on Consumers’ Preference on F...
The Influence Of Socio-Economic Characteristics on Consumers’ Preference on F...
Agriculture Journal IJOEAR
 
8.wondimagegn mesfin 78 89
8.wondimagegn mesfin 78 898.wondimagegn mesfin 78 89
8.wondimagegn mesfin 78 89
Alexander Decker
 
Profitability Analysis and Adoption of Improved Box Hive Technology by Small ...
Profitability Analysis and Adoption of Improved Box Hive Technology by Small ...Profitability Analysis and Adoption of Improved Box Hive Technology by Small ...
Profitability Analysis and Adoption of Improved Box Hive Technology by Small ...
AI Publications
 
Adoption of Aquaculture Technologies among Fish Farmers in Oluyole Local Gove...
Adoption of Aquaculture Technologies among Fish Farmers in Oluyole Local Gove...Adoption of Aquaculture Technologies among Fish Farmers in Oluyole Local Gove...
Adoption of Aquaculture Technologies among Fish Farmers in Oluyole Local Gove...
AI Publications
 
Value Chain Analysis of Banana in Mizan Aman Town of Benchi Maji Zone, Southw...
Value Chain Analysis of Banana in Mizan Aman Town of Benchi Maji Zone, Southw...Value Chain Analysis of Banana in Mizan Aman Town of Benchi Maji Zone, Southw...
Value Chain Analysis of Banana in Mizan Aman Town of Benchi Maji Zone, Southw...
AI Publications
 
Survey and Identification of Rice Diseases in South Gondar Zone, Amhara Regio...
Survey and Identification of Rice Diseases in South Gondar Zone, Amhara Regio...Survey and Identification of Rice Diseases in South Gondar Zone, Amhara Regio...
Survey and Identification of Rice Diseases in South Gondar Zone, Amhara Regio...
Journal of Agriculture and Crops
 
IMPACTS OF FARMERS STORAGES
IMPACTS OF FARMERS STORAGESIMPACTS OF FARMERS STORAGES
IMPACTS OF FARMERS STORAGES
Nezif Abamecha
 

What's hot (20)

Socio Economic Variables of Cashew Farmers in Oyo State, Nigeria
Socio Economic Variables of Cashew Farmers in Oyo State, NigeriaSocio Economic Variables of Cashew Farmers in Oyo State, Nigeria
Socio Economic Variables of Cashew Farmers in Oyo State, Nigeria
 
Postharvest orange losses and small scale farmers’ perceptions on the loss ca...
Postharvest orange losses and small scale farmers’ perceptions on the loss ca...Postharvest orange losses and small scale farmers’ perceptions on the loss ca...
Postharvest orange losses and small scale farmers’ perceptions on the loss ca...
 
Postharvest Loss Assessment of Banana at Jimma Town Market.
Postharvest Loss Assessment of Banana at Jimma Town Market.Postharvest Loss Assessment of Banana at Jimma Town Market.
Postharvest Loss Assessment of Banana at Jimma Town Market.
 
20170131 enhancing the fav seedling business models in ethiopia final report
20170131 enhancing the fav seedling business models in ethiopia final report20170131 enhancing the fav seedling business models in ethiopia final report
20170131 enhancing the fav seedling business models in ethiopia final report
 
International Journal of Sciences: Basic and Applied Research (IJSBAR)
International Journal of Sciences: Basic and Applied Research (IJSBAR)International Journal of Sciences: Basic and Applied Research (IJSBAR)
International Journal of Sciences: Basic and Applied Research (IJSBAR)
 
The Influence Of Socio-Economic Characteristics on Consumers’ Preference on F...
The Influence Of Socio-Economic Characteristics on Consumers’ Preference on F...The Influence Of Socio-Economic Characteristics on Consumers’ Preference on F...
The Influence Of Socio-Economic Characteristics on Consumers’ Preference on F...
 
8.wondimagegn mesfin 78 89
8.wondimagegn mesfin 78 898.wondimagegn mesfin 78 89
8.wondimagegn mesfin 78 89
 
Agricultural extension needs of farmers in telfaria production and marketing
Agricultural extension needs of farmers in telfaria production and marketingAgricultural extension needs of farmers in telfaria production and marketing
Agricultural extension needs of farmers in telfaria production and marketing
 
Profitability Analysis and Adoption of Improved Box Hive Technology by Small ...
Profitability Analysis and Adoption of Improved Box Hive Technology by Small ...Profitability Analysis and Adoption of Improved Box Hive Technology by Small ...
Profitability Analysis and Adoption of Improved Box Hive Technology by Small ...
 
Analysis of market participation by rice farmers in southern nigeria.
Analysis of market participation by rice farmers in southern nigeria.Analysis of market participation by rice farmers in southern nigeria.
Analysis of market participation by rice farmers in southern nigeria.
 
Adoption of Aquaculture Technologies among Fish Farmers in Oluyole Local Gove...
Adoption of Aquaculture Technologies among Fish Farmers in Oluyole Local Gove...Adoption of Aquaculture Technologies among Fish Farmers in Oluyole Local Gove...
Adoption of Aquaculture Technologies among Fish Farmers in Oluyole Local Gove...
 
Sustainable Agriculture and Food Security in Thailand: National Government Pe...
Sustainable Agriculture and Food Security in Thailand: National Government Pe...Sustainable Agriculture and Food Security in Thailand: National Government Pe...
Sustainable Agriculture and Food Security in Thailand: National Government Pe...
 
Value Chain Analysis of Banana in Mizan Aman Town of Benchi Maji Zone, Southw...
Value Chain Analysis of Banana in Mizan Aman Town of Benchi Maji Zone, Southw...Value Chain Analysis of Banana in Mizan Aman Town of Benchi Maji Zone, Southw...
Value Chain Analysis of Banana in Mizan Aman Town of Benchi Maji Zone, Southw...
 
Survey and Identification of Rice Diseases in South Gondar Zone, Amhara Regio...
Survey and Identification of Rice Diseases in South Gondar Zone, Amhara Regio...Survey and Identification of Rice Diseases in South Gondar Zone, Amhara Regio...
Survey and Identification of Rice Diseases in South Gondar Zone, Amhara Regio...
 
Postharvest loss assessment of commercial horticultural crops in south wollo,...
Postharvest loss assessment of commercial horticultural crops in south wollo,...Postharvest loss assessment of commercial horticultural crops in south wollo,...
Postharvest loss assessment of commercial horticultural crops in south wollo,...
 
Lecturers’ Perception on Agriculture Mechanization in Rivers State, Nigeria
Lecturers’ Perception on Agriculture Mechanization in Rivers State, NigeriaLecturers’ Perception on Agriculture Mechanization in Rivers State, Nigeria
Lecturers’ Perception on Agriculture Mechanization in Rivers State, Nigeria
 
IMPACTS OF FARMERS STORAGES
IMPACTS OF FARMERS STORAGESIMPACTS OF FARMERS STORAGES
IMPACTS OF FARMERS STORAGES
 
19th may(tuesday),2015 daily global rice e newsletter by riceplus magazine
19th may(tuesday),2015 daily global rice e newsletter by riceplus magazine19th may(tuesday),2015 daily global rice e newsletter by riceplus magazine
19th may(tuesday),2015 daily global rice e newsletter by riceplus magazine
 
Roadmap of EU Office, Myanmar Corn Farmers' Association
Roadmap of EU Office, Myanmar Corn Farmers' AssociationRoadmap of EU Office, Myanmar Corn Farmers' Association
Roadmap of EU Office, Myanmar Corn Farmers' Association
 
Farmers? Perceptions of Rain-Fed Wheat Production Constraints, Varietal Prefe...
Farmers? Perceptions of Rain-Fed Wheat Production Constraints, Varietal Prefe...Farmers? Perceptions of Rain-Fed Wheat Production Constraints, Varietal Prefe...
Farmers? Perceptions of Rain-Fed Wheat Production Constraints, Varietal Prefe...
 

Similar to Market Demand Analysis of Prawn and Milkfish for Cultivation Business development in Malaka Regency, West Timor-Indonesia

Contribution of aquaculture on livelihood development of fish farmer at Noakh...
Contribution of aquaculture on livelihood development of fish farmer at Noakh...Contribution of aquaculture on livelihood development of fish farmer at Noakh...
Contribution of aquaculture on livelihood development of fish farmer at Noakh...
AbdullaAlAsif1
 
Analysis of Fish Value Chain in Kebbi State, Nigeria
Analysis of Fish Value Chain in Kebbi State, NigeriaAnalysis of Fish Value Chain in Kebbi State, Nigeria
Analysis of Fish Value Chain in Kebbi State, Nigeria
BRNSSPublicationHubI
 
Tilapia (Oreochromis mossambicus) marketing system in greater Jessore region,...
Tilapia (Oreochromis mossambicus) marketing system in greater Jessore region,...Tilapia (Oreochromis mossambicus) marketing system in greater Jessore region,...
Tilapia (Oreochromis mossambicus) marketing system in greater Jessore region,...
AbdullaAlAsif1
 
C:\Documents And Settings\User\Desktop\Asean Traning\Vietnam Paper Mar A
C:\Documents And Settings\User\Desktop\Asean Traning\Vietnam Paper Mar AC:\Documents And Settings\User\Desktop\Asean Traning\Vietnam Paper Mar A
C:\Documents And Settings\User\Desktop\Asean Traning\Vietnam Paper Mar A
Ridzaludin
 
Vietnam Paper Mar A
Vietnam Paper Mar AVietnam Paper Mar A
Vietnam Paper Mar A
Ridzaludin
 
the gendered effects of climate variabilitychange on fisher livelihoods and t...
the gendered effects of climate variabilitychange on fisher livelihoods and t...the gendered effects of climate variabilitychange on fisher livelihoods and t...
the gendered effects of climate variabilitychange on fisher livelihoods and t...
ijtsrd
 
9_Trade & Poverty Link_Fisheries
9_Trade & Poverty Link_Fisheries9_Trade & Poverty Link_Fisheries
9_Trade & Poverty Link_Fisheries
Samsen Neak
 

Similar to Market Demand Analysis of Prawn and Milkfish for Cultivation Business development in Malaka Regency, West Timor-Indonesia (20)

Contribution of aquaculture on livelihood development of fish farmer at Noakh...
Contribution of aquaculture on livelihood development of fish farmer at Noakh...Contribution of aquaculture on livelihood development of fish farmer at Noakh...
Contribution of aquaculture on livelihood development of fish farmer at Noakh...
 
Lesson-7-final-aquaculture.docx
Lesson-7-final-aquaculture.docxLesson-7-final-aquaculture.docx
Lesson-7-final-aquaculture.docx
 
Regional Workshop on Underutilized Fish and Marine Genetic Resources (FMGR) a...
Regional Workshop on Underutilized Fish and Marine Genetic Resources (FMGR) a...Regional Workshop on Underutilized Fish and Marine Genetic Resources (FMGR) a...
Regional Workshop on Underutilized Fish and Marine Genetic Resources (FMGR) a...
 
Analysis of Fish Value Chain in Kebbi State, Nigeria
Analysis of Fish Value Chain in Kebbi State, NigeriaAnalysis of Fish Value Chain in Kebbi State, Nigeria
Analysis of Fish Value Chain in Kebbi State, Nigeria
 
Tilapia (Oreochromis mossambicus) marketing system in greater Jessore region,...
Tilapia (Oreochromis mossambicus) marketing system in greater Jessore region,...Tilapia (Oreochromis mossambicus) marketing system in greater Jessore region,...
Tilapia (Oreochromis mossambicus) marketing system in greater Jessore region,...
 
Regional Workshop on Underutilized Fish and Marine Genetic Resources (FMGR) a...
Regional Workshop on Underutilized Fish and Marine Genetic Resources (FMGR) a...Regional Workshop on Underutilized Fish and Marine Genetic Resources (FMGR) a...
Regional Workshop on Underutilized Fish and Marine Genetic Resources (FMGR) a...
 
EXPERT TOPIC 1401- SHRIMP
EXPERT TOPIC 1401- SHRIMPEXPERT TOPIC 1401- SHRIMP
EXPERT TOPIC 1401- SHRIMP
 
C:\Documents And Settings\User\Desktop\Asean Traning\Vietnam Paper Mar A
C:\Documents And Settings\User\Desktop\Asean Traning\Vietnam Paper Mar AC:\Documents And Settings\User\Desktop\Asean Traning\Vietnam Paper Mar A
C:\Documents And Settings\User\Desktop\Asean Traning\Vietnam Paper Mar A
 
Vietnam Paper Mar A
Vietnam Paper Mar AVietnam Paper Mar A
Vietnam Paper Mar A
 
the gendered effects of climate variabilitychange on fisher livelihoods and t...
the gendered effects of climate variabilitychange on fisher livelihoods and t...the gendered effects of climate variabilitychange on fisher livelihoods and t...
the gendered effects of climate variabilitychange on fisher livelihoods and t...
 
IRJET - Causes of Declining Rate of Prawn Production in Ponds
IRJET - Causes of Declining Rate of Prawn Production in PondsIRJET - Causes of Declining Rate of Prawn Production in Ponds
IRJET - Causes of Declining Rate of Prawn Production in Ponds
 
Role of aquculture in rural development..
Role of aquculture in rural development..Role of aquculture in rural development..
Role of aquculture in rural development..
 
Aquaculture Growth in Bangladesh:Enablers, Impacts, and the Path Ahead
Aquaculture Growth in Bangladesh:Enablers, Impacts, and the Path AheadAquaculture Growth in Bangladesh:Enablers, Impacts, and the Path Ahead
Aquaculture Growth in Bangladesh:Enablers, Impacts, and the Path Ahead
 
Dried fish sample
Dried fish sampleDried fish sample
Dried fish sample
 
Constraints and prospects of fish farming in Lalmonirhat district
Constraints and prospects of fish farming in Lalmonirhat districtConstraints and prospects of fish farming in Lalmonirhat district
Constraints and prospects of fish farming in Lalmonirhat district
 
Analysis and Information Needs for Fisheries Production with Freshwater Aquac...
Analysis and Information Needs for Fisheries Production with Freshwater Aquac...Analysis and Information Needs for Fisheries Production with Freshwater Aquac...
Analysis and Information Needs for Fisheries Production with Freshwater Aquac...
 
G0145458
G0145458G0145458
G0145458
 
Comparative analysis of fresh and smoked catfish marketing in ekiti and ondo ...
Comparative analysis of fresh and smoked catfish marketing in ekiti and ondo ...Comparative analysis of fresh and smoked catfish marketing in ekiti and ondo ...
Comparative analysis of fresh and smoked catfish marketing in ekiti and ondo ...
 
5 poster taiwo oludare
5  poster taiwo oludare5  poster taiwo oludare
5 poster taiwo oludare
 
9_Trade & Poverty Link_Fisheries
9_Trade & Poverty Link_Fisheries9_Trade & Poverty Link_Fisheries
9_Trade & Poverty Link_Fisheries
 

More from International Journal of Business Marketing and Management (IJBMM)

More from International Journal of Business Marketing and Management (IJBMM) (20)

Financial literacy of students at Thainguyen University of Technology - A lit...
Financial literacy of students at Thainguyen University of Technology - A lit...Financial literacy of students at Thainguyen University of Technology - A lit...
Financial literacy of students at Thainguyen University of Technology - A lit...
 
Study on the Nexuses between Supply Chain Information Technology Capabilities...
Study on the Nexuses between Supply Chain Information Technology Capabilities...Study on the Nexuses between Supply Chain Information Technology Capabilities...
Study on the Nexuses between Supply Chain Information Technology Capabilities...
 
Qualities required in founding team members for Startups in India
Qualities required in founding team members for Startups in IndiaQualities required in founding team members for Startups in India
Qualities required in founding team members for Startups in India
 
The Effect of "Buy Now, Pay Later" Mode on Impulsive Buying Behavior
The Effect of "Buy Now, Pay Later" Mode on Impulsive Buying BehaviorThe Effect of "Buy Now, Pay Later" Mode on Impulsive Buying Behavior
The Effect of "Buy Now, Pay Later" Mode on Impulsive Buying Behavior
 
Factors affecting Business Environment of Hai Phong City
Factors affecting Business Environment of Hai Phong CityFactors affecting Business Environment of Hai Phong City
Factors affecting Business Environment of Hai Phong City
 
Work Attitude, Innovation Ability and Innovation Performance of Employees in ...
Work Attitude, Innovation Ability and Innovation Performance of Employees in ...Work Attitude, Innovation Ability and Innovation Performance of Employees in ...
Work Attitude, Innovation Ability and Innovation Performance of Employees in ...
 
Evaluating Resilience in Commercial Airlines through Supply Chain Flexibility
Evaluating Resilience in Commercial Airlines through Supply Chain FlexibilityEvaluating Resilience in Commercial Airlines through Supply Chain Flexibility
Evaluating Resilience in Commercial Airlines through Supply Chain Flexibility
 
Characteristics and simulation analysis of nonlinear correlation coefficient ...
Characteristics and simulation analysis of nonlinear correlation coefficient ...Characteristics and simulation analysis of nonlinear correlation coefficient ...
Characteristics and simulation analysis of nonlinear correlation coefficient ...
 
The Influence Of Product Quality And Price On The Purchase Decision Of Kobba ...
The Influence Of Product Quality And Price On The Purchase Decision Of Kobba ...The Influence Of Product Quality And Price On The Purchase Decision Of Kobba ...
The Influence Of Product Quality And Price On The Purchase Decision Of Kobba ...
 
Mean-Distortion Risk Measure Portfolio Optimization under the Distribution Un...
Mean-Distortion Risk Measure Portfolio Optimization under the Distribution Un...Mean-Distortion Risk Measure Portfolio Optimization under the Distribution Un...
Mean-Distortion Risk Measure Portfolio Optimization under the Distribution Un...
 
A Conceptual Relationship between Microfinance and Poverty Reduction in Nigeria
A Conceptual Relationship between Microfinance and Poverty Reduction in NigeriaA Conceptual Relationship between Microfinance and Poverty Reduction in Nigeria
A Conceptual Relationship between Microfinance and Poverty Reduction in Nigeria
 
The Contribution of Entrepreneurship Ecosystem in Inculcating Entrepreneurial...
The Contribution of Entrepreneurship Ecosystem in Inculcating Entrepreneurial...The Contribution of Entrepreneurship Ecosystem in Inculcating Entrepreneurial...
The Contribution of Entrepreneurship Ecosystem in Inculcating Entrepreneurial...
 
Robust Optimal Reinsurance and Investment Problem with p-Thinning Dependent a...
Robust Optimal Reinsurance and Investment Problem with p-Thinning Dependent a...Robust Optimal Reinsurance and Investment Problem with p-Thinning Dependent a...
Robust Optimal Reinsurance and Investment Problem with p-Thinning Dependent a...
 
Antecedent of Sustainable Consumption Behavior: Purchase, Using and Disposing
Antecedent of Sustainable Consumption Behavior: Purchase, Using and DisposingAntecedent of Sustainable Consumption Behavior: Purchase, Using and Disposing
Antecedent of Sustainable Consumption Behavior: Purchase, Using and Disposing
 
Research on Credit Default Swaps Pricing Under Uncertainty in the Distributio...
Research on Credit Default Swaps Pricing Under Uncertainty in the Distributio...Research on Credit Default Swaps Pricing Under Uncertainty in the Distributio...
Research on Credit Default Swaps Pricing Under Uncertainty in the Distributio...
 
University Students Learning Styles During Covid-19
University Students Learning Styles During Covid-19University Students Learning Styles During Covid-19
University Students Learning Styles During Covid-19
 
Extending the Laundered Funds Destination Theory: Applying the Walker-Unger G...
Extending the Laundered Funds Destination Theory: Applying the Walker-Unger G...Extending the Laundered Funds Destination Theory: Applying the Walker-Unger G...
Extending the Laundered Funds Destination Theory: Applying the Walker-Unger G...
 
The current situation of developing human resource in industrial parks of Hai...
The current situation of developing human resource in industrial parks of Hai...The current situation of developing human resource in industrial parks of Hai...
The current situation of developing human resource in industrial parks of Hai...
 
Hybrid of Data Envelopment Analysis and Malmquist Productivity Index to evalu...
Hybrid of Data Envelopment Analysis and Malmquist Productivity Index to evalu...Hybrid of Data Envelopment Analysis and Malmquist Productivity Index to evalu...
Hybrid of Data Envelopment Analysis and Malmquist Productivity Index to evalu...
 
Social Media Usage Behavior of the Elderly: Case Study in Surat Thani Provinc...
Social Media Usage Behavior of the Elderly: Case Study in Surat Thani Provinc...Social Media Usage Behavior of the Elderly: Case Study in Surat Thani Provinc...
Social Media Usage Behavior of the Elderly: Case Study in Surat Thani Provinc...
 

Recently uploaded

Mastering Affiliate Marketing: A Comprehensive Guide to Success
Mastering Affiliate Marketing: A Comprehensive Guide to SuccessMastering Affiliate Marketing: A Comprehensive Guide to Success
Mastering Affiliate Marketing: A Comprehensive Guide to Success
Abdulsamad Lukman
 
INCOME TAXATION- CHAPTER 13-A ADDITIONAL CLAIMABLE COMPENSATION EXPENSE
INCOME TAXATION- CHAPTER 13-A ADDITIONAL CLAIMABLE COMPENSATION EXPENSEINCOME TAXATION- CHAPTER 13-A ADDITIONAL CLAIMABLE COMPENSATION EXPENSE
INCOME TAXATION- CHAPTER 13-A ADDITIONAL CLAIMABLE COMPENSATION EXPENSE
RicaAbellanosa
 
4 TRIK CARA MENGGUGURKAN JANIN ATAU ABORSI KANDUNGAN
4 TRIK CARA MENGGUGURKAN JANIN ATAU ABORSI KANDUNGAN4 TRIK CARA MENGGUGURKAN JANIN ATAU ABORSI KANDUNGAN
4 TRIK CARA MENGGUGURKAN JANIN ATAU ABORSI KANDUNGAN
Cara Menggugurkan Kandungan 087776558899
 
Top Abortion Clinic in Muscat +918761049707!!!!!!!!!!! Get Cytotec kit availa...
Top Abortion Clinic in Muscat +918761049707!!!!!!!!!!! Get Cytotec kit availa...Top Abortion Clinic in Muscat +918761049707!!!!!!!!!!! Get Cytotec kit availa...
Top Abortion Clinic in Muscat +918761049707!!!!!!!!!!! Get Cytotec kit availa...
ahmedjiabur940
 

Recently uploaded (20)

Meeting Koordinasi All Team Sales dan Marketing Departement
Meeting Koordinasi All Team Sales dan Marketing DepartementMeeting Koordinasi All Team Sales dan Marketing Departement
Meeting Koordinasi All Team Sales dan Marketing Departement
 
Micro-Choices, Max Impact Personalizing Your Journey, One Moment at a Time.pdf
Micro-Choices, Max Impact Personalizing Your Journey, One Moment at a Time.pdfMicro-Choices, Max Impact Personalizing Your Journey, One Moment at a Time.pdf
Micro-Choices, Max Impact Personalizing Your Journey, One Moment at a Time.pdf
 
TAM_AdEx-Cross_Media_Report-Banking_Finance_Investment_(BFSI)_2023.pdf
TAM_AdEx-Cross_Media_Report-Banking_Finance_Investment_(BFSI)_2023.pdfTAM_AdEx-Cross_Media_Report-Banking_Finance_Investment_(BFSI)_2023.pdf
TAM_AdEx-Cross_Media_Report-Banking_Finance_Investment_(BFSI)_2023.pdf
 
The 9th May Incident in Pakistan A Turning Point in History.pptx
The 9th May Incident in Pakistan A Turning Point in History.pptxThe 9th May Incident in Pakistan A Turning Point in History.pptx
The 9th May Incident in Pakistan A Turning Point in History.pptx
 
The seven principles of persuasion by Dr. Robert Cialdini
The seven principles of persuasion by Dr. Robert CialdiniThe seven principles of persuasion by Dr. Robert Cialdini
The seven principles of persuasion by Dr. Robert Cialdini
 
Discover Ardency Elite: Elevate Your Lifestyle
Discover Ardency Elite: Elevate Your LifestyleDiscover Ardency Elite: Elevate Your Lifestyle
Discover Ardency Elite: Elevate Your Lifestyle
 
The Art of sales from fictional characters.
The Art of sales from fictional characters.The Art of sales from fictional characters.
The Art of sales from fictional characters.
 
SALES-PITCH-an-introduction-to-sales.pptx
SALES-PITCH-an-introduction-to-sales.pptxSALES-PITCH-an-introduction-to-sales.pptx
SALES-PITCH-an-introduction-to-sales.pptx
 
Global Trends in Market Reserch & Insights - Ray Poynter - May 2023.pdf
Global Trends in Market Reserch & Insights - Ray Poynter - May 2023.pdfGlobal Trends in Market Reserch & Insights - Ray Poynter - May 2023.pdf
Global Trends in Market Reserch & Insights - Ray Poynter - May 2023.pdf
 
Iranian Strikes on Israel Assessing the Impact and Implications.pptx
Iranian Strikes on Israel  Assessing the Impact and Implications.pptxIranian Strikes on Israel  Assessing the Impact and Implications.pptx
Iranian Strikes on Israel Assessing the Impact and Implications.pptx
 
Optimizing Your Marketing with AI-Powered Prompts
Optimizing Your Marketing with AI-Powered PromptsOptimizing Your Marketing with AI-Powered Prompts
Optimizing Your Marketing with AI-Powered Prompts
 
Social Media Marketing Portfolio - Maharsh Benday
Social Media Marketing Portfolio - Maharsh BendaySocial Media Marketing Portfolio - Maharsh Benday
Social Media Marketing Portfolio - Maharsh Benday
 
Mastering Affiliate Marketing: A Comprehensive Guide to Success
Mastering Affiliate Marketing: A Comprehensive Guide to SuccessMastering Affiliate Marketing: A Comprehensive Guide to Success
Mastering Affiliate Marketing: A Comprehensive Guide to Success
 
The Essence of Mothers Celebrating the Heart of the Family.pptx
The Essence of Mothers Celebrating the Heart of the Family.pptxThe Essence of Mothers Celebrating the Heart of the Family.pptx
The Essence of Mothers Celebrating the Heart of the Family.pptx
 
ch05.ppt Strategies in marketing channel
ch05.ppt Strategies in marketing channelch05.ppt Strategies in marketing channel
ch05.ppt Strategies in marketing channel
 
INCOME TAXATION- CHAPTER 13-A ADDITIONAL CLAIMABLE COMPENSATION EXPENSE
INCOME TAXATION- CHAPTER 13-A ADDITIONAL CLAIMABLE COMPENSATION EXPENSEINCOME TAXATION- CHAPTER 13-A ADDITIONAL CLAIMABLE COMPENSATION EXPENSE
INCOME TAXATION- CHAPTER 13-A ADDITIONAL CLAIMABLE COMPENSATION EXPENSE
 
HOW TO HANDLE SALES OBJECTIONS | SELLING AND NEGOTIATION
HOW TO HANDLE SALES OBJECTIONS | SELLING AND NEGOTIATIONHOW TO HANDLE SALES OBJECTIONS | SELLING AND NEGOTIATION
HOW TO HANDLE SALES OBJECTIONS | SELLING AND NEGOTIATION
 
4 TRIK CARA MENGGUGURKAN JANIN ATAU ABORSI KANDUNGAN
4 TRIK CARA MENGGUGURKAN JANIN ATAU ABORSI KANDUNGAN4 TRIK CARA MENGGUGURKAN JANIN ATAU ABORSI KANDUNGAN
4 TRIK CARA MENGGUGURKAN JANIN ATAU ABORSI KANDUNGAN
 
Top Abortion Clinic in Muscat +918761049707!!!!!!!!!!! Get Cytotec kit availa...
Top Abortion Clinic in Muscat +918761049707!!!!!!!!!!! Get Cytotec kit availa...Top Abortion Clinic in Muscat +918761049707!!!!!!!!!!! Get Cytotec kit availa...
Top Abortion Clinic in Muscat +918761049707!!!!!!!!!!! Get Cytotec kit availa...
 
Taprank - Boost your Google reviews with personalized NFC cards
Taprank - Boost your Google reviews with personalized NFC cardsTaprank - Boost your Google reviews with personalized NFC cards
Taprank - Boost your Google reviews with personalized NFC cards
 

Market Demand Analysis of Prawn and Milkfish for Cultivation Business development in Malaka Regency, West Timor-Indonesia

  • 1. International Journal of Business Marketing and Management (IJBMM) Volume 3 Issue 3 March 2018, P.P. 34-45 ISSN: 2456-4559 www.ijbmm.com International Journal of Business Marketing and Management (IJBMM) Page 34 Market Demand Analysis of Prawn and Milkfish for Cultivation Business development in Malaka Regency, West Timor-Indonesia By: Franchy Ch. Liufeto1,2* , Nuddin Harahab3 , ArningWilujeng Ekawati3 , Soemarno4 1 Doctoral Program of Fisheries and Marine Science, Faculty of Fisheries and Marine Science, University of Brawijaya, Malang, Indonesia 2 Faculty of Fisheries and Marine Science, University of Nusa Cendana, Kupang-East Nusa Tenggara, Indonesia 3 Faculty of Fisheries and Marine Science, University of Brawijaya, Malang, Indonesia 4 Faculty of Agriculture, University of Brawijaya, Malang, Indonesia Abstract: This research was conducted to find out the market demand of prawnandmilkfish in West Timor and East Timor/Timor-Leste. The West Timor market demand survey was organized by involving 28 fish merchants/seafood restaurant managers which were spread across 6 cities in West Timor. Furthermore, the demand in East Timor was based on fish trade flows data at the Indonesia - Timor-Leste border post. The matrix tabulation method was employed for calculating the milkfish and prawn consumption per capita population of Timor-Leste, and the projection of milkfish and prawn demand in Timor-Leste region in the year of 2014-2025 which was based on the projected population growth of Timor region. The results indicated that prawn demand was spread within 6 urban markets in the region of Timor. Meanwhile, milkfish was highly demanded in the local market. East Timor's prawn market demand forecast in the year of 2014-2025 reached 1,359.87 tons. Milkfish demand on the local market was up to 1,274.45 tons. The number of prawn demand was much higher than the production at local level. Therefore, prawn could be considered as the main commodity choice for the development of aquaculture in Malaka. Keywords: Market demand, milkfish, prawn, aquaculture development I. INTRODUCTION Malaka Regency is one of the new autonomous regions in East Nusa Tenggara Province (NTT), which has direct borders with the Democratic Republic of Timor-Leste (RDTL) and Australia. Based on the written law number 43 in 2008, this area is responsible for conducting a socio-economic development for the welfare of its territory. To achieve this goal, the aquaculture sector is one of many sectors that can be developed, especially brackish water ponds (BPS NTT, 2013, BPP NTT, 2011, DKP Belu, 2012, Widiati, 2007; ATSEF, 2006 and Liufeto, 2006). The effort to develop aquaculture in Malaka requires considerable attention due to the existence of various obstacles such as the low ability of human resources and technology in cultivation, as well as the limited market information related to market opportunity and the commodity information required by market. This condition should not be allowed since the development of prawn farming can support the growth and economic development of border areas, as stated by Nugroho and Dahuri (2012), Bappenas (2011); FAO (2006a); FAO (2006b); FAO (2004); FAO (2003); Barbier and Cox (2002); Tacon and Foster (2001) Forster (2000); Francisco (2007); Dey et al. (2003), and Okorie (2003). Cultivation can support the economic development of the border area because it can possibly become the backbone of the world's demand for seafood. Furthermore, it may also contribute in increasing public income and international trade for the welfare of the community.
  • 2. Market Demand Analysis of Prawn and Milkfish for Cultivation Business development in Malaka…. International Journal of Business Marketing and Management (IJBMM) Page 35 II. LITERATURE REVIEW 2.1 Fishpond Cultivation Fishpond is artificial pond-shaped wetland containing brackish water or seawater in coastal areas which is used to cultivate brackish water animals (Wibowo.et al., 1996). According to the Directorate General of Cultivation (2002), aquaculture is the raising activity and growing aquatic biota in fresh/brackish water pond within a certain period of time. It employs harvesting to get the results. According to Anderson (2007), Francisco (2007) and Nash (1995), an important step in the development of cultivation is to identify species that meets the market demand. Leung et al. (2007) stated that in a cultivation development effort, the following economic aspects are important to be part of consideration, such as: the selection of species with a potentially strong market demand; the selection of species with strong domestic and export markets; the production of the species at a logical cost. 2.2 Cultivation Development The factors affecting the development of cultivation are composed of internal factor and external factor. First, the internal factors include species selection and cultivation system. Second, the external factors deal with environmental factors (physical, chemical, biological), social factors and market demand for certain species at local, regional and national as well as international levels (Nash 1995). Anderson (2007) mentioned that the phenomenon that arises in Asia as the leader of fish producers in the world is shown by the growth of fish production in Asia. The growth of the cultivation sector is accelerating in some countries (China, Thailand, and Malaysia) due to the abundance of aquatic environment and the rapid absorption of new cultivation technology. The fish demand and the presence of infrastructure and institutions in each country also contribute to the realization of potential cultivation in a particular region. The results of Tajerin and Mohammad's (2004) research indicate that the developed and newly industrialized countries such as South Korea, Taiwan, Hong Kong-China and Singapore can become a strong economic country due to the tight competition of fish exports. According to Barbier and Cox (2002), prawn exports significantly increase foreign exchange number for the countries that produce it. Ahmed et al. (2004), Garcia et al., (2004), and Huang et al., (2004) explained that 54% of the total cultivation production in some Asian countries is contributed from freshwater cultivation which is followed by 24% of brackish water cultivation and last, the sea cultivation that reaches 22%. Nash (1995) divides the cultivation system into 3 basic systems categorizations when he considers the intensity of production. They are extensive, semi intensive and intensive system. According to Boers (2001), an intensive prawn pond can provide a high production of prawn with shorter operational time than the extensive traditional pond cultivation. The criteria and technology applied in prawn culture can be seen in Table 2. Table 2. Prawn Cultivation Criteria and Technology Criteria Cultivation Technology Intensive Semi Intensive Traditional Feed Complete formula feed Natural and additional feed Natural Water Management Pumps and aerations Tidal and pump Tidal Solid Distribution (tail / ha / Planting Season) 150,000-500,000 15,000 -150,000 1000-15,000 The size of the pond plot (ha) 0.1-1 1-5 3-20 Production (ton / Planting Season) 2-20 0.5-5 0.1-0.5 Length of Farming (month) 3-4 3-4 4-6 The Impact of Cultivation Very high Moderate – high Insignificant Source : CP Prima (2002) 2.3 Market Demand towards Aquaculture Commodity The study of fish demand conducted in 9 Asian countries by World Fish Center from 2001-2004 (M.M. Dey and Garcia, unpublished report) reported that fish as a source of animal protein, constitutes 13% of total household expenditure after meat. In general, fish consumption in urban areas is found to be higher than in rural
  • 3. Market Demand Analysis of Prawn and Milkfish for Cultivation Business development in Malaka…. International Journal of Business Marketing and Management (IJBMM) Page 36 areas. Fish buying expenses are higher within households that have higher incomes than those who have lower incomes, with an average of 15% and 13%. According to Dey et al., (2003), one of the perks of the cultivation sector in Asia is the export orientation. According to Ahmed et al., (2003) countries that acquire food deficits such as Vietnam, Indonesia, Thailand and Malaysia contribute more than 20% to the total amount of fish trade. In these countries, fish exports are equivalent to approximately 42% of their food imports. Theoretically, demand is derived from the consumption theory in which consumers want to ask for an item at a certain price because it is considered to be useful for them (Hanafie, 2010). The growth of cultivation sector within a state will remain constrained if the market is limited only at local level, mainly because it has little economic importance. On the other hand, the demand at regional, national and export levels stand for a much greater risk since it has to be able to maintain the stability of the volume of products sold. The producer's choice at this level can be in form of: producer cooperation, producer organization, or owners of core companies are forming an integrated company. III. RESEARCH METHOD This research belonged to explanatory research by utilizing survey method in which the survey was essentially a method to find out about what was happening in people's life specifically and realistically. Survey research method according widi(2010) was a research effort by collecting information or data through interview or questionnaire. 3.1Data Collection This research belonged to explanatory research by utilizing survey method in which the survey was essentially a method to find out about what was happening in people's life specifically and realistically. Widi’s survey research method (2010) wan order to get an idea of the market demand for milkfish and prawn, market demand survey was conducted in seafood restaurants and fish and prawn collectors in East Timor's urban markets which were spread across Kupang, Soe, Kefa, Atambua, and Malaka. Meanwhile the milkfish and prawn data entered East Timor was collected from East Nusa Tenggara Fish Quarantine Station and Fish Quarantine Station data located at Motaain and Belu; the border between East Nusa Tenggara -East Timor. The secondary data used in this research were as follows: (a) the trading flow of fishery commodities especially prawn and milkfish to East Timor for the last 4 years; (b) the data of prawn catching production in Malaka and Kupang Regency as the production areas of Timorese land prawn, and (c) the population of Timorese land for the last 5 years from various related institutions namely: the Office of Marine and Fisheries of Malaka, the Office of Marine and Fisheries of Belu, Belu and MalakaCentral Statistics Agency, Central Statistics Agency of East Nusa Tenggara Province, last the East Kalimantan Fish Quarantine Agencyand Border. The data of stakeholder support towards the development of aquaculture was carried out by conducting a stakeholder perception survey toward the cultivators, fishermen, collectors, bureaucrats and legislators, religious figures and community leaders in Malaka as well as those who were following the history of aquaculture activities in Malaka. Those respondents were asked to fill in the questioner data on cultivation development that also covered the level of education; the hope of cultivation development; the enforcement of rules in aquaculture; the role of aquaculture ponds; stakeholders’ support toward the cultivation and safety of aquaculture products; the environmental concerns; market and consumer demand; the sustainable cultivation development; the comparative advantage of aquaculture in Indonesia with the neighboring counties, such as East Timor and Australia. Thenumbers ofrespondents involved in this survey were 71 people. Data collection based on the questionnaire was done by performing in depth interview. Furthermore, field observation was applied to control the truth of data information. Selection of respondents was conducted for those who were considered to be really understood and deeply involved in conducting pond farming. The number of total respondents for cultivators / fishermen reached up to at least 20% of the total cultivators in Wewiku. Then, the sub-district community leaders, educators, regional leaders, and religious leaders from each region were selected only one person who had adequate competencies such as experience, reputation, position, and cultivation development knowledge. 3.2 Data Analysis The analyses of Timor-Leste region’s market demand for prawn and milkfish were including the amount of sold prawn and milkfish demand in Timor-Leste market through the utilization of data analysis and cross tabulation. Meanwhile, the projection of market demand for prawn and milkfish was calculated based on the projected population growth in the territory of Timor Region within the period of 2014-2025. The analysis of minimum demand of West Timor market for prawn and milkfish was calculated based on the market demand survey of milkfish and prawn at seafood restaurants and markets which were spread across five urban areas of Kupang, Soe, Kefa, Atambua and Malaka located at mainland West Timor. Next, the supporting data on the number of milkfish and prawn traded to Timor Leste (from year 0f 2010 – 2014) was received from the Fish Quarantine Post at the Motaain Border.
  • 4. Market Demand Analysis of Prawn and Milkfish for Cultivation Business development in Malaka…. International Journal of Business Marketing and Management (IJBMM) Page 37 The projection of East Timor market demand for milkfish and prawn was carried out through the following steps: describing milkfish and prawn production data from 2008-2013 in West Timor; calculating the possibility of milkfish and prawn demand in West Timor with the data supporting of milkfish and prawn trade flows to East Timor during 2010 -2014; predicting the rate of milkfish consumption and prawn per capita; and forecasting the demand of milkfish and prawn market for the year of 2014-2025 based on projected population growth of Timor region with geometric population growth rate calculation Pt = Po (1 + r) t . IV. RESULT AND ANALYSIS 4.1 Real Demand and Prawn Production in Malaka A market demand survey was conducted for 28 seafood restaurants, and prawn and fish sellers in the urban market which were spread across the mainland of Timor. The data are presented as in Table 1. Table 1. The Demand Overview of West Timor and East Timor Regional Market in 2014 Location Fulfilled Demand (ton) Prawn Milkfish Kupang 9.144 - SoE 0.72 - Kefa 1.56 - Atambua 36.127 - Malaka 9 576.8 Timor Leste 1.132 0.563 Total Demand 57.683 Average Production Per Year 52 577.5 Lack of natural production (tons) 5.68 - Table 1 showed that prawn demand in West Timor land reached 57.68 tons or 98% of the total market demand for prawn market. It consisted of the region of Timor up to East Timor. Meanwhile, there was no demand for milkfish in the restaurant or the Timorese mainland market. These results indicated that prawn demand was stronger and more prevalent in cities in West Timor than the milkfish demand that was indicated only by the local market of Malaka as a producer of milkfish cultivation. The results of interviews with the managers of seafood restaurants and sellers of prawn and fish marketed informed that the amount of natural prawn production was very limited between July-December, while the needs and consumer demand tend to be stable for each week of every month with the price reached IDR 100,000, - per kg. Referring to the above assumptions, the minimum demand for prawn in the market of the Timor region for one year was calculated 2 times of the fulfilled prawn demand, which was about 115.37 tons of prawn per year. The production data in Table 2 displayed the total average of milkfish production in 2014 was 577.5 tons. The demand for milkfish in Malaka local market was 0.998 times of the average milkfish production in Malaka. Prawn production in Malaka was 52 tons / year, while the demand met for the Timorese market within one year was 115.37 tons. The figure represented 2.21 times of the average prawn production from Malaka. The number of prawn and milkfish production in Malaka Regency can be seen in Table 2 and Figure 1.
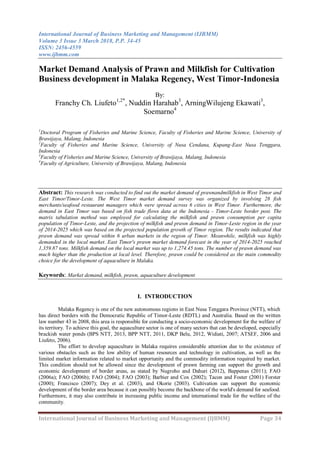
  • 5. Market Demand Analysis of Prawn and Milkfish for Cultivation Business development in Malaka…. International Journal of Business Marketing and Management (IJBMM) Page 38 Table 2. Prawn and Milkfish Production from Malaka Regency in 2008-2013 Year White Prawn (ton) Giant Tiger Prawn (ton) Number of Prawn (ton) Total Capture Production (ton) Milkfish (ton) Total Cultivation Production (ton) 2008 72.5 11.8 84.3 1592.7 345.1 353.7 2009 36 4.3 40.3 1762 350.3 627 2010 30.4 4.5 34.9 1845 627 654 2011 44.9 5.1 49.9 2580.3 626.5 644.2 2012 45.8 5.2 50.9 1914.2 722 766.8 2013 46.7 5.3 52 1952.5 794 832.2 Total 340.4 117.4 312.3 11646.6 3464.8 3877.9 Max 72.5 60.5 84.3 2580.3 794 832.2 Min 21.9 4.3 34.9 1592.7 345.1 353.7 Mean 41.8 13.5 52 1941.1 577.5 646.3 Standard Deviation 14.5 2.9 17.2 338.2 188.8 164.4 % Production 2.2 0.7 89.3 Source : BPS Belu (2008-2013); BPS Malaka (2014) Figure 1. Prawn and Milkfish Production in Malaka in 2008-2013 4.2 The Milkfish and Prawn Trade Flow to East Timor during 2010-2014 The data on trade flows of prawns and milkfish to Timor-Leste during 2010-2014 exhibited that the average of prawn and milkfish supply decreased by 0.03% and 0.001% per year respectively. Although the supply of milkfish and prawn to Timor-Leste had been decreasing, in Table 3 and Figure 2, it was also disclosed the amount of prawn trade to Timor- Leste which was much greater than the number of milkfish trade. 0 100 200 300 400 500 600 700 800 900 2008 2009 2010 2011 2012 2013 Ton Year Milk Fish White Prawn Giant Tiger Prawn
  • 6. Market Demand Analysis of Prawn and Milkfish for Cultivation Business development in Malaka…. International Journal of Business Marketing and Management (IJBMM) Page 39 Table 3. Trade Flows Data of Prawns and Milkfish Trade to Timor-Leste Year Milkfish (ton) Prawn (ton) Milkfish Expansion (%) Prawn Expansion (%) 2010 1.548 17.262 0 0 2011 3.157 10.727 -0.065 0.016 2012 1.205 10.521 -0.002 -0.001 2013 1.377 2.261 -0.082 0.001 2014 0,.563 1.132 -0.011 0.008 Total 7.85 41.903 Average 1.57 8.381 -0.0322 -0.001 Source: Fish Quarantine Center Motaain (2015) Figure 2. Graph of Milkfish and Prawn Supply to Timor-Leste 4.3 The Prediction of Milkfish and Prawn Demand through the Timor’s Population Projection The data of milkfish and shrimp trade flows to Timor-Leste from the Border Fish Quarantine Post in Motaain revealed that the origin of shrimp traded to Timor-Leste was not solely from Malaka but also from Kupang Regency as one of the shrimp producers in the region of Timor. Based on this information, the projection of shrimp demand in the territory of Timor Region was completed by calculating the production of white shrimp and tiger shrimp originating from Kupang and Malaka Regency, as shown in Table 4 below. Table 4. Giant Tiger Prawn and White Prawn Production from KupangandMalakaduring 2008-2013 Year Giant Tiger Prawn White Prawn Kupang Malaka Kupang Malaka 2008 1.75 11.82 59.8 72.45 2009 1.75 4.3 59.8 35.99 2010 1.85 4.45 61.74 30.43 2011 1.63 5.06 53.31 44.86 0 2 4 6 8 10 12 14 16 18 20 2010 2011 2012 2013 2014 Ton Year Milk Fish Prawn
  • 7. Market Demand Analysis of Prawn and Milkfish for Cultivation Business development in Malaka…. International Journal of Business Marketing and Management (IJBMM) Page 40 2012 1.54 5.16 50.62 45.76 2013 0.36 5.28 1 46.69 Production Growth Rate (%) 0.041 0.089 0.003 0.129 Source: BPS KupangdanBelu (2009-2014) The calculation of projected white prawn and giant tiger prawn production in 2014-2025 was based on development data of giant tiger prawn and white prawn production from Kupang and Malaka Regency as shown in Table 4. The results of the calculations are presented in Table 5 and 6. Table 5. Projection of Giant Tiger Prawn Production in Kupang and Malaka for Year 2014 - 2025 Regency Average Production Production Growth Rate of Giant Tiger Prawn Year of Projection (ton) Year 2013 (ton) 2014 2015 2016 2017 2018 2019 2020 2025 Kupang 1.48 0.041 1.421 1.364 1.309 1.257 1.207 1.158 1.112 0.907 Malaka 6.01 0.089 5.475 4.988 4.544 4.140 3.771 3.435 3.130 1.964 Total 7.49 6.896 6.352 5.853 5.397 4.978 4.594 4.242 2.871 Source : Kupang and Malaka Regency in Numbers (2009-2014) (processed data) Notes : Calculation of Prawn Production Projection was from: Base Year Production 2013 * (1 – growth rate) Table 6. Projection of White Prawn Production in Kupang and Malaka for Year 2014 - 2025 Regency Average Production Production Growth Rate of White Prawn Year of Projection (ton) Year 2013 (ton) 2014 2015 2016 2017 2018 2019 2020 2025 Kupang 47.71 0.003 47.57 47.42 47.28 47.14 47.00 46.86 46.72 46.02 Malaka 47.38 0.129 41.22 35.86 31.20 27.14 23.62 20.55 17.87 5.10 Total 95.09 0.13 88.79 83.29 78.48 74.28 70.61 67.40 64.59 51.12 Source : Kupang and Malaka Regency in Numbers (2009-2014) (processed data) Notes : Calculation of Prawn Production Projection was from: Base Year Production 2013 * (1 – growth rate) The projected number of white prawn and giant tiger prawn production from Kupang and Malaka in 2013-2025 is presented in Table 7. Table 7. Projection of Prawn Production (White and Giant Tiger) in Kupang and Malaka Year 2014 - 2025 Year Data 2013 2014 2015 2016 2017 2018 2019 2020 2025 Prawn Production (ton) 102.58 95.68 89.64 84.34 79.68 75.59 72.00 68.83 54.00 The prediction of market demand for milkfish and prawn during the year of 2014-2025 was based on the calculation of prawn and milkfish per capita numbers multiplied by population of Timor region. To calculate the population growth of Timor region, the projected population growth of Timor region was based on the geometric population growth formula Pt = Po (1 + r) t with the basic data of Timor’s region population year of 2009-2013 as presented in Table 8.
  • 8. Market Demand Analysis of Prawn and Milkfish for Cultivation Business development in Malaka…. International Journal of Business Marketing and Management (IJBMM) Page 41 Table 8. Average of East Region Population Growth Rate in 2009-2013 Total Population Year Kupang City Kupang TTS TTU Belu/Malaka 2009 291.749 297.402 435.039 227.147 382.375 2010 336.239 304.548 441.155 229.803 354.676 2011 342.892 310.573 448.693 232.051 357.650 2012 365.348 321.384 449.881 234.645 362.610 2013 378.425 328.688 451.922 240.686 374.381 Population Growth Rate 0.324 0.276 0.260 0.265 0.245 Average 0.274 Source: Statistics Indonesia of East Nusa Tenggara, 2010-2014 The calculation of the average rate of prawn consumption per capita population of the West Timor region was achieved by determining in advance the amount of prawn demanded by the West Timor region market. In this case, the average natural prawn production in 2014 which was 95.68 tons / year minus the average of trade flowof prawn to Timor Leste of 8.381 ton / year so that the average of prawn demand reached by population of West Timor region was 87,299 ton. The rate of prawn consumption per capita of West Timor population was made by dividing the fulfilled prawn demand (for 6 months natural prawn production) in 2014. It meant that 87.299 tons divided by population of East Timor region in 2013 which was 1,774,102 people so that the average prawn consumption rate of West Timor was 0.0492 kg / capita / 6 months. Meanwhile, the number of prawn trade flows to East Timor was calculated at 8.381 tons. Then, the number would be divided by the total population of East Timor in 2013 which was 1.17 million so that the demand for prawn to Timor-Leste from NTT met 0.00071 kg / capita / 6 months. In order to obtain a description of prawn demand in the region of Timor for 1 year, the calculation of prawn demand per capita for 6 months was multiplied by the number of prawn demand for the region for a year (2.21 tons). The number was obtained from the sharing number of prawn demand in 2014 (115.37 tons) that later on would be divided with the average production of Malaka’s prawn (52 tons). This consideration took place due to the dominant existence of Malaka’s prawn than the Kupang’s Prawn on the market. Table 9 presented the projection of population growth; the prediction of prawn needs; and the probability of the prawn number that could be cultivated. Table 9. Projection of Prawn Demand based on the Numbers of Regional and Timor Population Projection Base Year 2013 Year 2014 2015 2016 2017 2018 2019 2020 2025 Regional Citizen (inhabitant) 1,774,102 2,255,666.05 2,864,695.884 3,638,163.772 4,620,467.99 5,867,994.348 7,452,352.822 9,464,488.084 31,269,125.36 Fulfilled prawn demand (kg) 87029.64 110527.64 140370.10 178270.02 226402.93 287531.72 365165.29 463759.92 1657263.64 Prawn demand in 6 months (ton) 87.03 110.53 140.37 178.27 226.40 287.53 365.17 463.76 1657.26 Prawn demand in 1 year (ton) 191.47 243.16 308.81 392.19 498.09 632.57 803.36 1020.27 3645.98 Timor-Leste Citizen (inhabitant) 1172390.00 1206389.31 1241374.60 1277374.46 1314418.32 1352536.45 1391760.01 1432121.05 1652177.12 Timor-Leste demand (kg) 8323.97 8565.36 8813.76 9069.36 9332.37 9603.01 9881.50 10168.06 11730.46 Prawn demand in 6 months (ton) 8.32 8.57 8.81 9.07 9.33 9.60 9.88 10.17 11.73 Prawn demand in 1 year (ton) 18.31 18.84 19.39 19.95 20.53 21.13 21.74 22.37 25.81 Regional demand and Timor-Leste (6 months) 95.35 119.09 149.18 187.34 235.74 297.13 375.05 473.93 1668.99
  • 9. Market Demand Analysis of Prawn and Milkfish for Cultivation Business development in Malaka…. International Journal of Business Marketing and Management (IJBMM) Page 42 Regional demand and Timor-Leste (1 year) 209.78 262.00 328.20 412.15 518.62 653.70 825.10 1042.64 3671.79 Prawn production (ton) 102.58 95.68 89.63 84.33 79.68 75.59 71.99 68.83 53.99 Production shortage (ton/6 months) 7.23 23.41 59.55 103.01 156.06 221.54 303.06 405.10 1615.00 Production shortage (ton/year) 107.20 166.32 238.57 327.82 438.94 578.11 753.11 973.81 3617.80 Notes: *1). Projection of Regional Citizens = Citizens in Base Year 2013 * (1+0.27)n *2). Prawn Demand from TB Region= Prawn consumption average 0.0492* citizen (inhabitant) *3). Prawn Demand from Timor-Leste = Prawn consumption average 0.039* Timor-Leste citizens *4). 1 year demand= 2.2 x demand for 6 months *5) Production shortage = Demand – nature production Based on data from Table 9 above, the recapitulation of demand and prawn production opportunities was shown in Table 10 below. Table 10. Prediction of Prawn Demand from Regional and Timor-Leste in 2013 - 2025 Year Prawn Demand (ton) Total Demand(ton) Nature Supply (ton) Production Shortage (ton) Regional Timor- Leste 2013 191.46 18.31 209.77 102.58 107.19 2014 243.16 18.84 262 95.68 166.32 2015 308.82 19.39 328.21 89.63 238.58 2016 392.19 19.95 412.14 84.33 327.81 2017 498.09 20.53 518.62 79.68 438.94 2018 632.57 21.13 653.7 75.59 578.11 2019 803.36 21.74 825.1 71.99 753.11 2020 1020.27 22.37 1042.64 68.83 973.81 2025 3645.98 25.81 3671.79 53.99 361.8 Meanwhile, the projection of milkfish production in Malaka regency was obtained by calculating the average growth of milkfish production in Malaka over the period of 5 years from 2008-2013 as in Table 11. Table 11. Milkfish Production and Production Average in Malaka during 2008-2013 Year Total Production Production Increase (ton) Milkfish Cultivation 2008 345.05 353.73 0 2009 350.25 627 5.2 2010 627 654 276.75 2011 626.5 644.2 -0.5 2012 722 766.81 95.5 2013 794 832.2 72 Total 3464.800 3877.940 448.950 Mean 577.467 646.323 64.136 Standard Deviation 188.828 164.387 107.070 Average of Increase (%) 0.111
  • 10. Market Demand Analysis of Prawn and Milkfish for Cultivation Business development in Malaka…. International Journal of Business Marketing and Management (IJBMM) Page 43 Table 12 depicted the average of milkfish export increase to Timor Leste based on the trading growth rate. Table 12. Average of Milkfish Export Value from East Nusa to Timor-Leste in 2010-2014 Year Average of Milkfish Export (Ton) Production Increase 2010 1.548 0 2011 3.157 1.609 2012 1.205 -1.952 2013 1.377 0.172 2014 5.749 4.372 Mean 2.6072 0. 8402 Production (%) 0.00145 The production and demand for milkfish based on the projected population growth of Malaka was presented in table 13 below by looking at local milkfish demand with milkfish production growth rate that reached 0.111% and also the milkfish trade rate to Timor-Leste (0.8402%). Table 13. Average Prediction of Milkfish Production in Malaka Year 2015 - 2035 Demand Projection / Year 2013 2014 2015 2016 2017 2018 2019 2020 2025 Milkfish Production (ton) 577.5 641.6 712.8 791.9 879.8 977.5 1086 1206.5 2042.2 Export Demand (ton) 2.6072 2.611 2.6148 2.6186 2.6224 2.6262 2.63 2.6338 2.6529 Demand from Malaka (version 1) (ton) 575.0 639.0 710.0 789.0 877.0 975.0 1083.0 1204.0 2040.0 Malaka Citizens 171079.0 173033.0 175009.0 177007.0 179029.0 181073.0 183141.0 198293.0 209877.0 Prediction of Milkfish Demand based on Population (Kg) 577460.1 584055.6 590725.4 597469.4 604294.5 611193.8 618174.1 669318.2 789960.2 Prediction of Milkfish Demand based on Population (ton) 577.5 584.1 590.7 597.5 604.3 611.2 618.2 669.3 790.0 Local Demand from MalakaCitizens (version 2) 574.9 581.4 588.1 594.9 601.7 608.6 615.5 666.7 787.3 Notes: Milkfish Production = Average of production increase 0.111 x milkfish production in 2013 Average of Milkfish Export = 0.00145 * milkfish production in 2013 Local Consumption Version 1 = Milkfish Production – Export Average Malaka Citizens = base year of 2013 was 171,079 with growth rate by 0.01142/year Prediction of Milkfish Demand = Average of Milkfish Consumption from Malaka (3.375 kg/capita/year) x total population Local Consumption Version 2 = Demand Prediction based on Population – average of export The factual information regarding prawns and milkfish demand in the region of Timor has not existed yet, so this data is expected to be able to provide preliminary information in seeking the priority opportunities in the development of aquaculture fishpond especially for prawn and milkfish commodities in Malaka. Diana (2009) said that population growth and increasing individual consumption rate indicate that seafood products are gradually becoming more important than just as an additional food source. It is in relation to what Zainal et al.(2017), FAO (2006) has shown that world seafood demand is projected to be multiplied. It is due to the drive of population growth, intense urbanization (often associated with increasing number of animal’s protein consumption) and rising incomes. The fact revealed that milkfish demand which was only favored in Malaka’s local market was not significant. It was only IDR 30,000 / kg with a small risk because not all commodities were harvested at the same time and yet harvesting was not organized at any time. On the other hand, prawns create an opportunity to be developed as a leading commodity for the development of aquaculture in Malaka since it has high selling
  • 11. Market Demand Analysis of Prawn and Milkfish for Cultivation Business development in Malaka…. International Journal of Business Marketing and Management (IJBMM) Page 44 value with high demand rate dispersed across all regency cities in the Timor region. Nash (1995) explained that in remote rural areas, the structure of product marketing is often very traditional and the farmers simply adapt to existing local market systems by providing cheap fish to keep them available to local people with low purchasing power. This situation can still be found in Malaka in which milkfish marketing only meets the local market need and sometimes, the trading process even employs barter system. Furthermore, Nash (1995) said that the cultivation development in a region or country will always be limited if its development is constrained to local level with little economic interest. To meet the needs of the regional market, all cultivated organisms must be harvested at the same time, for immediate processing and sale. Consumers are centrally located in larger urban centers or into institutional markets with large volumes of potentially feasible products. Consumers in this market have more purchasing power and demand more choices, so the consequence is the cultivators should be able to produce products with additional value and to provide a variety of species according to local technical skills and environmental resources. Leung et al. (2007) explained that the economic aspect required to be considered in the development of cultivation is to select the correct species. It should have large market potentials with strong demand in the available market segments. It is expected also on the following aspects: financially feasible to be cultivated; having potential domestic and export markets; open to an opportunity of a value-added product; having a high selling price; and can be produced at a logical cost. FAO (2006) assures that many policies aimed at the employment of cultivation in the role of improving food security, in addition to the concentration and attention to bring in foreign exchange and encourage economic growth. Moreover, Anderson (2007) also implies that the development of sustainable cultivation is also an economical sustainable cultivation. The other type of sustain abilities, such as socio-political sustainability and environmental sustainability, will not be relevant if there is no economic sustainability. According to FAO (2010), the forces that drive prawn cultivation are: the limited and unstable of natural prawn production; the value of profits from prawn farming; and the high demand of prawn in global markets. Next, the international trade in fishery products in most developing countries aims to promote economic growth and poverty alleviation (Diana, 2009). According to Rivera-Ferre (2009) prawn is the most widely traded seafood products in the international market. In 2008, prawn farming is ranked 2nd in the world for production value category and is placed as 4th for the worldwide production number (FAO, 2010b). V. CONCLUSION Market demand of prawn and milkfish in West Timor and East Timor/Timor-Leste has been predicted very high.The results indicated that prawn demand was spread within 6 urban markets in the region of Timor. Meanwhile, milkfish was highly demanded in the local market. East Timor's prawn market demand forecast in the year of 2014-2025 reached 1,359.87 tons. Milkfish demand on the local market was up to 1,274.45 tons. The number of prawn demand was much higher than the production at local level. Therefore, prawn could be considered as the main commodity choice for the development of aquaculture in Malaka. REFERENCES [1] Abidin, Z. NuddinHarahab, Boimin. (2017). Analysis of Marketing Mix on Purchase Decision of Softboned-Milkfish “Mrs. 30 Jeni” in Malang City of East Java. ECSOFiM: Economic and Social of Fisheries and Marine Journal. Vol.5 (1): 30-41 Available online at http://ecsofim.ub.ac.id/ [2] Ahmed M., M.A.Rab., M.M. Dey,2003. Changing structure on fish supplydemand and trade in developing countries inMahffuzudin Ahmed, Madan M. Dey., Yolanda Garcia, 2007. The role of species and growth of aquaculture in Asia : Need and prospect In Leung et al.,., 2007. Species and system selection for sustainable aquaculture, Blacwell Publishing IOWA USA. [3] Ahmed M., M.M. Hossain, N.M Humayun., M.B Hossain., M.S Haque., R.K Talukder., dan S. Alam, 2004. Final country report :Bhangladesh. Strategies and options for increasing and sustaining fisheries and aquaculture production to benefit poor household in Asia. Project inMahffuzudin Ahmed, Madan M. Dey., Yolanda Garcia, 2007. The role of species and growth of aquaculture in Asia : Need and prospect In Leung et al.,., 2007. Species and system selection for sustainable aquaculture, Blacwell Publishing IOWA USA. [4] Anderson 2007. Sustainable aquaculture : what does it mean and How do we get there ? In Leung et al.,., 2007. Species and system selection for sustainable aquaculture, Blacwell Publishing IOWA USA Anderson [5] BPS- Central Bureau Statistics Belu Regency, 2012. Belu Regency in Figure. [6] Barbier, E.B danCox,M. 2002. Economic and demography factors affecting mangrove lloss in the coastal provinces of Thailand, 1979-1996. Ambio, (31):351-357. [7] Boers, 2001. Sustainable coastal aquaculture. The economic and environmental rehabilitation of traditional aquaculture ponds at Sinjai, South Sulawesi,Indonesia.Collaborative Environmental Project InIndonesia, Jakarta Indonesia. 64 pp.
  • 12. Market Demand Analysis of Prawn and Milkfish for Cultivation Business development in Malaka…. International Journal of Business Marketing and Management (IJBMM) Page 45 [8] Dey and Ahmed, 2005. Aquaculture – Food and livelihood for the poor in Asia : A brief overview of the issues. Aquaculture economic and management 9(1-2) : 1-10 inMahffuzudin Ahmed, Madan M. Dey., Yolanda Garcia, 2007. The role of species and growth of aquaculture in Asia : Need and prospect In Leung et al., 2007. Species and system selection for sustainable aquaculture, Blacwell Publishing IOWA USA. [9] Department of Marine and Fisheries Belu, 2012. Report on Assessment and Determination of Minapolitan Area of Belu Regency. [10] Diana,J.S.,2009.AquacultureproductionandBiodiversityConservation.BioSciense(59):27-38. [11] Directorate General of Aquaculture, 2002. Principal thoughts of Coastal Management's draft law. Jakarta [12] FAO, 2003. Fisheries statistic. Food and Agriculture Organization of the United Nations, Rome Italy. ftp://ftp.fao/org/docrep/fao/009/a0597e/a-597e.pdfinMahffuzudin Ahmed, Madan M. Dey., Yolanda Garcia, 2007. The role of species and growth of aquaculture in Asia : Need and prospect In Leung et al.,., 2007. Species and system selection for sustainable aquaculture, Blacwell Publishing IOWA USA. [13] FAO, 2004. The State of world Fisheries and Aquaculture 2004. Fisheries Departement, Food and Agriculture Organization of the United Nations. RomeItaly [14] FAO, 2005. Fish Statplus. Food and AgroicultureOrganitation of The United Nations Rome Italy. Http: www.fao,org/fi/statist/FISOFT/FISHPLUS.asp [15] FAO,2006a.FishStat.FisheriesDepartement,FoodandAgricultureOrganizationoftheUnitedNation.RomeItaly. [16] FAO, 2006b. Production : Environment, species, quatities and values. Chapter 2 in Expert Workshop on Global Review on Status and Trens in Aquaculture and Prospective analysys of Future Aquaculture Development. Guangzhou City, Guangdong, China.12-15 March 2006. Food and AgricultureOrganizationoftheUnitedNations,RomeItaly. [17] FAO, 2010., Yearbook of fishery statistics, htpp : //www.fao.org. Retrieved on 1 March 2011. [18] Francisco, 2007. Socioeconomics Aspects of Species and System Selection For Sustainable Aquaculture Development in Mexico : Historic Overview and Current General Trends In Species and System Selection by Leung Ping Sun, Cheng Sheng Lee and Patricio J O’Brian. Blackwell Publishing, IOWA USA [19] Fragedous, K. 2002. Shrimp Farming in The Mekong Delta. Its develompent and impact on the economy and local society. OIKOS Environmen Resouces. A report submitted in partial fullfilment of the GAMBAS Project Contract 99/362-B7/6200 Ifremer/European Commission DG Development,19pp [20] Hanafie, R. 2010. Introduction to Agricultural Economics. Publisher CV ANDI. [21] Ministry of Marine Affairs and Fisheries In Figures, 2012. [22] Leung., P.S., C.S. Lee and P.J. O’Bryen., 2007. Species and system selection for sustainable aquaculture.Blackwell publishing, IOWA-USA. [23] Liufeto, F. 2006. Fishery Feasibility Survey Report in NTT Province. Cooperation Team IPB and Ministry of Marine Affairs and Fisheries RI. Not Published. [24] Nash, C., 1995. Aquaculture Sector Planning and management. The University Press, Cambridge. [25] Nash, C. 2004. Achieving Policy Objectives to Increase the Value of The Seafood Industry In The United States : The Technical Feasibility and Associated Constraints. Food Policy, 29 (6) : 621-641 [26] Nugroho I and R. Dahuri, 2013. Regional Development: Economic, Social and Environmental Perspectives. Jakarta - LP3ES. [27] Okorie, 2003. Nigeria Fisheries at the time of economic paradigm shift. AA Eyo (ed). IsheriesSocietty of Niger, FISON. In Proceeding of 18th Annual conference of fisheries society of Nigeria . pp 16-21 [28] Tacon, AGJ. 2001. Increasing the Contribution od Aquaculture for Food Security and Poverty Alleviation . In A Tacon (ed) Aquaculture in third millennium.Bangkok,Thailand,20-25Februari2000.NACA,FAO,Romepp66-71 [29] Tajerin and Mohammad. Noor, 2004. Indonesia Shrimp Competitiveness in the international market: An analysis with market share approach using econometric model. Economic Journal of Development, State Economic Review, p. 187-191. [30] Wibowo, P., Ch.E. Nirarita, S. Susanti, D.Padmawinata, Kumarini, M.Syarif., Y. Hendriani, Kusniangsih, L. Br Sinulingga. 1996. Indonesia Wetland Ecosystem: A Guide Book for Teachers and Educational Practitioners. Wetlands International- Indonesia Program Bogor. [31] Widiati, A. 2007. Policy and strategy of spatial planning of border areas between countries in NTT Province.Journal of Science and Technology Indonesia Vol 9 No. 3 December 2007. P 110-119. [32] Widi, R.K. 2010. Principles of Research Methodology.