Download as PDF, PPTX


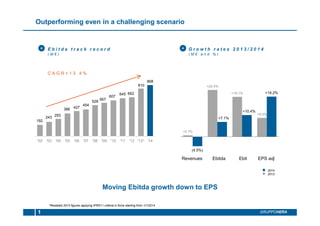
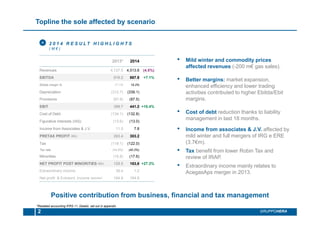
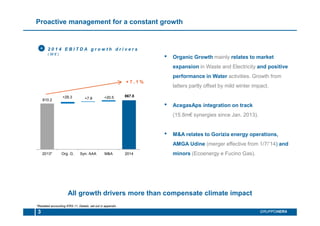
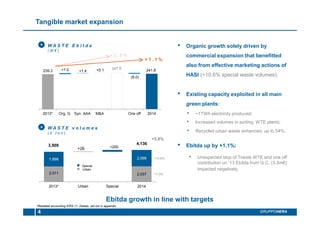
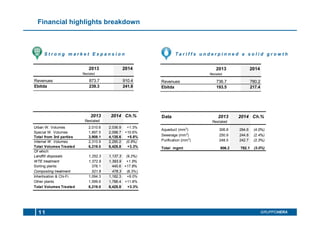

The document provides an analyst presentation on the financial results of Hera Group for 2014. Key highlights include: - Revenues decreased 4.5% to €4.51 billion due to lower gas sales from mild winter weather, while EBITDA grew 7.1% to €868 million driven by market expansion, efficiency gains, and lower trading activities. - Net profit increased 27.3% to €163.6 million through business growth, financial management, and lower taxes. Cash generation was positive after dividends despite acquisitions. - The presentation reviews financial results and growth drivers for each business division including networks, waste, energy, and provides an outlook on further sector consolidation in Italy.


