SlideShare a Scribd company logo
1 of 26
1
August 2018
Understanding the
Trump Economy
Monthly Job Creation
Topics
2
1. Jobs and Employment
2. Wages and Inflation
3. GDP Growth
4. Budget Deficits & Debt
5. Trade
6. Other Measures
Monthly Job Creation
3
 Net job creation (non-farm payrolls)
is perhaps the best overall measure
of how the economy is doing
 Monthly job creation averaged
194,000 for Trump in his first 19
months, vs. 205,000 in Obama’s last
19 months.
Source: NYT “Trump’s Economic Claims
Are Overblown” (August 3, 2018)
The Total Number of Jobs Regained its 2007 Peak by May 2014
4
July 2018
149.1 million total
May ‘14 Jan ‘17Private is 127m jobs; Govt is 22m jobs
This figure shows the total number of non-farm payroll jobs in the economy
The total changes based on the monthly change in the previous slide
Note how consistently the line has risen since 2010
Number of jobs recovered to 2007 peak by May 2014
Trump was inaugurated in January 2017
Unemployment Rates Have Fallen Consistently Since 2010
5
7.5%
July ‘18
3.9%
U-3
U-6
 U-3 is the commonly reported rate in the news
 U-6 is a wider rate with additional persons
 U-3 recovered to pre-recession levels by May
2016; U6 by May 2017
For All Races, U3 Unemployment Rates Have Fallen Since 2010 or 2011
6
July
2018
3.9%
Overall rate
Topics
7
1. Jobs and Employment
2. Wages and Inflation
3. GDP Growth
4. Budget Deficits & Debt
5. Trade
6. Other Measures
Real (Inflation-Adjusted) Hourly Earnings Growth Rate (%)
8
Source: NYT “Trump’s Economic Claims Are Overblown” (August 3, 2018)
 Real wage growth averaged
0.8% under Obama (2009-2016)
vs. 0.3% for Trump (2017-2018)
 Real wage growth turned
negative in June and July 2018,
as gas prices drove inflation
faster than wage growth
Topics
9
1. Jobs and Employment
2. Wages and Inflation
3. GDP Growth
4. Budget Deficits & Debt
5. Trade
6. Other Measures
Real GDP Growth (Full Year)
10
2.2%
1.6%
2.9%
2.5%
1.8%
2.2%
 Real gross domestic product (GDP) growth is a measure of national production and income
 Trump’s first year in office was 2017
 Measured for the full year, GDP growth in 2017 was higher than 2016, but below 2014 and 2015.
*Real means adjusted for inflation. This is the number commonly reported in the news.
Real GDP Growth (Quarterly)
11
 Real GDP growth was 4.1% in Q2 2018, the best since Q3 2014
 There were four Obama quarters higher than 4.1% GDP growth
*Real means adjusted for inflation. This is the number commonly reported in the news.
5.1% 4.9%
4.1%
4.7%4.5%
What Contributed to the 4.1% Growth Figure in Q2 2018?
12
CRFB: “Growth just hit
4.1% - Don’t Expect it to
Last” (July 27, 2018)
 Trump has increased spending
and cut taxes, contributing
about a 0.8% boost to the
growth rate in Q2 2018
 Concern about trade wars
caused a spike in exports to
beat tariff imposition dates,
contributing 0.6%.
 Excluding these factors,
growth would have been
about 2.7%.
 Historically, economy has grown faster under Democratic Presidents
 Economy under Carter grew faster than Reagan’s first term, but not
his second
 Economy grew faster under Clinton than Reagan
 Economy grew about same pace under Obama as G.W. Bush around
1.8% (including both terms; Obama’s not shown)
 Much of G.W. Bush growth was a bubble (ex-bubble was about 1.0-
1.2% growth)
Source: The Economist: “Timing is Everything-Presidents and Growth” (August 2014)
Real GDP Growth Faster Under Democratic Presidents Historically
13
Topics
14
1. Jobs and Employment
2. Wages and Inflation
3. GDP Growth
4. Budget Deficits & Debt
5. Trade
6. Other Measures
Federal Budget Deficit % GDP (1968-2028)
15
Budget deficits jumped during
the Great Recession and steadily
fell back to below historical
average by 2014.
The largest deficit year (FY 2009)
was budgeted by President Bush
and was mainly driven by
revenue declines and spending
for unemployment compensation
and food stamps, not Obama
policy.
Obama kept spending flat at
about $3.5 trillion from FY2010-
2015, while revenues recovered,
thus lowering the deficit. He also
raised taxes on the top 1% in
2013 with the partial expiration
of the Bush tax cuts.
Deficits average about 5% GDP
2018-2028, or $1.2 trillion per
year.
CBO “Budget & Economic Outlook 2018-2028” (April 2018)
Trump Tax Cuts Significantly Increase the Annual Deficit and Debt (Sum of Deficits)
16
 Trump inherited a $9.4 trillion debt increase trajectory over the 2018-2027 period (CBO January 2017 baseline). This is a forecast of the
sum of the annual deficits for those years. It assumes laws on the books as of that time were to continue (i.e., before any changes).
 CBO estimated in April 2018 that the Trump Tax Cuts will add about $2.3 trillion to the debt trajectory over 10 years (table B-3, below).
 This changes the trajectory to $11.7 trillion ($9.4 + $2.3 = $11.7). It assumes the tax cuts expire for individuals in 2025, which is unlikely.
 The alternate scenario, presented on the next page, assumes the tax cuts and other current policies are extended, increasing the impact of
Trump’s economic policies (tax cuts and spending) on the debt trajectory to $4.3 trillion, so the new trajectory is $9.4 + $4.3 = $13.7 trillion.
CBO “Budget & Economic Outlook 2018-2028” (April 2018)
Federal Budget Deficit Forecasts for 2018-2027 ($ Billions)
CBO January 2017 Baseline (Obama) vs. April 2018 Alternate (Trump)
487
601 684
797
959 1,000 1,027
1,165
1,297
1,408
318
380
421
470
490 473 441
437
385
443
-
200
400
600
800
1,000
1,200
1,400
1,600
1,800
2,000
2018 2019 2020 2021 2022 2023 2024 2025 2026 2027
$9.4 trillion total
CBO January
2017 Baseline
$4.3 trillion additions
due to Trump’s tax cuts
and spending increases,
if current policy
extended
+45% vs. January 2017
baseline (+$34,000 per
household)
5x Obama 2009
Stimulus Plan (ARRA)
Source: CBO “Budget & Economic Outlook” (January 2017 and April 2018) 17
$13.7 trillion total additionsTrump inherited a $9.4 trillion debt increase trajectory over 10 years.
He has since turned that into $13.7 trillion, a 45% increase.
NYT: Paul Krugman “Trump, Tariffs, Tofu and Tax Cuts” (July 9, 2018)
Krugman: “Corporations have gotten a really big tax cut: The tax take on corporate profits
has fallen off a cliff since the tax cut was enacted. But they’re using the extra money for stock
buybacks and higher dividends, not investment.”
2013 2018
Trump Tax Cuts: Federal Corporate Income Tax Receipts ($ Billion)
18
Trump Tax Cuts: Distributional Impact by Income Group
19
 CBO estimated that most lower income brackets will incur a net cost from the Trump Tax Cuts, as healthcare subsidies
are reduced to millions of persons losing health insurance.
 About 4 million persons lost health insurance from 2016 to 2018, so subsidies flowing to those families were cut
 Higher income brackets get a sizable tax cut
 The bottom 60% are expected to get 17% of the benefit of the tax cut, worsening income inequality
 Most middle class families incur costs after 2025, if the individual cuts expire on schedule. This is because the formula
for how fast the tax brackets rise with inflation was changed, so the brackets rise more slowly, a subtle tax increase
Sources:
 CBO “Distributional Effects of Changes in
Taxes and Spending under the Conference
Agreement for HR 1” (December 2017)
 Joint Committee on Taxation JCX58-
”Distributional Effects of the TCJA”
(November 2017)
Topics
20
1. Jobs and Employment
2. Wages and Inflation
3. GDP Growth
4. Budget Deficits & Debt
5. Trade
6. Other Measures
Economists Overwhelmingly Agree: Tariffs Hurt America Overall (March ‘18)
21
“So when a tariff drives up the price of
imports to consumers, leading them to
buy fewer imported goods, the welfare
loss will be roughly:
Loss = fall in imports * ½ tariff rate”
Krugman estimates 2-3% GDP loss with a
major trade war, if we had tariffs of 40%
and a 70% decline in trade
Significant employment disruption (11
million employed in export industries)
Krugman: Effect of Higher Trade Barriers
22NYT: Paul Krugman “Thinking About a Trade War” (June 2018)
How Trade Increases Output/GDP
23Peterson Institute for International Economics: Bradford, Grieco, and Hufbauer- “The Payoff to America from Global Integration” (2005)
Topics
24
1. Jobs and Employment
2. Wages and Inflation
3. GDP Growth
4. Budget Deficits & Debt
5. Trade
6. Other Measures
Stocks: Bull Market Since 2009
25
 The stock market has been increasing
since March 2009 without a 20%
decline
 The top 1% wealthiest own about 40%
of stock market value
 The top 10% wealthiest own about 81%
 The bottom 80% own 8%
 The bottom 50% have no direct or
indirect stock ownership
NYT: “Bull Market Hits a Milestone: 3,453
Days. Most Americans Aren’t at the Party.”
(August 22, 2018)
NPR: “While Trump Touts Stock
Market, Many Americans Are Left Out
Of The Conversation” (March 1, 2017)
U.S. Household Net Worth Hit $100 Trillion in Q1 2018
26
 Net worth reflects stock market (financial assets) and home equity
 The globalized free trade system has been a massive wealth generator, but the gains were unequally distributed
 Real (inflation-adjusted) household net worth has increased 2.5x since 1990
 $100 trillion is about $800,000 per family if split evenly
 Median (50th percentile family) had $100,000 net worth in 2016
 The top 1% owns about 40% of this wealth, vs. 25% in the pre-Reagan era
Real Net Worth
(2018 $)
Q1 2018
$100.7
trillion

More Related Content

What's hot

Tutorial: Is the Government Debt Out of Control?
Tutorial: Is the Government Debt Out of Control?Tutorial: Is the Government Debt Out of Control?
Tutorial: Is the Government Debt Out of Control?Ed Dolan
 
Brazil economic focus november 2016
Brazil economic focus november 2016Brazil economic focus november 2016
Brazil economic focus november 2016UK in Brazil
 
Economics Mr Thompsons Notes
Economics Mr Thompsons NotesEconomics Mr Thompsons Notes
Economics Mr Thompsons NotesAndre Bauhofer
 
July 2014 - How to improve education quality
July 2014 - How to improve education qualityJuly 2014 - How to improve education quality
July 2014 - How to improve education qualityFGV Brazil
 
Deloitte - Global Economic Outlook 2015
Deloitte - Global Economic Outlook 2015Deloitte - Global Economic Outlook 2015
Deloitte - Global Economic Outlook 2015SYGroup
 
World Economic Situation and Prospects
World Economic Situation and ProspectsWorld Economic Situation and Prospects
World Economic Situation and ProspectsZiaullah Mirza
 
Us econ ppt lynchburg 3-4-2011 final_dr.shea
Us econ ppt lynchburg 3-4-2011 final_dr.sheaUs econ ppt lynchburg 3-4-2011 final_dr.shea
Us econ ppt lynchburg 3-4-2011 final_dr.shealynchburg
 
Government and Fiscal Policy
Government and Fiscal PolicyGovernment and Fiscal Policy
Government and Fiscal PolicyLumen Learning
 
June 2012 - Electric energy sector needs rewiring
June 2012 - Electric energy sector needs rewiringJune 2012 - Electric energy sector needs rewiring
June 2012 - Electric energy sector needs rewiringFGV Brazil
 
Zacks Pro Stimulus Analysis
Zacks Pro Stimulus AnalysisZacks Pro Stimulus Analysis
Zacks Pro Stimulus AnalysisKevin Tay
 
20140430_MACRO_BRAZIL_FISCAL
20140430_MACRO_BRAZIL_FISCAL20140430_MACRO_BRAZIL_FISCAL
20140430_MACRO_BRAZIL_FISCALMauricio Oreng
 
Economic Volatility: How Covid-19 is Affecting Our Communities
Economic Volatility: How Covid-19 is Affecting Our CommunitiesEconomic Volatility: How Covid-19 is Affecting Our Communities
Economic Volatility: How Covid-19 is Affecting Our CommunitiesNicolasMontenegro13
 
Domain training economics
Domain training  economicsDomain training  economics
Domain training economicsShikta Singh
 
Fiscal Policy and its effects of Economy.Eop Abid Hussain Sindhu, M14BBA036,...
Fiscal Policy and its effects of Economy.Eop  Abid Hussain Sindhu, M14BBA036,...Fiscal Policy and its effects of Economy.Eop  Abid Hussain Sindhu, M14BBA036,...
Fiscal Policy and its effects of Economy.Eop Abid Hussain Sindhu, M14BBA036,...564251
 

What's hot (20)

Tutorial: Is the Government Debt Out of Control?
Tutorial: Is the Government Debt Out of Control?Tutorial: Is the Government Debt Out of Control?
Tutorial: Is the Government Debt Out of Control?
 
Brazil economic focus november 2016
Brazil economic focus november 2016Brazil economic focus november 2016
Brazil economic focus november 2016
 
US Budgeting
US BudgetingUS Budgeting
US Budgeting
 
R42063
R42063R42063
R42063
 
Economics Mr Thompsons Notes
Economics Mr Thompsons NotesEconomics Mr Thompsons Notes
Economics Mr Thompsons Notes
 
July 2014 - How to improve education quality
July 2014 - How to improve education qualityJuly 2014 - How to improve education quality
July 2014 - How to improve education quality
 
Usa economy
Usa economyUsa economy
Usa economy
 
Deloitte - Global Economic Outlook 2015
Deloitte - Global Economic Outlook 2015Deloitte - Global Economic Outlook 2015
Deloitte - Global Economic Outlook 2015
 
World Economic Situation and Prospects
World Economic Situation and ProspectsWorld Economic Situation and Prospects
World Economic Situation and Prospects
 
Ibd20131111
Ibd20131111Ibd20131111
Ibd20131111
 
Us econ ppt lynchburg 3-4-2011 final_dr.shea
Us econ ppt lynchburg 3-4-2011 final_dr.sheaUs econ ppt lynchburg 3-4-2011 final_dr.shea
Us econ ppt lynchburg 3-4-2011 final_dr.shea
 
Government and Fiscal Policy
Government and Fiscal PolicyGovernment and Fiscal Policy
Government and Fiscal Policy
 
June 2012 - Electric energy sector needs rewiring
June 2012 - Electric energy sector needs rewiringJune 2012 - Electric energy sector needs rewiring
June 2012 - Electric energy sector needs rewiring
 
Commercial Real Estate Market Outlook Q-1 2017
Commercial Real Estate Market Outlook Q-1  2017Commercial Real Estate Market Outlook Q-1  2017
Commercial Real Estate Market Outlook Q-1 2017
 
Zacks Pro Stimulus Analysis
Zacks Pro Stimulus AnalysisZacks Pro Stimulus Analysis
Zacks Pro Stimulus Analysis
 
20140430_MACRO_BRAZIL_FISCAL
20140430_MACRO_BRAZIL_FISCAL20140430_MACRO_BRAZIL_FISCAL
20140430_MACRO_BRAZIL_FISCAL
 
Economic Volatility: How Covid-19 is Affecting Our Communities
Economic Volatility: How Covid-19 is Affecting Our CommunitiesEconomic Volatility: How Covid-19 is Affecting Our Communities
Economic Volatility: How Covid-19 is Affecting Our Communities
 
Domain training economics
Domain training  economicsDomain training  economics
Domain training economics
 
Fiscal Policy and its effects of Economy.Eop Abid Hussain Sindhu, M14BBA036,...
Fiscal Policy and its effects of Economy.Eop  Abid Hussain Sindhu, M14BBA036,...Fiscal Policy and its effects of Economy.Eop  Abid Hussain Sindhu, M14BBA036,...
Fiscal Policy and its effects of Economy.Eop Abid Hussain Sindhu, M14BBA036,...
 
Fiscal policy - times pro
Fiscal policy - times proFiscal policy - times pro
Fiscal policy - times pro
 

Similar to Understanding the Trump Economy

The Economy under President Obama
The Economy under President ObamaThe Economy under President Obama
The Economy under President ObamaDavid Doney
 
Tax Cuts and Jobs Act
Tax Cuts and Jobs ActTax Cuts and Jobs Act
Tax Cuts and Jobs ActDavid Doney
 
Arbor EconomicOverview 2020 Q1
Arbor EconomicOverview 2020 Q1Arbor EconomicOverview 2020 Q1
Arbor EconomicOverview 2020 Q1Ivan Kaufman
 
Growing Healthcare Costsandthe Federal Debt
Growing Healthcare Costsandthe Federal DebtGrowing Healthcare Costsandthe Federal Debt
Growing Healthcare Costsandthe Federal DebtHealthwork
 
Federal budget slide show civic club version
Federal budget slide show civic club versionFederal budget slide show civic club version
Federal budget slide show civic club versionAlex Cardenas
 
Global and Spanish economy 4Q-17 and outlook 2018
Global and Spanish economy 4Q-17 and outlook 2018Global and Spanish economy 4Q-17 and outlook 2018
Global and Spanish economy 4Q-17 and outlook 2018Círculo de Empresarios
 
15Introduction The economy of the United State.docx
    15Introduction The economy of the United State.docx    15Introduction The economy of the United State.docx
15Introduction The economy of the United State.docxhallettfaustina
 
Economic Intervention: Deprogramming Conservatives
Economic Intervention: Deprogramming ConservativesEconomic Intervention: Deprogramming Conservatives
Economic Intervention: Deprogramming ConservativesDavid Doney
 
DB27 Economic Policy Challenging IncrementalismIncremental and.docx
DB27 Economic Policy Challenging IncrementalismIncremental and.docxDB27 Economic Policy Challenging IncrementalismIncremental and.docx
DB27 Economic Policy Challenging IncrementalismIncremental and.docxtheodorelove43763
 
The Economic Outlook for 2017 by Kevin Lings
The Economic Outlook for 2017 by Kevin LingsThe Economic Outlook for 2017 by Kevin Lings
The Economic Outlook for 2017 by Kevin LingsSTANLIB
 
Conservative economic mythology
Conservative economic mythologyConservative economic mythology
Conservative economic mythologyDavid Doney
 
PwC Global Economy Watch (oct. 2013)
PwC Global Economy Watch (oct. 2013)PwC Global Economy Watch (oct. 2013)
PwC Global Economy Watch (oct. 2013)PwC France
 
Government spends we lose 9.6.10
Government spends we lose 9.6.10Government spends we lose 9.6.10
Government spends we lose 9.6.10lineofsight
 
Hyre Weekly Commentary
Hyre Weekly CommentaryHyre Weekly Commentary
Hyre Weekly Commentaryhyrejam
 
Jason Furman slides on President Obama's economic record and the challenges a...
Jason Furman slides on President Obama's economic record and the challenges a...Jason Furman slides on President Obama's economic record and the challenges a...
Jason Furman slides on President Obama's economic record and the challenges a...ResolutionFoundation
 

Similar to Understanding the Trump Economy (19)

The Economy under President Obama
The Economy under President ObamaThe Economy under President Obama
The Economy under President Obama
 
Tax Cuts and Jobs Act
Tax Cuts and Jobs ActTax Cuts and Jobs Act
Tax Cuts and Jobs Act
 
Arbor EconomicOverview 2020 Q1
Arbor EconomicOverview 2020 Q1Arbor EconomicOverview 2020 Q1
Arbor EconomicOverview 2020 Q1
 
Growing Healthcare Costs and the Federal Debt
Growing Healthcare Costs and the Federal DebtGrowing Healthcare Costs and the Federal Debt
Growing Healthcare Costs and the Federal Debt
 
Growing Healthcare Costsandthe Federal Debt
Growing Healthcare Costsandthe Federal DebtGrowing Healthcare Costsandthe Federal Debt
Growing Healthcare Costsandthe Federal Debt
 
Federal budget slide show civic club version
Federal budget slide show civic club versionFederal budget slide show civic club version
Federal budget slide show civic club version
 
Global and Spanish economy 4Q-17 and outlook 2018
Global and Spanish economy 4Q-17 and outlook 2018Global and Spanish economy 4Q-17 and outlook 2018
Global and Spanish economy 4Q-17 and outlook 2018
 
15Introduction The economy of the United State.docx
    15Introduction The economy of the United State.docx    15Introduction The economy of the United State.docx
15Introduction The economy of the United State.docx
 
Economic Intervention: Deprogramming Conservatives
Economic Intervention: Deprogramming ConservativesEconomic Intervention: Deprogramming Conservatives
Economic Intervention: Deprogramming Conservatives
 
Budget Deficit Essay
Budget Deficit EssayBudget Deficit Essay
Budget Deficit Essay
 
DB27 Economic Policy Challenging IncrementalismIncremental and.docx
DB27 Economic Policy Challenging IncrementalismIncremental and.docxDB27 Economic Policy Challenging IncrementalismIncremental and.docx
DB27 Economic Policy Challenging IncrementalismIncremental and.docx
 
U.S. Economic Crisis Essay
U.S. Economic Crisis EssayU.S. Economic Crisis Essay
U.S. Economic Crisis Essay
 
The Economic Outlook for 2017 by Kevin Lings
The Economic Outlook for 2017 by Kevin LingsThe Economic Outlook for 2017 by Kevin Lings
The Economic Outlook for 2017 by Kevin Lings
 
Conservative economic mythology
Conservative economic mythologyConservative economic mythology
Conservative economic mythology
 
PwC Global Economy Watch (oct. 2013)
PwC Global Economy Watch (oct. 2013)PwC Global Economy Watch (oct. 2013)
PwC Global Economy Watch (oct. 2013)
 
Government spends we lose 9.6.10
Government spends we lose 9.6.10Government spends we lose 9.6.10
Government spends we lose 9.6.10
 
US Economic Stimulus, Q3
US Economic Stimulus, Q3US Economic Stimulus, Q3
US Economic Stimulus, Q3
 
Hyre Weekly Commentary
Hyre Weekly CommentaryHyre Weekly Commentary
Hyre Weekly Commentary
 
Jason Furman slides on President Obama's economic record and the challenges a...
Jason Furman slides on President Obama's economic record and the challenges a...Jason Furman slides on President Obama's economic record and the challenges a...
Jason Furman slides on President Obama's economic record and the challenges a...
 

Recently uploaded

The Economic History of the U.S. Lecture 17.pdf
The Economic History of the U.S. Lecture 17.pdfThe Economic History of the U.S. Lecture 17.pdf
The Economic History of the U.S. Lecture 17.pdfGale Pooley
 
Lundin Gold April 2024 Corporate Presentation v4.pdf
Lundin Gold April 2024 Corporate Presentation v4.pdfLundin Gold April 2024 Corporate Presentation v4.pdf
Lundin Gold April 2024 Corporate Presentation v4.pdfAdnet Communications
 
The Economic History of the U.S. Lecture 30.pdf
The Economic History of the U.S. Lecture 30.pdfThe Economic History of the U.S. Lecture 30.pdf
The Economic History of the U.S. Lecture 30.pdfGale Pooley
 
VIP Call Girls LB Nagar ( Hyderabad ) Phone 8250192130 | ₹5k To 25k With Room...
VIP Call Girls LB Nagar ( Hyderabad ) Phone 8250192130 | ₹5k To 25k With Room...VIP Call Girls LB Nagar ( Hyderabad ) Phone 8250192130 | ₹5k To 25k With Room...
VIP Call Girls LB Nagar ( Hyderabad ) Phone 8250192130 | ₹5k To 25k With Room...Suhani Kapoor
 
(ANIKA) Budhwar Peth Call Girls Just Call 7001035870 [ Cash on Delivery ] Pun...
(ANIKA) Budhwar Peth Call Girls Just Call 7001035870 [ Cash on Delivery ] Pun...(ANIKA) Budhwar Peth Call Girls Just Call 7001035870 [ Cash on Delivery ] Pun...
(ANIKA) Budhwar Peth Call Girls Just Call 7001035870 [ Cash on Delivery ] Pun...ranjana rawat
 
Independent Call Girl Number in Kurla Mumbai📲 Pooja Nehwal 9892124323 💞 Full ...
Independent Call Girl Number in Kurla Mumbai📲 Pooja Nehwal 9892124323 💞 Full ...Independent Call Girl Number in Kurla Mumbai📲 Pooja Nehwal 9892124323 💞 Full ...
Independent Call Girl Number in Kurla Mumbai📲 Pooja Nehwal 9892124323 💞 Full ...Pooja Nehwal
 
VIP Kolkata Call Girl Jodhpur Park 👉 8250192130 Available With Room
VIP Kolkata Call Girl Jodhpur Park 👉 8250192130  Available With RoomVIP Kolkata Call Girl Jodhpur Park 👉 8250192130  Available With Room
VIP Kolkata Call Girl Jodhpur Park 👉 8250192130 Available With Roomdivyansh0kumar0
 
02_Fabio Colombo_Accenture_MeetupDora&Cybersecurity.pptx
02_Fabio Colombo_Accenture_MeetupDora&Cybersecurity.pptx02_Fabio Colombo_Accenture_MeetupDora&Cybersecurity.pptx
02_Fabio Colombo_Accenture_MeetupDora&Cybersecurity.pptxFinTech Belgium
 
06_Joeri Van Speybroek_Dell_MeetupDora&Cybersecurity.pdf
06_Joeri Van Speybroek_Dell_MeetupDora&Cybersecurity.pdf06_Joeri Van Speybroek_Dell_MeetupDora&Cybersecurity.pdf
06_Joeri Van Speybroek_Dell_MeetupDora&Cybersecurity.pdfFinTech Belgium
 
The Economic History of the U.S. Lecture 22.pdf
The Economic History of the U.S. Lecture 22.pdfThe Economic History of the U.S. Lecture 22.pdf
The Economic History of the U.S. Lecture 22.pdfGale Pooley
 
VVIP Pune Call Girls Katraj (7001035870) Pune Escorts Nearby with Complete Sa...
VVIP Pune Call Girls Katraj (7001035870) Pune Escorts Nearby with Complete Sa...VVIP Pune Call Girls Katraj (7001035870) Pune Escorts Nearby with Complete Sa...
VVIP Pune Call Girls Katraj (7001035870) Pune Escorts Nearby with Complete Sa...Call Girls in Nagpur High Profile
 
Interimreport1 January–31 March2024 Elo Mutual Pension Insurance Company
Interimreport1 January–31 March2024 Elo Mutual Pension Insurance CompanyInterimreport1 January–31 March2024 Elo Mutual Pension Insurance Company
Interimreport1 January–31 March2024 Elo Mutual Pension Insurance CompanyTyöeläkeyhtiö Elo
 
Q3 2024 Earnings Conference Call and Webcast Slides
Q3 2024 Earnings Conference Call and Webcast SlidesQ3 2024 Earnings Conference Call and Webcast Slides
Q3 2024 Earnings Conference Call and Webcast SlidesMarketing847413
 
00_Main ppt_MeetupDORA&CyberSecurity.pptx
00_Main ppt_MeetupDORA&CyberSecurity.pptx00_Main ppt_MeetupDORA&CyberSecurity.pptx
00_Main ppt_MeetupDORA&CyberSecurity.pptxFinTech Belgium
 
OAT_RI_Ep19 WeighingTheRisks_Apr24_TheYellowMetal.pptx
OAT_RI_Ep19 WeighingTheRisks_Apr24_TheYellowMetal.pptxOAT_RI_Ep19 WeighingTheRisks_Apr24_TheYellowMetal.pptx
OAT_RI_Ep19 WeighingTheRisks_Apr24_TheYellowMetal.pptxhiddenlevers
 
Quarter 4- Module 3 Principles of Marketing
Quarter 4- Module 3 Principles of MarketingQuarter 4- Module 3 Principles of Marketing
Quarter 4- Module 3 Principles of MarketingMaristelaRamos12
 
The Economic History of the U.S. Lecture 20.pdf
The Economic History of the U.S. Lecture 20.pdfThe Economic History of the U.S. Lecture 20.pdf
The Economic History of the U.S. Lecture 20.pdfGale Pooley
 
20240417-Calibre-April-2024-Investor-Presentation.pdf
20240417-Calibre-April-2024-Investor-Presentation.pdf20240417-Calibre-April-2024-Investor-Presentation.pdf
20240417-Calibre-April-2024-Investor-Presentation.pdfAdnet Communications
 
High Class Call Girls Nashik Maya 7001305949 Independent Escort Service Nashik
High Class Call Girls Nashik Maya 7001305949 Independent Escort Service NashikHigh Class Call Girls Nashik Maya 7001305949 Independent Escort Service Nashik
High Class Call Girls Nashik Maya 7001305949 Independent Escort Service NashikCall Girls in Nagpur High Profile
 

Recently uploaded (20)

The Economic History of the U.S. Lecture 17.pdf
The Economic History of the U.S. Lecture 17.pdfThe Economic History of the U.S. Lecture 17.pdf
The Economic History of the U.S. Lecture 17.pdf
 
Lundin Gold April 2024 Corporate Presentation v4.pdf
Lundin Gold April 2024 Corporate Presentation v4.pdfLundin Gold April 2024 Corporate Presentation v4.pdf
Lundin Gold April 2024 Corporate Presentation v4.pdf
 
The Economic History of the U.S. Lecture 30.pdf
The Economic History of the U.S. Lecture 30.pdfThe Economic History of the U.S. Lecture 30.pdf
The Economic History of the U.S. Lecture 30.pdf
 
VIP Call Girls LB Nagar ( Hyderabad ) Phone 8250192130 | ₹5k To 25k With Room...
VIP Call Girls LB Nagar ( Hyderabad ) Phone 8250192130 | ₹5k To 25k With Room...VIP Call Girls LB Nagar ( Hyderabad ) Phone 8250192130 | ₹5k To 25k With Room...
VIP Call Girls LB Nagar ( Hyderabad ) Phone 8250192130 | ₹5k To 25k With Room...
 
(ANIKA) Budhwar Peth Call Girls Just Call 7001035870 [ Cash on Delivery ] Pun...
(ANIKA) Budhwar Peth Call Girls Just Call 7001035870 [ Cash on Delivery ] Pun...(ANIKA) Budhwar Peth Call Girls Just Call 7001035870 [ Cash on Delivery ] Pun...
(ANIKA) Budhwar Peth Call Girls Just Call 7001035870 [ Cash on Delivery ] Pun...
 
Independent Call Girl Number in Kurla Mumbai📲 Pooja Nehwal 9892124323 💞 Full ...
Independent Call Girl Number in Kurla Mumbai📲 Pooja Nehwal 9892124323 💞 Full ...Independent Call Girl Number in Kurla Mumbai📲 Pooja Nehwal 9892124323 💞 Full ...
Independent Call Girl Number in Kurla Mumbai📲 Pooja Nehwal 9892124323 💞 Full ...
 
VIP Kolkata Call Girl Jodhpur Park 👉 8250192130 Available With Room
VIP Kolkata Call Girl Jodhpur Park 👉 8250192130  Available With RoomVIP Kolkata Call Girl Jodhpur Park 👉 8250192130  Available With Room
VIP Kolkata Call Girl Jodhpur Park 👉 8250192130 Available With Room
 
02_Fabio Colombo_Accenture_MeetupDora&Cybersecurity.pptx
02_Fabio Colombo_Accenture_MeetupDora&Cybersecurity.pptx02_Fabio Colombo_Accenture_MeetupDora&Cybersecurity.pptx
02_Fabio Colombo_Accenture_MeetupDora&Cybersecurity.pptx
 
06_Joeri Van Speybroek_Dell_MeetupDora&Cybersecurity.pdf
06_Joeri Van Speybroek_Dell_MeetupDora&Cybersecurity.pdf06_Joeri Van Speybroek_Dell_MeetupDora&Cybersecurity.pdf
06_Joeri Van Speybroek_Dell_MeetupDora&Cybersecurity.pdf
 
The Economic History of the U.S. Lecture 22.pdf
The Economic History of the U.S. Lecture 22.pdfThe Economic History of the U.S. Lecture 22.pdf
The Economic History of the U.S. Lecture 22.pdf
 
VVIP Pune Call Girls Katraj (7001035870) Pune Escorts Nearby with Complete Sa...
VVIP Pune Call Girls Katraj (7001035870) Pune Escorts Nearby with Complete Sa...VVIP Pune Call Girls Katraj (7001035870) Pune Escorts Nearby with Complete Sa...
VVIP Pune Call Girls Katraj (7001035870) Pune Escorts Nearby with Complete Sa...
 
Interimreport1 January–31 March2024 Elo Mutual Pension Insurance Company
Interimreport1 January–31 March2024 Elo Mutual Pension Insurance CompanyInterimreport1 January–31 March2024 Elo Mutual Pension Insurance Company
Interimreport1 January–31 March2024 Elo Mutual Pension Insurance Company
 
Q3 2024 Earnings Conference Call and Webcast Slides
Q3 2024 Earnings Conference Call and Webcast SlidesQ3 2024 Earnings Conference Call and Webcast Slides
Q3 2024 Earnings Conference Call and Webcast Slides
 
00_Main ppt_MeetupDORA&CyberSecurity.pptx
00_Main ppt_MeetupDORA&CyberSecurity.pptx00_Main ppt_MeetupDORA&CyberSecurity.pptx
00_Main ppt_MeetupDORA&CyberSecurity.pptx
 
OAT_RI_Ep19 WeighingTheRisks_Apr24_TheYellowMetal.pptx
OAT_RI_Ep19 WeighingTheRisks_Apr24_TheYellowMetal.pptxOAT_RI_Ep19 WeighingTheRisks_Apr24_TheYellowMetal.pptx
OAT_RI_Ep19 WeighingTheRisks_Apr24_TheYellowMetal.pptx
 
Quarter 4- Module 3 Principles of Marketing
Quarter 4- Module 3 Principles of MarketingQuarter 4- Module 3 Principles of Marketing
Quarter 4- Module 3 Principles of Marketing
 
Commercial Bank Economic Capsule - April 2024
Commercial Bank Economic Capsule - April 2024Commercial Bank Economic Capsule - April 2024
Commercial Bank Economic Capsule - April 2024
 
The Economic History of the U.S. Lecture 20.pdf
The Economic History of the U.S. Lecture 20.pdfThe Economic History of the U.S. Lecture 20.pdf
The Economic History of the U.S. Lecture 20.pdf
 
20240417-Calibre-April-2024-Investor-Presentation.pdf
20240417-Calibre-April-2024-Investor-Presentation.pdf20240417-Calibre-April-2024-Investor-Presentation.pdf
20240417-Calibre-April-2024-Investor-Presentation.pdf
 
High Class Call Girls Nashik Maya 7001305949 Independent Escort Service Nashik
High Class Call Girls Nashik Maya 7001305949 Independent Escort Service NashikHigh Class Call Girls Nashik Maya 7001305949 Independent Escort Service Nashik
High Class Call Girls Nashik Maya 7001305949 Independent Escort Service Nashik
 

Understanding the Trump Economy

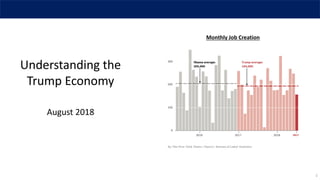
  • 1. 1 August 2018 Understanding the Trump Economy Monthly Job Creation
  • 2. Topics 2 1. Jobs and Employment 2. Wages and Inflation 3. GDP Growth 4. Budget Deficits & Debt 5. Trade 6. Other Measures
  • 3. Monthly Job Creation 3  Net job creation (non-farm payrolls) is perhaps the best overall measure of how the economy is doing  Monthly job creation averaged 194,000 for Trump in his first 19 months, vs. 205,000 in Obama’s last 19 months. Source: NYT “Trump’s Economic Claims Are Overblown” (August 3, 2018)
  • 4. The Total Number of Jobs Regained its 2007 Peak by May 2014 4 July 2018 149.1 million total May ‘14 Jan ‘17Private is 127m jobs; Govt is 22m jobs This figure shows the total number of non-farm payroll jobs in the economy The total changes based on the monthly change in the previous slide Note how consistently the line has risen since 2010 Number of jobs recovered to 2007 peak by May 2014 Trump was inaugurated in January 2017
  • 5. Unemployment Rates Have Fallen Consistently Since 2010 5 7.5% July ‘18 3.9% U-3 U-6  U-3 is the commonly reported rate in the news  U-6 is a wider rate with additional persons  U-3 recovered to pre-recession levels by May 2016; U6 by May 2017
  • 6. For All Races, U3 Unemployment Rates Have Fallen Since 2010 or 2011 6 July 2018 3.9% Overall rate
  • 7. Topics 7 1. Jobs and Employment 2. Wages and Inflation 3. GDP Growth 4. Budget Deficits & Debt 5. Trade 6. Other Measures
  • 8. Real (Inflation-Adjusted) Hourly Earnings Growth Rate (%) 8 Source: NYT “Trump’s Economic Claims Are Overblown” (August 3, 2018)  Real wage growth averaged 0.8% under Obama (2009-2016) vs. 0.3% for Trump (2017-2018)  Real wage growth turned negative in June and July 2018, as gas prices drove inflation faster than wage growth
  • 9. Topics 9 1. Jobs and Employment 2. Wages and Inflation 3. GDP Growth 4. Budget Deficits & Debt 5. Trade 6. Other Measures
  • 10. Real GDP Growth (Full Year) 10 2.2% 1.6% 2.9% 2.5% 1.8% 2.2%  Real gross domestic product (GDP) growth is a measure of national production and income  Trump’s first year in office was 2017  Measured for the full year, GDP growth in 2017 was higher than 2016, but below 2014 and 2015. *Real means adjusted for inflation. This is the number commonly reported in the news.
  • 11. Real GDP Growth (Quarterly) 11  Real GDP growth was 4.1% in Q2 2018, the best since Q3 2014  There were four Obama quarters higher than 4.1% GDP growth *Real means adjusted for inflation. This is the number commonly reported in the news. 5.1% 4.9% 4.1% 4.7%4.5%
  • 12. What Contributed to the 4.1% Growth Figure in Q2 2018? 12 CRFB: “Growth just hit 4.1% - Don’t Expect it to Last” (July 27, 2018)  Trump has increased spending and cut taxes, contributing about a 0.8% boost to the growth rate in Q2 2018  Concern about trade wars caused a spike in exports to beat tariff imposition dates, contributing 0.6%.  Excluding these factors, growth would have been about 2.7%.
  • 13.  Historically, economy has grown faster under Democratic Presidents  Economy under Carter grew faster than Reagan’s first term, but not his second  Economy grew faster under Clinton than Reagan  Economy grew about same pace under Obama as G.W. Bush around 1.8% (including both terms; Obama’s not shown)  Much of G.W. Bush growth was a bubble (ex-bubble was about 1.0- 1.2% growth) Source: The Economist: “Timing is Everything-Presidents and Growth” (August 2014) Real GDP Growth Faster Under Democratic Presidents Historically 13
  • 14. Topics 14 1. Jobs and Employment 2. Wages and Inflation 3. GDP Growth 4. Budget Deficits & Debt 5. Trade 6. Other Measures
  • 15. Federal Budget Deficit % GDP (1968-2028) 15 Budget deficits jumped during the Great Recession and steadily fell back to below historical average by 2014. The largest deficit year (FY 2009) was budgeted by President Bush and was mainly driven by revenue declines and spending for unemployment compensation and food stamps, not Obama policy. Obama kept spending flat at about $3.5 trillion from FY2010- 2015, while revenues recovered, thus lowering the deficit. He also raised taxes on the top 1% in 2013 with the partial expiration of the Bush tax cuts. Deficits average about 5% GDP 2018-2028, or $1.2 trillion per year. CBO “Budget & Economic Outlook 2018-2028” (April 2018)
  • 16. Trump Tax Cuts Significantly Increase the Annual Deficit and Debt (Sum of Deficits) 16  Trump inherited a $9.4 trillion debt increase trajectory over the 2018-2027 period (CBO January 2017 baseline). This is a forecast of the sum of the annual deficits for those years. It assumes laws on the books as of that time were to continue (i.e., before any changes).  CBO estimated in April 2018 that the Trump Tax Cuts will add about $2.3 trillion to the debt trajectory over 10 years (table B-3, below).  This changes the trajectory to $11.7 trillion ($9.4 + $2.3 = $11.7). It assumes the tax cuts expire for individuals in 2025, which is unlikely.  The alternate scenario, presented on the next page, assumes the tax cuts and other current policies are extended, increasing the impact of Trump’s economic policies (tax cuts and spending) on the debt trajectory to $4.3 trillion, so the new trajectory is $9.4 + $4.3 = $13.7 trillion. CBO “Budget & Economic Outlook 2018-2028” (April 2018)
  • 17. Federal Budget Deficit Forecasts for 2018-2027 ($ Billions) CBO January 2017 Baseline (Obama) vs. April 2018 Alternate (Trump) 487 601 684 797 959 1,000 1,027 1,165 1,297 1,408 318 380 421 470 490 473 441 437 385 443 - 200 400 600 800 1,000 1,200 1,400 1,600 1,800 2,000 2018 2019 2020 2021 2022 2023 2024 2025 2026 2027 $9.4 trillion total CBO January 2017 Baseline $4.3 trillion additions due to Trump’s tax cuts and spending increases, if current policy extended +45% vs. January 2017 baseline (+$34,000 per household) 5x Obama 2009 Stimulus Plan (ARRA) Source: CBO “Budget & Economic Outlook” (January 2017 and April 2018) 17 $13.7 trillion total additionsTrump inherited a $9.4 trillion debt increase trajectory over 10 years. He has since turned that into $13.7 trillion, a 45% increase.
  • 18. NYT: Paul Krugman “Trump, Tariffs, Tofu and Tax Cuts” (July 9, 2018) Krugman: “Corporations have gotten a really big tax cut: The tax take on corporate profits has fallen off a cliff since the tax cut was enacted. But they’re using the extra money for stock buybacks and higher dividends, not investment.” 2013 2018 Trump Tax Cuts: Federal Corporate Income Tax Receipts ($ Billion) 18
  • 19. Trump Tax Cuts: Distributional Impact by Income Group 19  CBO estimated that most lower income brackets will incur a net cost from the Trump Tax Cuts, as healthcare subsidies are reduced to millions of persons losing health insurance.  About 4 million persons lost health insurance from 2016 to 2018, so subsidies flowing to those families were cut  Higher income brackets get a sizable tax cut  The bottom 60% are expected to get 17% of the benefit of the tax cut, worsening income inequality  Most middle class families incur costs after 2025, if the individual cuts expire on schedule. This is because the formula for how fast the tax brackets rise with inflation was changed, so the brackets rise more slowly, a subtle tax increase Sources:  CBO “Distributional Effects of Changes in Taxes and Spending under the Conference Agreement for HR 1” (December 2017)  Joint Committee on Taxation JCX58- ”Distributional Effects of the TCJA” (November 2017)
  • 20. Topics 20 1. Jobs and Employment 2. Wages and Inflation 3. GDP Growth 4. Budget Deficits & Debt 5. Trade 6. Other Measures
  • 21. Economists Overwhelmingly Agree: Tariffs Hurt America Overall (March ‘18) 21
  • 22. “So when a tariff drives up the price of imports to consumers, leading them to buy fewer imported goods, the welfare loss will be roughly: Loss = fall in imports * ½ tariff rate” Krugman estimates 2-3% GDP loss with a major trade war, if we had tariffs of 40% and a 70% decline in trade Significant employment disruption (11 million employed in export industries) Krugman: Effect of Higher Trade Barriers 22NYT: Paul Krugman “Thinking About a Trade War” (June 2018)
  • 23. How Trade Increases Output/GDP 23Peterson Institute for International Economics: Bradford, Grieco, and Hufbauer- “The Payoff to America from Global Integration” (2005)
  • 24. Topics 24 1. Jobs and Employment 2. Wages and Inflation 3. GDP Growth 4. Budget Deficits & Debt 5. Trade 6. Other Measures
  • 25. Stocks: Bull Market Since 2009 25  The stock market has been increasing since March 2009 without a 20% decline  The top 1% wealthiest own about 40% of stock market value  The top 10% wealthiest own about 81%  The bottom 80% own 8%  The bottom 50% have no direct or indirect stock ownership NYT: “Bull Market Hits a Milestone: 3,453 Days. Most Americans Aren’t at the Party.” (August 22, 2018) NPR: “While Trump Touts Stock Market, Many Americans Are Left Out Of The Conversation” (March 1, 2017)
  • 26. U.S. Household Net Worth Hit $100 Trillion in Q1 2018 26  Net worth reflects stock market (financial assets) and home equity  The globalized free trade system has been a massive wealth generator, but the gains were unequally distributed  Real (inflation-adjusted) household net worth has increased 2.5x since 1990  $100 trillion is about $800,000 per family if split evenly  Median (50th percentile family) had $100,000 net worth in 2016  The top 1% owns about 40% of this wealth, vs. 25% in the pre-Reagan era Real Net Worth (2018 $) Q1 2018 $100.7 trillion