Download as PDF, PPTX


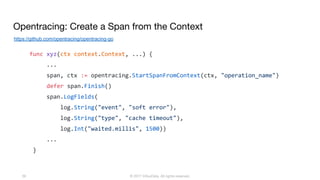
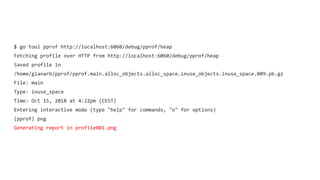
![gianarb.it ~ @gianarb
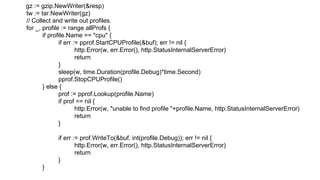
func FetchMetricFamilies(url string, ch chan<- *dto.MetricFamily, certificate string, key string, skipServerCertCheck bool) error {
defer close(ch)
var transport *http.Transport
if certificate != "" && key != "" {
cert, err := tls.LoadX509KeyPair(certificate, key)
if err != nil {
return err
}
tlsConfig := &tls.Config{
Certificates: []tls.Certificate{cert},
InsecureSkipVerify: skipServerCertCheck,
}
tlsConfig.BuildNameToCertificate()
transport = &http.Transport{TLSClientConfig: tlsConfig}
} else {
transport = &http.Transport{
TLSClientConfig: &tls.Config{InsecureSkipVerify: skipServerCertCheck},
}
}
client := &http.Client{Transport: transport}
return decodeContent(client, url, ch)
}
https://github.com/prometheus/prom2json/blob/master/prom2json.go#L123](https://image.slidesharecdn.com/kubernetes-debug-181024124440/85/Kubernetes-debug-like-a-pro-26-320.jpg)

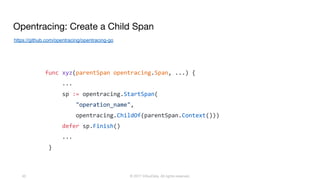
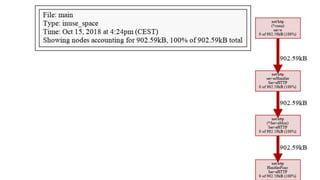
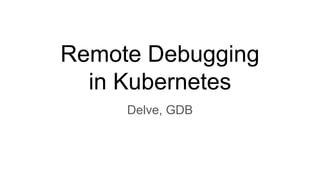
![Golang and Kubernetes: pprof
https://github.com/influxdata/influxdb/blob/4cbdc197b8117fee648d62e2e5be75c6575352f0/services/httpd/pprof.go
var allProfs = []*prof{
{Name: "goroutine", Debug: 1},
{Name: "block", Debug: 1},
{Name: "mutex", Debug: 1},
{Name: "heap", Debug: 1},
}](https://image.slidesharecdn.com/kubernetes-debug-181024124440/85/Kubernetes-debug-like-a-pro-47-320.jpg)
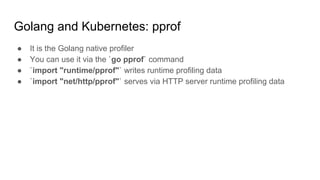
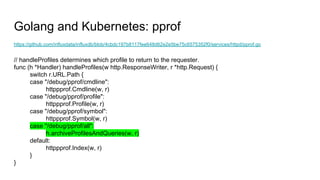
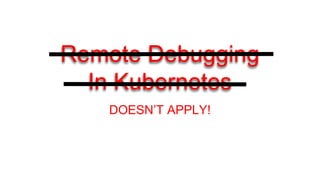
![Golang and Kubernetes: pprof
https://github.com/influxdata/influxdb/blob/4cbdc197b8117fee648d62e2e5be75c6575352f0/services/httpd/pprof.go
// Collect and write out the queries.
var allQueries = []struct {
name string
fn func() ([]*models.Row, error)
}{
{"shards", h.showShards},
{"stats", h.showStats},
{"diagnostics", h.showDiagnostics},
}
tabW := tabwriter.NewWriter(&buf, 8, 8, 1, 't', 0)
for _, query := range allQueries {
rows, err := query.fn()
if err != nil {
http.Error(w, err.Error(), http.StatusInternalServerError)
}](https://image.slidesharecdn.com/kubernetes-debug-181024124440/85/Kubernetes-debug-like-a-pro-49-320.jpg)
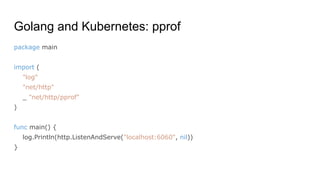
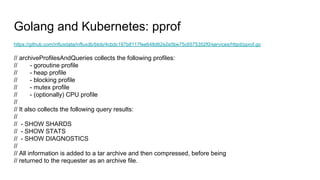
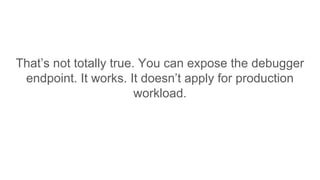
![func (h *Handler) showDiagnostics() ([]*models.Row, error) {
diags, err := h.Monitor.Diagnostics()
if err != nil {
return nil, err
}
// Get a sorted list of diagnostics keys.
sortedKeys := make([]string, 0, len(diags))
for k := range diags {
sortedKeys = append(sortedKeys, k)
}
sort.Strings(sortedKeys)
rows := make([]*models.Row, 0, len(diags))
for _, k := range sortedKeys {
row := &models.Row{Name: k}
row.Columns = diags[k].Columns
row.Values = diags[k].Rows
rows = append(rows, row)
}
return rows, nil
}](https://image.slidesharecdn.com/kubernetes-debug-181024124440/85/Kubernetes-debug-like-a-pro-50-320.jpg)

The document is about Kubernetes and GoLang, focusing on practical approaches to DevOps, CI/CD, and observability. It covers tools and strategies for migrating from YAML to code, implementing instrumentation with OpenCensus, and using pprof for profiling. Additionally, it emphasizes the need for collaboration among developers to enhance observability and performance in Kubernetes environments.